

Financial Statement Reading Benchmarks
| Metric | Benchmark |
|---|---|
| Three core statements every SMB needs | P&L, balance sheet, cash flow |
| Standard SMB reporting frequency | Monthly (close within 10 days) |
| Material variance threshold to investigate | +/- 5% on revenue, +/- 3pp on margin |
| Current ratio (healthy SMB) | 1.5-3.0 |
| Quick ratio (healthy SMB) | >1.0 |
| Gross margin target (B2B services) | 40-60% |
| EBITDA-to-cash conversion (healthy) | >80% |
| SMBs that can’t read their own financials | ~60% (NSBA survey) |
Most small business owners make major decisions based on gut feel rather than numbers, not because they’re careless, but because financial statements feel confusing, even intimidating. If you’ve ever stared at a balance sheet and wondered what it actually tells you about your business, you’re not alone. This guide cuts through the jargon and gives you a practical, step-by-step approach to reading, interpreting, and acting on your financial statements with real confidence. By the end, you’ll know exactly what to look for, what questions to ask, and how to turn raw numbers into smarter decisions.
Table of Contents
- Essential financial statements and what they reveal
- Step-by-step: How to read each financial statement
- Key financial ratios and what they really mean
- Common mistakes and red flags to watch for
- The truth about financial statements: What most SMB owners miss
- Take your financial confidence to the next level
- Frequently asked questions
Key Takeaways
| Point | Details |
|---|---|
| Monthly reviews matter | Review your financial statements every month to stay proactive about your business health. |
| Use trends not snapshots | Analyze trends across multiple periods for deeper insight—single numbers can be misleading. |
| Cash flow is key | Prioritize cash flow over net income when judging overall financial health. |
| Ratios reveal context | Financial ratios put your results in perspective and help with meaningful comparison. |
Essential financial statements and what they reveal
Financial statements are the scoreboard of your business. They tell you where you’ve been, where you stand today, and where you’re likely headed if current trends continue. There are three core documents every SMB owner needs to understand.
The balance sheet answers the question: what does the business own and owe right now? It shows your assets (cash, inventory, equipment, receivables), your liabilities (loans, accounts payable, credit lines), and your equity (what’s left over if you paid everything off). Think of it as a snapshot of your business’s net worth at a single moment in time.

The income statement (also called the profit and loss statement, or P&L) answers: did we make money this period? It shows your revenues, cost of goods sold, gross profit, operating expenses, and net income. This is the statement most owners look at first because it tells them whether the business was profitable.
The cash flow statement answers: where did the cash actually go? This is the one that often surprises people. A business can show a profit on the income statement and still run out of cash. The cash flow statement tracks money moving in and out across three categories: operating activities, investing activities, and financing activities.
Here’s a quick reference table to keep them straight:
| Statement | Key question answered | Review frequency |
|---|---|---|
| Balance sheet | What do we own and owe? | Monthly |
| Income statement | Did we make a profit? | Monthly |
| Cash flow statement | Where did the cash go? | Monthly |
| Financial ratios | How do we compare and trend? | Quarterly |
When it comes to analyzing financial position, none of these documents works well in isolation. They’re designed to be read together. A spike in net income means very little if cash flow is negative. A growing asset base could signal health or it could signal an expensive problem, depending on what’s funding it.
Key things to watch when reviewing all three statements each month:
- Compare current results to the prior month and the same month last year
- Check actual numbers against your budget or forecast
- Look for unexplained changes in any line item, not just the totals
- Track industry benchmarks when possible to understand where you stand against peers
According to best practices for SMB financial reviews, the recommended approach is to review statements monthly against prior periods and your budget, calculate ratios quarterly, and always look at trends across at least three periods before drawing conclusions.
Pro Tip: Always cross-reference the cash flow statement with the income statement. If net income is strong but operating cash flow is declining, that’s a major warning signal worth investigating immediately.
Step-by-step: How to read each financial statement
Now that you know what each statement is, here’s exactly how to read and interpret the details, step by step.
Reading the balance sheet:
- Start with total assets and confirm they’re growing over time. Growing assets generally indicate a growing business, but check what’s driving that growth.
- Review current assets (cash, receivables, inventory) separately from long-term assets (equipment, property). High receivables relative to cash can signal a collections problem.
- Look at current liabilities and compare them to current assets. If current liabilities exceed current assets, your short-term liquidity is under pressure.
- Check equity. If equity is shrinking despite profitability on the income statement, money is leaving the business somewhere, whether through draws, debt repayment, or losses not fully captured.
Reading the income statement:
- Start at the top: total revenue. Is it growing, flat, or declining compared to prior periods?
- Move to gross profit. Gross profit equals revenue minus cost of goods sold. A shrinking gross margin often means rising input costs or pricing pressure.
- Review operating expenses line by line. Look for categories that are growing faster than revenue.
- End with net income. This is the bottom line, but it’s not the whole story.
Reading the cash flow statement:
- Focus first on operating cash flow. This shows how much cash your core business activities generate or consume.
- Check investing activities for major purchases or disposals of assets.
- Review financing activities to see if the business is borrowing more or repaying debt.
The monthly financial health checks you build into your routine should always include comparing each statement to prior periods and to your budget vs. forecast. The budget tells you what you planned. The forecast tells you what you now expect. The actual statements tell you what really happened.
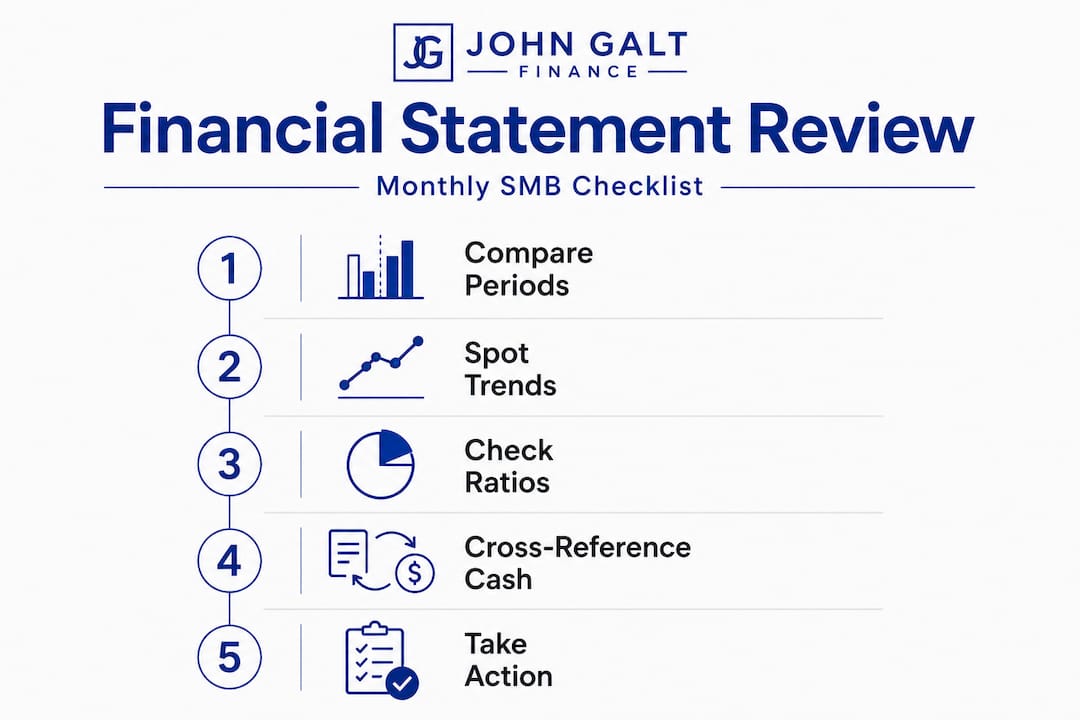
Here’s a comparison of common approaches to financial statement review:
| Approach | What it shows | Limitation |
|---|---|---|
| Single-period review | Current performance | No context or trend |
| Month-over-month | Short-term changes | Seasonal effects can mislead |
| Year-over-year | Seasonal-adjusted growth | Misses recent shifts |
| Budget vs. actual | Performance vs. plan | Only as good as your budget |
| 3+ period trend | True directional movement | Requires consistent data |
“Trends over 3+ periods reveal more than single-month snapshots.” This is true for every line item on every statement. A single bad month is noise. Three consecutive bad months is a signal you need to act on.
Industry best practices for monthly reviews confirm that the most valuable analysis comes from comparing across multiple periods, matching results to your budget, and benchmarking against peers in your industry. One month rarely tells the full story.
Key financial ratios and what they really mean
Simply reading the numbers isn’t enough. You need to know what they mean in context. That’s where financial ratios come in.
Ratios take two numbers from your financial statements and combine them to give you a meaningful relationship. Instead of just knowing you have $50,000 in current assets, a ratio tells you whether that’s enough to cover your short-term obligations. Context transforms raw data into insight.
Here are the three categories of ratios every SMB owner should track:
Profitability ratios measure how efficiently your business generates profit:
- Gross margin = Gross profit divided by revenue. Shows what percentage of revenue remains after production costs.
- Net profit margin = Net income divided by revenue. Shows overall profitability after all expenses.
- Return on equity = Net income divided by total equity. Measures how well the business generates returns for its owners.
Liquidity ratios measure your ability to meet short-term obligations:
- Current ratio = Current assets divided by current liabilities. A ratio above 1.0 means you have more short-term assets than debts due soon.
- Quick ratio = (Current assets minus inventory) divided by current liabilities. A stricter measure that excludes inventory since it can take time to convert to cash.
Leverage ratios measure how much debt you carry relative to equity:
- Debt to equity = Total liabilities divided by total equity. Higher ratios signal greater financial risk.
- Interest coverage ratio = Operating income divided by interest expense. Shows whether you’re earning enough to comfortably cover your debt payments.
When tracking essential SMB financial metrics over time, patterns matter far more than any single data point. A current ratio of 1.5 might look fine, but if it was 2.2 six months ago, that declining trend is something to take seriously before it becomes a crisis.
As financial analysis research makes clear, raw numbers are insufficient on their own because ratios provide context, but even ratios are most powerful when tracked as trends rather than isolated snapshots. A single ratio in isolation tells you very little. That same ratio measured over eight quarters tells a story.
The kind of insight that CFO financial analysis brings to an SMB is exactly this: pattern recognition across periods, benchmarks, and ratios working together to give leadership a complete and honest picture.
Pro Tip: Prioritize operating cash flow over net income as your primary health indicator. A business with strong net income and declining operating cash flow is showing early warning signs that deserve immediate investigation.
Common mistakes and red flags to watch for
Even with a framework in place, many business owners fall into predictable traps. Here’s how to spot and avoid them for sharper analysis.
“Ratios contextualize, but trends reveal the real story behind your numbers.” This distinction matters because a single ratio can mislead, while a deteriorating trend across periods will always tell the truth.
The most common mistakes SMB owners make when reviewing financial statements, and how to fix them:
- Focusing only on net income. Net income can be manipulated by accounting choices like depreciation timing or accrual entries. Operating cash flow is much harder to dress up and is a far more reliable indicator of financial health, as financial red flag research consistently shows.
- Reviewing only a single period. Looking at just one month or one quarter strips your numbers of all context. Always compare at least three periods side by side before reaching any conclusion.
- Skipping the budget comparison. Your actual results only become meaningful when measured against what you planned. A $10,000 profit looks very different if you budgeted $25,000.
- Ignoring industry benchmarks. Your gross margin might feel acceptable until you realize competitors average 10 points higher. Benchmarking is how you find operational gaps you didn’t know existed.
- Missing line-item changes inside the totals. Totals can look stable while individual line items shift dramatically. A flat operating expense total could be hiding a sharp rise in one category offset by accidental cuts in another.
Setting up a daily financial dashboard can help you catch line-item changes before they compound into bigger problems. When you track key SMB financial metrics consistently, anomalies become visible much earlier, giving you time to act rather than react.
Red flags to watch for specifically:
- Accounts receivable growing faster than revenue (customers are paying more slowly)
- Inventory rising without a corresponding revenue increase (potential overstock or obsolescence)
- Operating cash flow consistently lower than net income over multiple periods
- Gross margin declining without a clear explanation tied to strategy
- Short-term debt rising to fund operations rather than growth
The truth about financial statements: What most SMB owners miss
Here’s the uncomfortable reality: most small business owners treat the income statement like it’s the whole story. Profit is what matters, right? Not quite. This is where conventional thinking actually works against you.
A business can be profitable and insolvent at the same time. We’ve seen it repeatedly. Revenue is up, net income looks great, and then the business can’t make payroll because cash is sitting in unpaid invoices. The income statement said you were winning. The bank account said otherwise. This is why mastering cash flow forecasting is not optional for a serious SMB owner. It’s foundational.
The real shift happens when you stop treating financial statements as a historical report and start using them as a forward-looking tool. When you track trends across quarters, compare operating cash flow to net income regularly, and benchmark against your industry, you stop being surprised by your numbers. You start seeing problems three months before they hit and opportunities you would have otherwise missed.
Most businesses that struggle with cash flow aren’t failing at sales. They’re failing at financial literacy. The good news is that this is entirely fixable once you change what you measure and how often you look at it. Financial red flags rarely appear overnight. They build slowly, and they’re visible in the trend data long before they become crises.
The owners who make the best decisions aren’t necessarily the ones with the most revenue or the best products. They’re the ones who understand what their numbers are actually saying, and who build the habit of listening to them every single month.
Take your financial confidence to the next level
Understanding your financial statements is the foundation, but applying that understanding consistently is where the real results come from. Most SMB owners have the intelligence to interpret their numbers. What they lack is the system, the structure, and the expert perspective to do it reliably month after month.
At John Galt Finance, we help businesses like yours build that structure. Whether you’re looking to sharpen your practical financial planning, conduct a real in-depth profit margin analysis, or simply want a clear-eyed assessment of where your business stands right now, we bring CFO-level insight without the overhead of a full-time hire. Start with a financial health check and get a concrete picture of what your numbers are really telling you.
Frequently asked questions
What is the most important financial statement for a small business?
The cash flow statement is often the most critical because it shows how much cash is actually available to run and grow your business, since a profitable business can still fail if operating cash flow is negative.
How often should I review my financial statements?
You should review your main financial statements at least monthly, and best practice guidance recommends calculating ratios quarterly and tracking trends across at least three periods.
What are common red flags in financial statements?
Watch for declining operating cash flow relative to net income, rising accounts receivable, and unexplained changes in gross margin compared to previous periods.
Why are ratios important for financial statement analysis?
Ratios put your numbers into context and help you measure performance, spot issues, and compare with peers, because monthly ratio tracking across multiple periods reveals trends that raw numbers alone will never show.
Recommended
- Why analyze financial position: unlock stability & growth
- CFO-Led Financial Analysis: Smarter SME Decisions
- Unlock profitability with industry-specific financial analysis
- Essential financial metrics to track for SMB growth: 2026
FAQ
What’s the order I should read my financial statements?
Cash flow first (do we have money?), then P&L (are we profitable?), then balance sheet (what do we own and owe?). Most owners read the P&L first, miss the cash story, and get blindsided by liquidity issues.
What’s the difference between EBITDA and cash flow?
EBITDA strips out interest, taxes, depreciation, and amortization to approximate operating cash. Real cash flow further adjusts for working capital changes, capex, and debt service. A growing business often shows strong EBITDA while burning cash. See our EBITDA explained guide for the full bridge.
How do I spot red flags in my own financials?
Five quick checks: (1) AR growing faster than revenue, (2) gross margin declining 2+ months in a row, (3) cash balance flat while revenue grows, (4) debt rising without matching asset growth, (5) opex growing faster than revenue. Any one of these warrants deeper analysis.
What’s a healthy balance sheet for an SMB?
Current ratio 1.5-3.0, quick ratio above 1.0, debt-to-equity under 2.0, AR days under 45 (B2B), and inventory turns appropriate for industry (8-12x for distributors). A clean balance sheet is your safety net during downturns.
How often should I review my statements with my accountant?
Monthly for SMBs over $500k revenue. Quarterly is the minimum to catch issues before they compound. If your accountant only prepares year-end statements, you’re flying blind 11 months a year.