

Financial Analysis Benchmarks for SMBs
| Metric | Benchmark |
|---|---|
| Gross margin (B2B services SMB) | 40-60% |
| Gross margin (SaaS) | 70-85% (Bessemer) |
| EBITDA margin (mature SMB) | 10-20% |
| Current ratio (healthy) | 1.5-3.0 |
| Quick ratio (healthy) | >1.0 |
| Debt-to-equity ratio (healthy SMB) | <2.0 |
| Return on equity (top quartile SMB) | >15% |
| Revenue per FTE (services SMB) | $150,000-$300,000 |
Your income statement and balance sheet tell you what happened. They don’t tell you why it happened, what’s coming next, or what you should do about it. Too many small and medium-sized business (SMB) owners mistake financial reporting for financial analysis, and that gap costs them real money. Financial analysis in SMBs involves systematic examination of financial statements to enable data-driven decisions for growth and stability. This guide breaks down the key techniques, benchmarks, and real-world results that separate businesses that react from businesses that grow.
Table of Contents
- Why financial analysis matters for SMBs
- Core financial analysis methodologies every SMB should use
- Benchmarks and what “good” looks like: decoding industry standards
- How financial analysis drives real SMB results
- Why most SMB financial analysis falls short—and how to do better
- Take your SMB financial analysis to the next level
- Frequently asked questions
Key Takeaways
| Point | Details |
|---|---|
| Beyond basic reports | True financial health requires analysis, not just tracking revenue or expenses. |
| Context is critical | Interpreting ratios properly means comparing trends and benchmarks for your industry. |
| Expert help drives results | Outsourced CFOs and financial pros can close knowledge gaps and enable smarter decisions. |
| Benchmarks are guidelines | Financial benchmarks vary by sector and should not be applied without context. |
| Analysis powers growth | Applying robust financial analysis strategies directly supports SMB growth and resilience. |
Why financial analysis matters for SMBs
Most SMB owners look at their financials once a month, scan the bottom line, and move on. That’s reporting. Analysis is something entirely different.
Financial reporting organizes your numbers. Financial analysis interrogates them. It asks: Is your gross margin shrinking quarter over quarter? Are customers paying slower than last year? Is your cash position healthy enough to survive a 90-day revenue dip? SMBs that systematically examine income statements, balance sheets, and cash flow statements to evaluate profitability, liquidity, financial health, and operational efficiency are the ones that catch problems early and capitalize on opportunities faster.
The business outcomes are concrete:
- Better decisions: You stop guessing and start acting on evidence
- Faster growth: You identify which products, customers, or channels drive real margin
- Greater resilience: You build cash buffers before you need them, not after
- Stronger investor confidence: Lenders and investors trust businesses that understand their own numbers
“Gut instinct built your business. Data will scale it. The owners who combine both are the ones who survive economic downturns and come out stronger.”
The risk of skipping analysis is real. A business running on gut instinct might feel profitable while quietly bleeding cash. Inventory builds up. Receivables age. Margins erode by two points per quarter. None of that shows up as an alarm on a basic P&L. That’s exactly why understanding the need for CFO services is growing among SMBs that want to compete seriously.
Core financial analysis methodologies every SMB should use

There are four core methodologies every SMB owner should know and apply regularly. Each one answers a different question about your business.
Ratio analysis measures relationships between line items. Your current ratio (current assets divided by current liabilities) tells you whether you can pay short-term bills. Your gross margin ratio tells you how efficiently you convert revenue into profit before overhead. Key methodologies include ratio analysis covering current ratio, quick ratio, debt-to-equity, gross margin, return on equity (ROE), and return on assets (ROA), alongside trend analysis, variance analysis, flux analysis, and benchmarking against industry standards.
Trend analysis tracks the same metric over multiple periods. A gross margin of 38% looks fine in isolation. A gross margin that has dropped from 44% to 38% over six quarters tells a completely different story about pricing pressure or rising input costs.
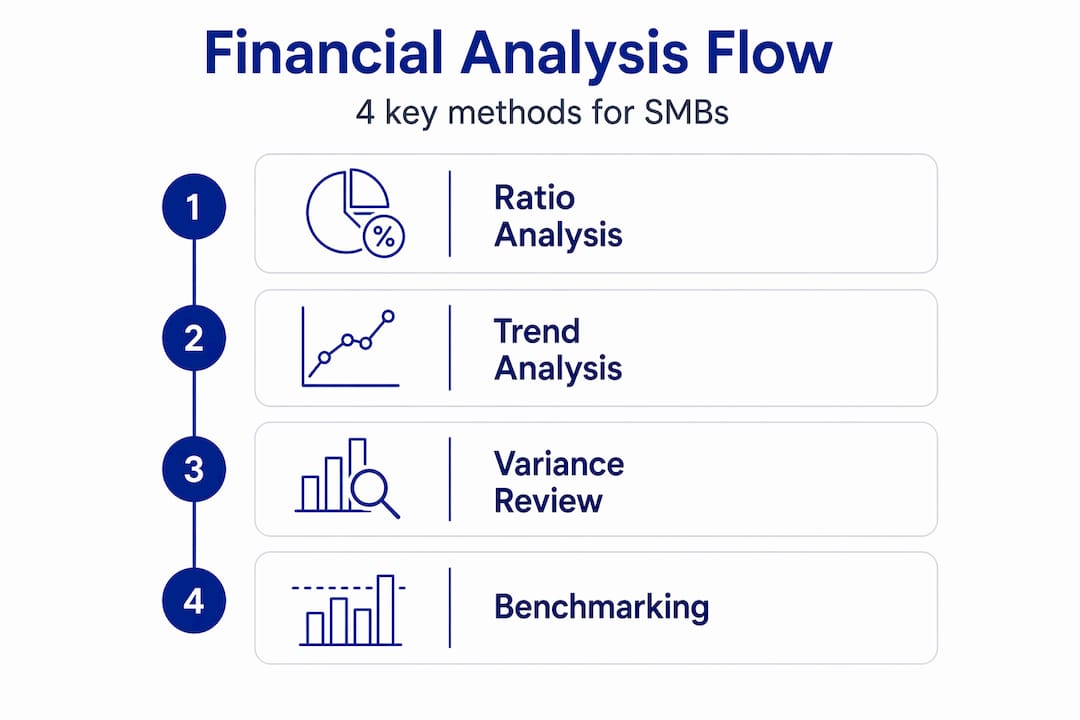
Variance analysis compares actual results to your budget or forecast. If you budgeted $180,000 in revenue for Q2 but only hit $152,000, variance analysis forces you to explain the gap. Was it one lost client? A delayed project? A pricing issue? Without this discipline, the same miss happens again next quarter.
Benchmarking compares your metrics against industry standards or competitors. It answers the question: Is our performance normal, or are we leaving money on the table?
| Methodology | What it answers | How often to run |
|---|---|---|
| Ratio analysis | Are we financially healthy right now? | Monthly |
| Trend analysis | Are we improving or declining over time? | Quarterly |
| Variance analysis | Are we hitting our plan? | Monthly |
| Benchmarking | How do we compare to our industry? | Annually or semi-annually |
A common SMB pitfall is relying on a single ratio from a single year and drawing big conclusions. One good current ratio doesn’t mean you’re liquid. One strong revenue quarter doesn’t mean your business model is working. Context is everything. Always layer your SMB financial metrics across time periods and industry comparisons before making strategic moves.
Pro Tip: Run a simple actual vs. budget variance report every month. Even a basic spreadsheet that flags line items more than 10% off budget will surface issues before they become crises.
Benchmarks and what “good” looks like: decoding industry standards
Benchmarks are useful reference points, not gospel. Understanding what typical SMB numbers look like gives you a starting point for interpretation, but your industry, business model, and growth stage all change what “healthy” actually means for your company.
Here’s a snapshot of common SMB financial benchmarks to use as a baseline:
| Metric | SMB benchmark | What it signals |
|---|---|---|
| Finance function cost | 1.2% to 3.5% of revenue | Overhead efficiency |
| Current ratio (EU SME avg) | 1.28 | Short-term liquidity |
| Quick ratio | 0.84 | Immediate liquidity without inventory |
| Gross margin | 32% | Core profitability before overhead |
| Net profit margin | 2.8% | Bottom-line efficiency |
| Days Sales Outstanding (DSO) | 48 days | Receivables collection speed |
These benchmark figures for SMBs cover finance function costs, current ratio, quick ratio, gross margin, net profit margin, and DSO, giving owners a concrete starting point for comparison.
But here’s where most business owners go wrong: they see a quick ratio of 0.84 and assume they’re fine because it’s “average.” Average in a sector with predictable monthly contracts looks very different from average in a project-based business where revenue arrives in lumps. A software-as-a-service company with 0.84 might be perfectly healthy. A construction firm with the same number might be one delayed payment away from a payroll crisis.
Key things to watch when interpreting benchmarks:
- Your cash conversion cycle: How long does it take to turn inventory or services into cash? A longer cycle demands a higher current ratio buffer.
- Seasonality: A retailer’s quick ratio in January looks terrible compared to December. That’s normal.
- Growth stage: Fast-growing businesses often have thinner margins and tighter ratios because they’re reinvesting aggressively.
- Customer concentration: If 40% of your revenue comes from one client, your financial risk profile is very different from a business with 200 small customers.
Single metrics lack context, so always use trend analysis and industry-specific benchmarks together to avoid misinterpretation. Tracking your own trends over 12 to 24 months is often more revealing than any external benchmark. Understanding how to interpret these numbers is core to mastering financial KPIs that actually drive business decisions.
How financial analysis drives real SMB results
Theory is useful. Numbers that change real businesses are better. Here’s what happens when SMBs move from basic reporting to genuine financial analysis.
- A $12M manufacturer improved cash runway by 73%. By analyzing their working capital cycle and identifying where cash was trapped in inventory and slow receivables, they restructured payment terms with both suppliers and customers. The result: 73% improvement in cash runway, 18% reduction in customer acquisition cost, and a 7-point improvement in payroll efficiency. None of that was visible on a standard monthly P&L.
- A fractional CFO saved $2M in cash and grew margins by 15%. An SMB brought in outsourced CFO support after struggling to understand why revenue was growing but cash wasn’t. The analysis revealed a mismatch between billing cycles and expense timing, plus a product line with negative contribution margin that was masked by overall revenue growth. Fixing both saved $2M in cash and drove a 15-point margin improvement.
- A loss-making business turned a 9% profit margin. Through detailed variance and segment analysis, a services business discovered that two client types were profitable and three were actively destroying margin. Refocusing on the right clients and repricing the rest turned losses into a 9% profit margin.
These aren’t outliers. They’re what happens when analysis replaces assumption.
The trigger for bringing in outside expertise is usually one of these situations:
- Revenue is growing but cash is always tight
- Margins feel inconsistent and you can’t explain why
- You’re preparing for a funding round or acquisition
- Your bookkeeper gives you reports but no interpretation
- You’ve had one or two financial surprises that cost you badly
SMBs are often overconfident in their financial preparedness despite thin reserves, and outsourcing bridges the expertise gap for growth-stage firms that can’t justify a full-time CFO salary. A fractional CFO guide can help you understand exactly what that support looks like in practice, and how businesses use it to solve cash flow management struggles before they become emergencies.
Pro Tip: If you’ve had even one financial surprise in the past 12 months that you didn’t see coming, that’s your signal. A single blind spot in your analysis can cost more than a year of outsourced CFO fees.
Why most SMB financial analysis falls short—and how to do better
Here’s the uncomfortable truth we see repeatedly: most SMB financial analysis is backward-looking, infrequent, and siloed. Business owners review last quarter’s numbers, feel relieved or worried, and then go back to running the business. Nothing changes. The same surprises repeat.
The core problem is that looking at last quarter’s numbers alone guarantees surprises in tough times. Markets shift. Customer behavior changes. Input costs move. A quarterly review that only looks backward gives you a 90-day lag before you can react. By then, the damage is already done.
What actually works is building a monthly rhythm of three specific habits. First, run a variance review every single month. Compare actuals to budget line by line and force yourself to explain every variance over 10%. This builds pattern recognition faster than any financial course. Second, track five to seven core ratios on a rolling 12-month basis. Seeing a trend develop over eight months is far more valuable than a snapshot. Third, benchmark against your own prior periods before you benchmark against industry averages. Your business is your best baseline.
Expert nuance confirms that single metrics lack context and that trend analysis combined with industry-specific benchmarks is the only reliable way to avoid misinterpretation. We’ve seen businesses with excellent current ratios run out of cash because they ignored DSO trends. We’ve seen businesses with thin margins outperform peers because their cash conversion cycle was optimized. The number alone is never the story.
The other shift that changes outcomes is the nature of the conversation around the numbers. Most SMB owners talk to their accountant once a year at tax time. That’s compliance, not strategy. A CFO support workflow built around monthly reviews, forward-looking forecasts, and scenario planning changes what questions you even think to ask. It moves you from “what happened?” to “what should we do next?” That shift is where real growth comes from.
Outsourced and fractional CFOs change the nature of analysis because they bring pattern recognition from dozens of businesses across multiple industries. They know what a 48-day DSO means for a services firm versus a product company. They know when a gross margin drop is a pricing problem versus a cost problem. That context is worth more than any spreadsheet.
Take your SMB financial analysis to the next level
If reading this made you realize your financial analysis has gaps, you’re not alone. Most SMBs are working with good data and limited interpretation. The good news is that you don’t need to hire a full-time CFO to fix it.
John Galt Finance provides outsourced CFO-level expertise built specifically for businesses like yours, with 5 to 50 employees and revenues between $500K and $20M. Our team delivers the kind of financial analysis that turns your existing reports into genuine strategic insight. From profitability diagnostics to cash flow forecasting to variance review frameworks, we build the financial infrastructure that growing businesses need. Explore the outsourced CFO benefits that our clients use to grow faster, or learn how remote CFO services can give you senior financial expertise without the overhead. If you’re ready to think bigger about your finance function, start by exploring what outsourcing your finance team actually looks like in practice.
Frequently asked questions
What is the difference between financial reporting and financial analysis?
Financial reporting organizes and presents past data, while analysis interprets that data to identify trends, risks, and action opportunities. Financial analysis enables data-driven decisions for growth and stability, going well beyond what a standard report shows.
Which financial ratios are most important for SMBs to track?
Current ratio, quick ratio, gross margin, and net profit margin are the most critical for monitoring liquidity and profitability. Key ratio methodologies also include ROE, ROA, and debt-to-equity for a complete picture of financial health.
How often should SMBs conduct financial analysis?
SMBs should perform in-depth financial analysis at least quarterly, with monthly reviews strongly recommended for fast-moving or growth-stage companies. Monthly variance reviews in particular catch problems before they compound.
What are the signs that an SMB could benefit from outsourced CFO services?
If your business faces cash flow surprises, inconsistent margins, or lacks clear financial forecasting, outsourced CFO support can help unlock growth and stability. Preparing for a funding round or acquisition is another strong signal that senior financial expertise is needed.
Does benchmarking always reflect a healthy SMB?
No. Industry benchmarks vary significantly by sector, business model, and growth stage, so a number that looks healthy in one context can signal risk in another. Single metrics lack context, so always compare your own trends over time alongside any external benchmark.
Recommended
- Essential financial metrics to track for SMB growth: 2026
- Unlock business growth with a custom financial modeling process
- Remote CFO services: Unlock strategic growth for SMBs
- Strategic financial planning: Your SMB guide to smarter growth
FAQ
What’s the single most important financial ratio for an SMB?
Cash conversion cycle (DSO + DIO – DPO). It tells you how many days your cash is locked up in operations. A 10-day improvement at $5M revenue frees ~$137k in working capital. Profitability ratios matter, but liquidity kills businesses faster.
How do I benchmark my SMB against the industry?
Sources by reliability: RMA Annual Statement Studies (gold standard, paid), BizMiner, IBISWorld, and your industry trade association. Apply benchmarks to revenue tiers similar to yours; comparing a $2M business to industry medians (often skewed by $50M+ firms) is misleading.
What’s a healthy gross margin for my business?
Depends on model: SaaS 70-85%, professional services 40-60%, distribution 15-30%, retail 30-50%, manufacturing 25-45%. See our profit margin analysis guide for diagnostic frameworks.
How often should I analyze my financials in depth?
Monthly variance review (1 hour), quarterly deep-dive (half day), annual strategic review (2 days). Quarterly is where most SMBs find the most insight; it’s enough time for trends to emerge but not so much that issues fester.
What financial analysis matters most before raising capital?
Unit economics (CAC, LTV, payback period), cohort retention, gross margin trend, and a clean cash flow bridge from net income to free cash flow. Investors will discount your valuation by 20-40% if these aren’t ready. See our investor-readiness guide.