

Financial KPI Benchmarks for SMBs
| KPI | Benchmark |
|---|---|
| Gross margin (B2B services) | 40-60% |
| EBITDA margin (mature SMB) | 10-20% |
| Revenue growth rate (top quartile SMB) | 20%+ annually |
| Customer acquisition cost (CAC) payback | <12 months |
| LTV:CAC ratio | >3:1 |
| Net revenue retention (SaaS) | >100% (best-in-class >120%) |
| Cash conversion cycle (manufacturer) | <60 days |
| Revenue per FTE (services) | $150,000-$300,000 |
Most business owners are either drowning in spreadsheets or flying blind with gut instinct alone. Neither works. The real problem is not a lack of data but tracking the wrong numbers or misreading what they mean. Financial KPIs (Key Performance Indicators) are not a corporate luxury reserved for Fortune 500 companies. They are the clearest signal system available to any SMB owner who wants to make faster, more confident decisions. This guide breaks down the KPIs that actually move the needle, translates the jargon into plain language, and shows you exactly how to apply them to your business today.
Table of Contents
- What are financial KPIs and why do they matter?
- Profitability KPIs: Measuring the bottom line
- Liquidity KPIs: Can your business meet its financial obligations?
- Efficiency and growth KPIs: How well are you operating and scaling?
- Why the best KPI playbook is one you customize
- Take your financial strategy further with expert support
- Frequently asked questions
Key Takeaways
| Point | Details |
|---|---|
| Core KPI categories | SMBs should focus on profitability, liquidity, efficiency, and growth when choosing KPIs. |
| Not all KPIs fit | Select and customize KPIs to suit your business stage and industry rather than copying generic lists. |
| Monitor regularly | Review your chosen KPIs consistently to spot trends quickly and course-correct before issues grow. |
| Understand the story | The right KPIs answer very specific questions about your business health and momentum. |
| Expert help adds value | A fractional CFO or finance specialist can help you create and interpret powerful KPI dashboards. |
What are financial KPIs and why do they matter?
A Key Performance Indicator is a measurable value that tells you how effectively your business is achieving its goals. In a financial context, KPIs are the numbers that reveal whether your business is healthy, stressed, growing, or quietly bleeding cash. They are not vanity metrics. They are diagnostic tools.
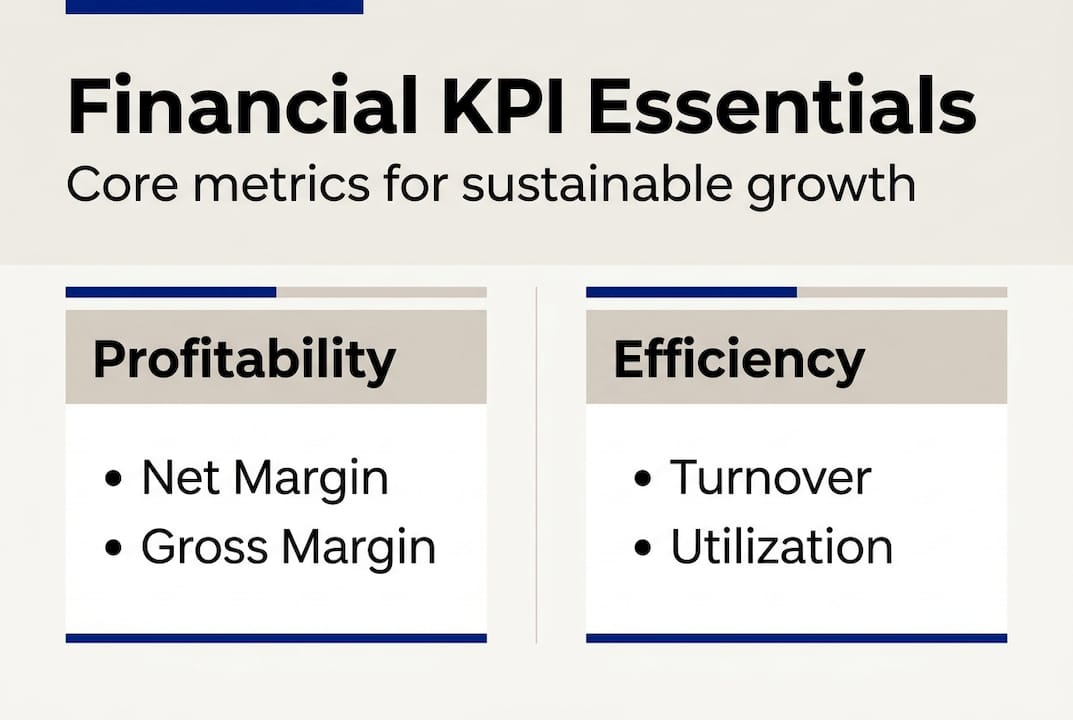
For small and medium-sized businesses, financial KPIs for SMBs are categorized into four core groups: profitability, liquidity, efficiency, and growth. Each category answers a distinct question about your business.
- Profitability: Are you actually making money after all costs?
- Liquidity: Can you cover your bills and survive a slow month?
- Efficiency: Are your operations lean, or are you leaving cash on the table?
- Growth: Is your business expanding, stalling, or contracting?
Think of these four categories as the dashboard of a car. You would not drive without checking your speed, fuel, and engine temperature. Running a business without these KPIs is exactly that.
“Owners who consistently track the right financial KPIs report making faster, more confident decisions, especially when facing growth inflection points or cash pressure.”
The power of KPIs is not just in measurement. It is in prioritization. When you know your numbers, you stop guessing and start steering. You can spot a problem three months before it becomes a crisis. You can identify which product line is quietly dragging down your margins. You can tell investors, lenders, or partners a clear financial story backed by data.
If you are not sure where to start, exploring essential financial metrics for SMB growth gives you a strong foundation. And if you are wondering whether your business has outgrown your current financial setup, reviewing when you need a CFO can help you recognize the signs early. The goal is not to track everything. It is to track what matters most for your specific business right now.
A well-chosen set of financial KPIs every owner should track becomes a repeatable system, not a one-time exercise.
Profitability KPIs: Measuring the bottom line
Profitability KPIs tell you whether your business model actually works. Revenue is not profit. Many SMBs with strong top-line numbers are quietly losing money once all costs are factored in. These three KPIs cut through the noise.

Gross Profit Margin (GPM) measures how efficiently you produce your product or deliver your service. The formula: (Revenue minus Cost of Goods Sold) divided by Revenue. A healthy SMB target is 30 to 50 percent or higher, depending on your industry. A SaaS business might sit at 75 percent. A retail store might run at 35 percent. Neither is wrong. Context is everything.
Net Profit Margin goes deeper. It accounts for every expense: rent, salaries, taxes, interest, and overhead. This is your true bottom line. A business can have a 50 percent gross margin and a 3 percent net margin, which means operational costs are consuming most of the value created.
EBITDA (Earnings Before Interest, Taxes, Depreciation, and Amortization) strips out financing and accounting decisions to show raw operational profitability. It is especially useful when comparing your business to industry peers or preparing for a funding conversation.
| Metric | Retail benchmark | SaaS benchmark | Professional services |
|---|---|---|---|
| Gross Profit Margin | 30 to 40% | 70 to 90% | 50 to 70% |
| Net Profit Margin | 2 to 6% | 10 to 20% | 15 to 25% |
| EBITDA Margin | 4 to 8% | 15 to 30% | 20 to 35% |
Here is what each profitability KPI helps you answer:
- GPM: Is my pricing and production model sustainable?
- Net Profit Margin: Are my operating costs under control?
- EBITDA: How does my operational performance compare to competitors?
Pro Tip: Watch the gap between your gross margin and net margin closely. A widening gap means costs are growing faster than revenue. That gap is where profit leaks hide, often in underpriced services, bloated overhead, or untracked expenses.
Your small business pricing strategy directly impacts GPM, so revisiting your pricing model is one of the fastest ways to improve profitability without cutting staff or reducing quality. Tracking these key financial KPIs consistently turns profitability from a quarterly surprise into a predictable outcome.
Liquidity KPIs: Can your business meet its financial obligations?
A profitable business can still fail. That sounds counterintuitive, but it happens regularly when a company cannot convert its assets into cash fast enough to pay its bills. Liquidity KPIs measure your ability to meet short-term obligations, and they are often the difference between surviving a slow quarter and closing your doors.
Current Ratio is the most widely used liquidity measure. The formula: Current Assets divided by Current Liabilities. A Current Ratio of 1.5 to 2 is considered healthy for most SMBs. Below 1 means you owe more in the short term than you have available, which is a serious warning sign.
Quick Ratio is a stricter version. It removes inventory from current assets before dividing by current liabilities. This matters because inventory is not always easy to convert to cash quickly, especially in manufacturing or retail.
| Ratio | Formula | Healthy range | What it signals |
|---|---|---|---|
| Current Ratio | Current Assets / Current Liabilities | 1.5 to 2.0 | Overall short-term health |
| Quick Ratio | (Current Assets minus Inventory) / Current Liabilities | 1.0 to 1.5 | Stress-tested liquidity |
Here is how to calculate and interpret your ratios:
- Pull your most recent balance sheet.
- Identify total current assets (cash, receivables, inventory).
- Identify total current liabilities (accounts payable, short-term debt).
- Divide assets by liabilities for Current Ratio.
- Subtract inventory from assets, then divide again for Quick Ratio.
- Compare your results to the benchmarks above and track changes monthly.
Pro Tip: If your business holds significant inventory, the Quick Ratio is your real stress test. A strong Current Ratio can mask a liquidity problem if most of your assets are tied up in slow-moving stock.
“For inventory-heavy businesses, a Current Ratio above 2 can still signal risk if inventory turnover is slow. Always read liquidity ratios alongside efficiency data for a complete picture.”
A regular financial health check helps you catch liquidity issues before they become emergencies. Monitoring liquidity metrics for SMBs alongside profitability gives you the full picture of your financial position.
Efficiency and growth KPIs: How well are you operating and scaling?
Profitability and liquidity tell you where you stand. Efficiency and growth KPIs tell you how fast you are moving and whether your operations support that speed. These metrics expose bottlenecks, slow payers, and hidden cash traps that net profit alone will never reveal.
Key efficiency and growth KPIs for SMBs include:
- Inventory Turnover: How many times you sell and replace inventory in a period. Higher turnover means less cash tied up in stock. Low turnover signals overbuying or weak demand.
- Accounts Receivable Turnover: How quickly customers pay you. A low ratio means cash is sitting in unpaid invoices instead of your bank account.
- Cash Conversion Cycle (CCC): The number of days it takes to convert investments in inventory and receivables into actual cash. Shorter is better. Manufacturing firms often see a CCC of 60 to 90 days, while service businesses can achieve 15 to 30 days.
- Revenue Growth Rate: The percentage increase in revenue over a set period. It signals business momentum, market fit, and scalability potential.
Stat callout: Manufacturing businesses average a Cash Conversion Cycle of 60 to 90 days, while service-based firms often achieve 15 to 30 days, reflecting how capital-intensive operations slow cash flow.
Efficiency KPIs are especially powerful because they reveal problems that profitability metrics hide. You might show a healthy net margin while carrying 90 days of unpaid invoices. That is a cash flow crisis waiting to happen. Improving managing receivables efficiency directly shortens your CCC and frees up working capital without any new revenue.
For businesses with complex inventory or payment cycles, working capital insights provide a deeper framework for optimization. If you run a software or subscription business, a dedicated SaaS KPIs guide will help you prioritize the metrics most relevant to your model.
The right efficiency KPIs depend on your business model. A product company prioritizes inventory turnover. A service firm focuses on receivables and utilization rates. Match the metric to the model.
Why the best KPI playbook is one you customize
Here is the uncomfortable truth most financial guides skip: there is no universal KPI list that works for every business. Generic KPI checklists are a starting point, not a strategy.
A pre-revenue startup should be obsessing over burn rate and runway, not Return on Invested Capital (ROIC). A mature, cash-generating business should be tracking ROIC, customer lifetime value, and margin trends, not burn rate. Applying the wrong KPIs to the wrong stage is like using a marathon training plan to prepare for a sprint. The effort is real but the result is off.
Tailoring KPIs to your stage and goals is what separates businesses that use data to grow from those that collect data and feel busy. We have seen SMBs track 20 KPIs religiously and still make poor decisions because none of those metrics connected to their actual constraints.
The businesses that win are the ones that ask: “What are the two or three numbers that, if they moved, would change everything about how we operate?” That question leads to a focused, actionable KPI dashboard. Building a custom KPI modeling framework around your specific business model, stage, and goals is the most direct path from data collection to real decision-making power.
Take your financial strategy further with expert support
Understanding KPIs is one thing. Building a system that tracks, interprets, and acts on them consistently is another challenge entirely.
At John Galt Finance, we build custom financial modeling frameworks tailored to your business stage, industry, and goals. Whether you need a focused KPI dashboard, a full profitability analysis, or ongoing strategic guidance, our team delivers CFO-level insight without the cost of a full-time hire. You can also explore more on financial KPIs to deepen your understanding before taking the next step. When you are ready for hands-on support, our Fractional CFO services give you the expertise to turn the right numbers into the right decisions, every month.
Frequently asked questions
Which financial KPIs are most important for small businesses?
Profitability margins, current ratio, quick ratio, and revenue growth rate are the most essential for most SMBs, as they cover the four core financial KPI categories: profitability, liquidity, efficiency, and growth.
How often should I update my financial KPIs?
Review your KPIs monthly at minimum, and shift to weekly tracking during periods of rapid growth, cash pressure, or significant operational change.
What’s the difference between Gross Profit Margin and Net Profit Margin?
Gross Profit Margin measures production efficiency by comparing revenue to the cost of goods sold, while Net Profit Margin reflects true profitability after every expense including overhead, taxes, and interest.
Can too many KPIs be a bad thing?
Absolutely. Tracking too many metrics creates noise and dilutes focus. The best approach is to tailor KPIs to stage and goals so every number on your dashboard connects directly to a decision you need to make.
What if my industry’s average KPI numbers are very different?
Industry benchmarks like retail’s 30 to 40% gross margin versus SaaS at 70 to 90% exist as context, not rules. Your internal trend over time is a more reliable signal than any external average.
Recommended
- 10 Financial KPIs Every Business Owner Should Track | John Galt
- Essential financial metrics to track for SMB growth: 2026
- SaaS Financial Metrics: 12 KPIs Every Founder Must Track | John Galt
- Unlock business growth with a custom financial modeling process
- Planificación financiera paso a paso: mejora tus finanzas
FAQ
How many KPIs should I track?
7-12 on the executive dashboard, 20-30 in detailed operating reports. More than 12 on the dashboard creates noise and decision paralysis. Pick KPIs that pass the “so what?” test: if it moves 20%, your action changes.
What KPIs matter most for an early-stage SMB?
Five essentials: revenue growth rate, gross margin, cash runway, customer count, and customer concentration (top customer %). Add CAC payback and gross retention as soon as you have repeat customers. See our dashboard guide for build templates.
How often should I review KPIs?
Weekly for operational KPIs (pipeline, cash, AR), monthly for financial KPIs (margin, EBITDA, runway), quarterly for strategic KPIs (LTV, NRR, market share). Daily KPI checking usually creates panic without insight.
What’s the difference between leading and lagging KPIs?
Leading KPIs predict the future (pipeline, demo bookings, trial conversions). Lagging KPIs report the past (revenue, EBITDA, retention). Best dashboards have 60% leading, 40% lagging. Lagging-only dashboards are obituaries.
How do I know if my KPIs are actually useful?
Apply three tests: (1) can you influence it (actionable), (2) does it tie to strategy (relevant), (3) is it measured the same way every time (reliable). KPIs that fail any test get dropped. Vanity metrics (total downloads, page views) usually fail all three.