
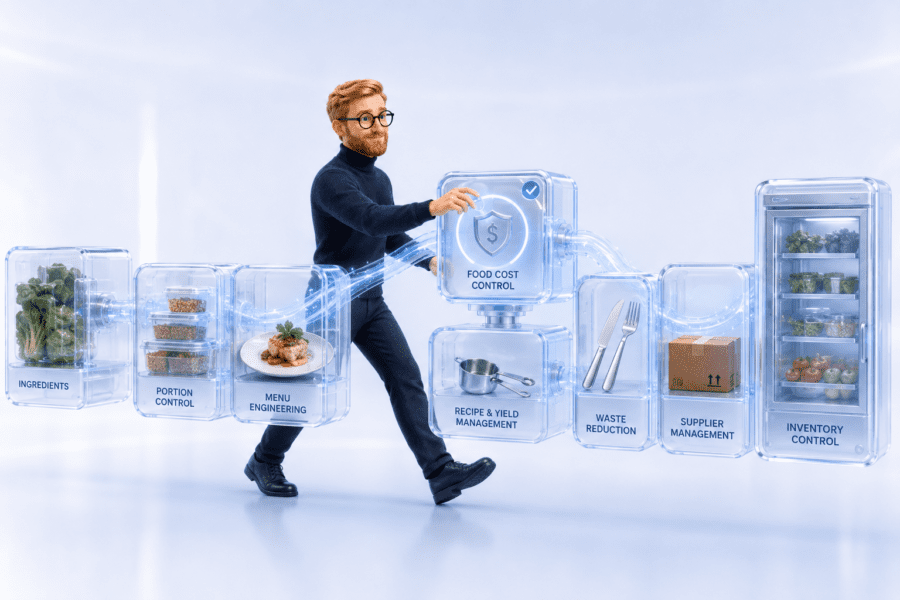
Running a restaurant is one of the toughest businesses in the world. Margins are thin, costs move daily, and a single bad month can wipe out a quarter of profit. Effective restaurant financial management is what separates operators who survive from those who scale. In this guide, we break down food cost, labor cost, and profit margin benchmarks that successful restaurants use to stay healthy — plus the dashboards, formulas, and habits that keep owners in control.
Table of Contents
- Why Most Restaurants Fail (And It’s Not the Food)
- The 7 Core Metrics in Restaurant Financial Management
- Food Cost: The 28-32% Rule and How to Hit It
- Labor Cost: Scheduling, Productivity, and the 30% Ceiling
- Prime Cost: The #1 KPI Restaurant Owners Ignore
- Profit Margins: What Healthy Looks Like by Concept
- Cash Flow and Weekly P&L Discipline
- Building a Restaurant Financial Dashboard
- Monthly Financial Health Checklist
- FAQ
Key Takeaways
| Insight | What It Means for Your Restaurant |
|---|---|
| Prime cost should stay under 60-65% of sales | Above 65% and profitability collapses fast |
| Food cost target: 28-32% | Track weekly, not monthly — recipes drift |
| Labor cost target: 25-30% | Use sales-per-labor-hour, not just dollars |
| Healthy net profit: 5-15% | Quick-service averages 6-9%, fine dining 10-15% |
| Weekly P&Ls beat monthly closes | You catch margin leaks in 7 days, not 30 |
| Inventory variance over 1% = red flag | Indicates theft, waste, or portion drift |
Why Most Restaurants Fail (And It’s Not the Food)
Industry data consistently shows that roughly 60% of independent restaurants close within their first year, and 80% within five. The popular narrative blames bad food or bad location, but operators who have closed multiple concepts will tell you the truth: most restaurants fail because of poor restaurant financial management. The kitchen can be brilliant and the dining room packed, yet the business still bleeds cash because nobody is tracking the right numbers at the right frequency.
Three patterns explain the majority of restaurant failures:
1. Monthly accounting in a daily-cost industry
Restaurants run on perishable inventory, shift-based labor, and same-day pricing pressure. Closing the books once a month is far too slow. By the time you spot a 3-point margin drop in your March P&L, you have already lost 30 days of profit you cannot recover.
2. Confusing cash in the bank with profit
A busy Friday deposit feels like winning. But that cash includes tomorrow’s payroll, next week’s food order, and the sales tax you owe the state. Profitable-looking restaurants regularly go bankrupt because their owners spent operating cash that was never theirs to keep.
3. No prime cost discipline
Owners obsess over occupancy, marketing, and decor, while their two biggest expenses — food and labor — drift up 2-3 points per quarter unnoticed. On a $1.2M restaurant, every single point of prime cost is $12,000 of pre-tax profit walking out the back door.
The 7 Core Metrics in Restaurant Financial Management
If you only track seven numbers in your restaurant, make them these. Every successful operator we work with reviews this scorecard weekly.
| Metric | Formula | Healthy Range |
|---|---|---|
| Food Cost % | COGS ÷ Food Sales | 28-32% |
| Beverage Cost % | Beverage COGS ÷ Beverage Sales | 18-24% |
| Labor Cost % | Total Labor ÷ Total Sales | 25-30% |
| Prime Cost % | (COGS + Labor) ÷ Sales | 55-65% |
| Sales per Labor Hour | Sales ÷ Labor Hours | $60-$90 |
| Average Check | Sales ÷ Covers | Trend up YoY |
| Net Profit Margin | Net Income ÷ Sales | 5-15% |
These are not academic. They are the same numbers a competent CFO would build into your weekly flash report. If you want a deeper view of how dashboards bring this together, our guide to a financial dashboard for business owners shows the structure operators rely on.
Food Cost: The 28-32% Rule and How to Hit It
Food cost percentage is the foundation of restaurant financial management. The standard formula is simple:
Food Cost % = (Beginning Inventory + Purchases − Ending Inventory) ÷ Food Sales
Most concepts target 28-32%. Pizza and high-volume QSR can run 25-28%. Steakhouses and premium seafood often sit at 34-38% because their menu mix demands expensive proteins. The number itself matters less than your consistency against your own benchmark.
Why food cost drifts (and how to stop it)
Food cost rarely jumps in one move. It creeps up half a point at a time until a quarter goes by and you are suddenly at 36%. The usual culprits:
- Recipe drift — line cooks over-portion proteins, dressings, and cheese during rushes
- Spec changes from suppliers — your distributor swaps in a higher-priced chicken and never says a word
- Waste — improperly stored produce, over-prep, and trim that should be reused
- Theft — voids, comps, and back-door losses
- Menu mix shifts — guests order more of your high-cost items than you forecasted
The weekly inventory habit
Monthly inventory hides problems. Weekly inventory exposes them while you can still fix them. A 30-minute Sunday-night count, plugged into a simple spreadsheet or POS module, gives you a real-time food cost trendline. When you see beef rise from 32% to 34% in week two, you can investigate before week four turns it into a $7,000 hole.
Labor Cost: Scheduling, Productivity, and the 30% Ceiling
Labor is the second leg of prime cost and the metric most owners feel guilty optimizing. The honest truth is that labor cost above 30% of sales is almost always a scheduling problem, not a wage problem. Operators who staff to forecasted sales — not to “what we always do on Saturdays” — protect their margins without underpaying their team.
From dollars to sales-per-labor-hour
Tracking labor in dollars alone is misleading because a wage increase will mathematically inflate your labor cost percentage even if productivity holds steady. The better metric is Sales per Labor Hour (SPLH):
SPLH = Total Sales ÷ Total Labor Hours
A casual dining concept doing $65/hour SPLH is healthy. Below $50, you are overstaffed or under-selling. Above $90, you are at risk of service breakdowns and turnover. Build a weekly SPLH report by daypart — Monday lunch and Saturday dinner are completely different businesses.
The schedule-to-forecast loop
The discipline that separates healthy restaurants:
- Forecast daily sales for the upcoming week based on last 4-week and prior-year trends
- Build labor schedules to a target SPLH for each daypart
- Compare actual vs. forecast every morning — adjust same-day if a shift is off pace
- Review week-end actual hours vs. scheduled hours by manager
If you are operating multiple locations, this is exactly the kind of weekly cadence a fractional CFO installs. Our payroll cost management guide covers the broader picture beyond hourly scheduling.
Prime Cost: The #1 KPI Restaurant Owners Ignore
If you only track one number in your restaurant, make it prime cost.
Prime Cost = COGS + Total Labor (including taxes and benefits)
Prime Cost % = Prime Cost ÷ Total Sales
Prime cost captures the two expense categories the operator actually controls. Rent, utilities, and insurance are largely fixed in the short term — you cannot cut your way out of them this week. But food and labor combined are typically 55-65% of sales and move every single day.
The 60-65% rule
| Prime Cost % | What It Means |
|---|---|
| Under 60% | Excellent — strong profit and pricing power |
| 60-65% | Healthy — most successful full-service restaurants |
| 65-70% | Warning zone — net profit likely under 5% |
| Over 70% | Crisis — operator likely losing money every week |
The 1% rule for action
If prime cost moves more than 1 point against you week-over-week, treat it as an event. Pull invoices, review the schedule, count inventory again. Restaurants that consistently outperform are not the ones with no problems — they are the ones who catch problems in seven days instead of thirty.
Profit Margins: What Healthy Looks Like by Concept
“What net margin should I be hitting?” is one of the most common questions we get from restaurant owners. The honest answer depends entirely on your concept, location, and ownership structure.
| Concept Type | Typical Food Cost | Typical Labor Cost | Healthy Net Margin |
|---|---|---|---|
| Quick-Service / Fast Casual | 28-32% | 25-28% | 6-9% |
| Casual Dining | 30-34% | 28-32% | 5-8% |
| Pizza | 20-28% | 22-28% | 8-12% |
| Bar / Pub | 30-35% food, 20-24% beverage | 22-28% | 10-15% |
| Fine Dining | 32-38% | 30-35% | 10-15% |
| Coffee Shop / Cafe | 25-32% | 28-32% | 8-12% |
Notice that fine dining has higher food and labor costs, yet still earns a healthier margin. Why? Higher check averages, premium positioning, and lower rent-per-cover. Margin is a function of your entire P&L, not just prime cost.
Cash Flow and Weekly P&L Discipline
Profitable restaurants close every week, not every month. The discipline is simple but rare:
- Friday cash count — reconcile every drawer, deposit, and tip pool
- Saturday inventory snapshot — by category at minimum, ideally key items
- Sunday P&L — sales, food cost, labor cost, prime cost, vs. budget and prior week
- Monday review — manager meeting, action items, schedule tweaks
This weekly rhythm catches problems while they are still cheap to fix. Owners who insist they “don’t have time” usually find they have plenty of time for the crisis that arrives three months later. For a deeper look at this discipline, see our piece on 13-week cash flow forecasting, which is the model most restaurant CFOs run alongside the weekly P&L.
Watch your sales tax and tip liability
One brutal cash trap: sales tax collected from guests is not your money. Tip pools and credit card tip distributions belong to staff. Restaurants regularly fail because operators treated these balances as available working capital. Sweep them into a separate account every Monday and pay them on schedule.
Building a Restaurant Financial Dashboard
An effective restaurant dashboard fits on one screen. It should answer five questions in under 30 seconds:
- How did sales compare to forecast this week?
- Where is food cost trending vs. target?
- Where is labor trending vs. target?
- What is prime cost vs. last 4 weeks?
- What is my cash position and 4-week forecast?
You do not need expensive software to start. A weekly spreadsheet pulling POS sales, payroll hours, and invoice totals is enough for a single location. Once you scale past two locations, a proper restaurant analytics platform like R365, MarginEdge, or Restaurant365 starts to pay for itself.
Monthly Financial Health Checklist
Run this checklist on the first Monday of every month:
- ✅ Weekly P&Ls reconciled and reviewed
- ✅ Inventory variance under 1% of food cost
- ✅ Prime cost within 1 point of target
- ✅ Sales-per-labor-hour reviewed by daypart
- ✅ Average check trending up or flat (not down)
- ✅ Sales tax and tips reconciled and paid
- ✅ Supplier invoices matched to purchase orders
- ✅ Comps, voids, and discounts under 3% of sales
- ✅ Cash bank balance covers 6-8 weeks of operating expenses
- ✅ Manager bonus targets tied to prime cost, not just sales
If you cannot tick at least eight of these every month, your restaurant is operating on hope rather than discipline. Book a free consultation if you want help building this rhythm into your operation.
FAQ
What is a good food cost percentage for a restaurant?
For most full-service concepts, 28-32% is healthy. Pizza and high-volume QSR can run 25-28%. Steakhouses and seafood concepts often sit at 34-38%. The key is consistency against your own benchmark, tracked weekly rather than monthly.
What is the most important financial metric for a restaurant?
Prime cost — the sum of cost of goods sold and total labor cost as a percentage of sales. It captures the two largest variable expenses you actually control. Healthy operators keep prime cost between 55% and 65% of sales.
How often should I review my restaurant’s financials?
Sales, labor, and food cost should be reviewed daily and reconciled weekly. A full P&L should be produced weekly, not monthly. Monthly closes are too slow for a business where ingredients spoil and shifts are scheduled in real time.
What’s a healthy profit margin for an independent restaurant?
Net profit margins of 5-10% are typical for casual and quick-service concepts. Fine dining, bars, and well-run pizza concepts can reach 10-15%. Anything consistently under 5% signals a structural problem in prime cost, pricing, or rent.
Do I need a CFO for my restaurant?
Most independent operators do not need a full-time CFO, but they do need CFO-level financial discipline. A fractional CFO can install weekly P&Ls, prime cost tracking, and cash forecasting for a fraction of the cost of a senior hire — typically with a 3-6 month payback from margin improvement alone.