Uncategorized | John Galt

Why SMEs Need CFO Services: Unlock Growth and Clarity

Key Facts & Benchmarks

MetricBenchmark
SMBs that fail due to cash flow problems82% (U.S. Bank study)
Fractional CFO monthly retainer range$2,000 – $10,000
Full-time CFO total comp (US)$200,000 – $450,000/year + equity
Typical fractional CFO commitment10 – 40 hours/month
Time to first ROI (margin/cash improvement)60 – 90 days
Revenue band where fractional CFO is optimal$500K – $20M ARR
SMBs that say lack of financial clarity hurts decisions61% (QuickBooks survey)

Most business owners assume CFO services are reserved for corporations with hundreds of employees and sprawling finance departments. That assumption is costing smaller businesses real money. The truth is, SMEs (small and medium-sized enterprises) are often the ones who benefit most from strategic financial leadership, precisely because the margin for error is so much smaller. Without someone steering the financial ship with clarity and foresight, growth stalls, cash flow tightens, and decisions get made on gut instinct instead of data. This article breaks down why CFO-level guidance isn’t a luxury for SMEs. It’s often the missing piece between where you are and where you want to be.

Table of Contents

Key Takeaways

PointDetails
CFOs drive SME growthStrategic financial leadership helps small businesses overcome barriers and seize opportunities.
Outsourced options save costsFractional CFO services provide high-level expertise without the full-time commitment.
Data powers smart decisionsWith CFO input, SMEs switch from gut feelings to robust, evidence-backed strategies.
Timing mattersEarly adoption of CFO services maximizes growth and prevents costly missteps.

Understanding the financial challenges SMEs face

Most SMEs don’t fail because of a bad product or a weak team. They fail because the financial infrastructure never caught up with the ambition. The gap between running a business and running it profitably is almost always a financial visibility problem.

Here’s what that looks like in practice. You’re generating revenue, but you’re not sure why profit margins keep shrinking. Your bank account looks fine one month and terrifying the next. You’re making hiring and expansion decisions based on what feels right rather than what the numbers actually support. Sound familiar?

The core financial challenges SMEs face tend to cluster around a few persistent pain points:

  • Limited access to real-time financial data, making it nearly impossible to spot trends before they become problems
  • Inconsistent cash flows that create working capital pressure and force reactive decision-making
  • No formal scenario planning, leaving businesses exposed when market conditions shift unexpectedly
  • Absence of structured KPIs (key performance indicators), so there’s no reliable way to measure whether the business is actually improving

These aren’t small inconveniences. They compound. A cash flow gap in Q1 becomes a missed hiring opportunity in Q2, which becomes a growth plateau by year-end. As noted in SME financial management research, SMEs lack advanced financial insights and planning tools, which constrains sustainable growth.

Financial ChallengeImpact on SMEWithout CFO Guidance
Cash flow gapsMissed payroll, delayed growthReactive borrowing
No forecastingSurprise shortfallsCrisis management
Weak KPI trackingNo performance benchmarksGut-based decisions
No scenario planningVulnerability to market shiftsUnprepared pivots

Tracking the right essential growth metrics is the first step toward financial clarity. And building a solid foundation often starts with custom financial modeling that reflects your actual business, not a generic template.

“The biggest financial risk for an SME isn’t a bad quarter. It’s not knowing a bad quarter is coming until it’s already arrived.”

Pro Tip: Financial blind spots rarely announce themselves. Build a monthly review cadence into your operations now, before complexity forces you to.

How CFO services solve SME financial roadblocks

Understanding the challenges naturally raises the question: what can a CFO actually do to change outcomes for SMEs? Quite a lot, it turns out, and the impact shows up faster than most owners expect.

A CFO doesn’t just look at your books. They build the systems, forecasts, and reporting structures that let you run your business with confidence instead of anxiety. Here’s how that plays out across the four biggest problem areas:

  1. Cash flow management and forecasting. A CFO maps your inflows and outflows across rolling 13-week windows, identifying gaps before they hit. CFOs provide advanced forecasting that helps SMEs anticipate cash shortfalls instead of reacting to them.
  2. KPI development and monitoring. Without the right metrics, you’re flying blind. A CFO defines which numbers actually matter for your business model and builds dashboards that surface them weekly.
  3. Financial modeling for decision support. Thinking about a new product line or a second location? A CFO builds models that stress-test those decisions against multiple scenarios before you commit capital.
  4. Operational process optimization. CFOs often find margin improvements hiding in plain sight: vendor contracts, billing cycles, inventory turnover, and pricing structures that quietly erode profitability.
ApproachWithout CFOWith CFO
Cash flow visibilityMonthly snapshotsRolling 13-week forecast
Decision-makingInstinct-basedModel-supported
KPI trackingAd hoc or noneStructured dashboards
Financial reportingReactiveProactive and forward-looking

Pro Tip: A good CFO doesn’t just prevent financial fire drills. They eliminate the conditions that cause them in the first place.

For SMEs serious about financial management for growth, the CFO function is what converts raw revenue into sustainable profit. Pairing strong SME cash flow forecasting with disciplined key financial metrics tracking creates a feedback loop that keeps the business on course.

SME owner reviewing financial reports workspace

Data-driven decisions: The CFO advantage

Now that you see how CFOs address barriers, let’s explore the competitive difference their input makes in real decisions. This is where the CFO function goes from useful to transformative.

Most SME owners are smart, experienced operators. But even the best operators make suboptimal decisions when they’re working from incomplete or delayed financial information. A CFO changes the information environment entirely.

Here’s what data-driven financial leadership actually looks like in practice:

  • Real-time dashboards that surface gross margin, burn rate, and revenue concentration at a glance
  • Scenario analysis that models the financial impact of major decisions before you make them
  • Variance reporting that flags when actuals deviate from plan and explains why
  • Rolling forecasts that update as conditions change, not just once a year during budget season

Consider a concrete example. An SME owner is weighing whether to open a second location. Without CFO support, that decision relies on optimism and rough math. With a CFO, it relies on a detailed model showing break-even timelines, working capital requirements, and the cash flow impact across three different revenue scenarios. The decision doesn’t just feel better. It is better.

Businesses with strong financial leadership are significantly more likely to achieve sustained profitability and growth. That’s not a coincidence. It’s the direct result of replacing guesswork with structure.

Statistic: Companies that implement CFO-level financial oversight report up to 2x faster revenue growth compared to peers operating without structured financial leadership.

Understanding the Bookkeeper vs CFO distinction is critical here. A bookkeeper records what happened. A CFO shapes what happens next. And if you’re unsure whether your business is ready, reviewing fractional CFO responsibilities can clarify exactly what that role delivers. A solid financial control process is what separates businesses that scale from businesses that stall. The fractional CFO guide at John Galt Finance walks through how this works for businesses at different growth stages.

Choosing and leveraging outsourced CFO services

If you’re ready to reap these benefits, here’s how to approach choosing and integrating CFO services efficiently. The good news is that you don’t need to hire a full-time executive to access this level of financial leadership.

Outsourced CFO services give SMEs affordable access to high-level finance talent, structured around your actual needs rather than a fixed salary commitment. Here’s a practical framework for making it work:

  1. Identify your trigger. The right time to bring in an outsourced CFO is typically when you’re experiencing rapid growth, increasing financial complexity, recurring cash flow stress, or preparing for fundraising.
  2. Evaluate provider fit. Look for a CFO partner with direct experience in your industry, a track record with businesses at your revenue stage, and flexibility in engagement structure.
  3. Define clear goals upfront. The relationship works best when you enter it with specific outcomes in mind: improve cash flow visibility, build a 12-month forecast, prepare investor-ready financials.
  4. Establish a reporting rhythm. Monthly financial reviews, weekly cash flow updates, and quarterly strategy sessions create the accountability structure that makes CFO guidance actionable.
  5. Communicate openly. A CFO can only work with the information you share. Transparency about challenges, goals, and constraints is what separates a productive engagement from a surface-level one.

A step-by-step financial planning approach helps frame what you want from the engagement before the first conversation. Pairing that with a clear understanding of financial planning for business at your stage ensures you’re asking the right questions from day one.

Pro Tip: Outsourced CFO services let you access senior financial expertise without the overhead of a full-time executive. For most SMEs, that flexibility is exactly what makes the model so powerful.

A CFO isn’t a luxury for SMEs—it’s a strategic multiplier

Here’s the conventional view: CFOs are for companies that have already made it. You build the business first, then you bring in the financial leadership to manage what you’ve built. It sounds logical. It’s also backwards.

The SMEs that grow fastest and most profitably are almost never the ones that waited until they were “big enough” for a CFO. They’re the ones that used financial leadership as the lever that got them to scale. Waiting until complexity forces your hand means you’ve already absorbed the costs of operating without strategic oversight, missed opportunities, inefficient capital allocation, and decisions made without the right data.

We’ve seen this pattern repeatedly. The businesses that engage signs you really need a CFO early don’t just avoid problems. They move faster, raise capital more successfully, and make fewer costly reversals. Strategic long-term planning isn’t something you add after growth. It’s what enables growth in the first place. The most expensive CFO is the one you didn’t hire when you needed one.

Connect with world-class CFO expertise for your SME

If this article has clarified one thing, it’s that strategic financial leadership isn’t something to defer until your business is larger. The businesses growing fastest right now are the ones that made financial clarity a priority early.
https://johngalt-finance.com

John Galt Finance specializes in outsourced and fractional CFO services built specifically for SMEs ready to grow with intention. Whether you’re navigating cash flow pressure, preparing for investment, or simply want to make better decisions with better data, we can help. Start by exploring does your SME need a CFO, then understand fractional CFO services to see how flexible, high-impact financial leadership fits your business. Ready to take the next step? Connect with John Galt Finance today.

Frequently asked questions

When should an SME consider hiring a CFO?

An SME should consider a CFO when experiencing rapid growth, increased financial complexity, or recurring cash flow issues. Growth transitions and complex reporting are clear signals that you need more financial expertise on your side.

What’s the difference between a CFO and a bookkeeper for SMEs?

A bookkeeper manages daily transactions, while a CFO offers strategic planning, forecasting, and high-level financial oversight. Bookkeepers and CFOs serve fundamentally different roles, and most growing SMEs eventually need both.

How can outsourced CFO services be affordable for small businesses?

Outsourced or fractional CFOs provide top-tier expertise on a project or part-time basis, lowering the cost compared to full-time hires. Fractional CFOs offer flexible solutions suited to SME budgets without sacrificing strategic depth.

Which financial metrics should SMEs track for better business decisions?

Key metrics include gross profit margin, cash flow, accounts receivable, and customer acquisition costs for informed decisions. Cash flow and profitability metrics are essential for business stability and long-term planning.

Can a CFO help with securing financing or investment?

Yes, CFOs prepare proper financial documentation and forecasts to support loan or investor applications. CFOs manage strategic planning and ensure your financials are investor-ready when the opportunity arises.

FAQ

At what revenue should an SMB hire a fractional CFO?

The sweet spot is $500K – $20M in annual revenue. Below $500K, a strong bookkeeper plus monthly advisory calls is usually enough. Above $20M, full-time CFO economics start to work. Most companies hire their first fractional CFO around $1.5-3M in revenue, when complexity outpaces what the owner can mentally hold.

Fractional CFO vs. full-time CFO — which is better?

A full-time CFO costs $200K-$450K/year fully loaded. A fractional CFO costs $24K-$120K/year for 10-40 hours/month. Until you have $15M+ in revenue or imminent fundraising/M&A, fractional CFOs deliver 80% of the strategic value at 15-30% of the cost. The transition to full-time usually happens when CFO bandwidth (not skill) becomes the bottleneck.

What does a fractional CFO actually do day-to-day?

Typical month: monthly close review, 13-week cash flow forecast update, KPI dashboard refresh, board/investor reporting, pricing or unit economics analysis, fundraising or banking conversations, and one to two strategic deep-dives (margin diagnosis, headcount planning, vendor negotiation). About 40% of time is recurring, 60% project-driven.

How fast does a fractional CFO pay for themselves?

Most engagements show ROI in 60-90 days. Typical first-quarter wins: 5-15% margin lift from pricing or cost analysis, 10-30 days of working capital freed via AR/AP discipline, or a refinanced credit facility worth tens of thousands annually. A $5K/month CFO usually delivers $30K-$100K in measurable improvement within the first year.

What’s the difference between a bookkeeper, controller, and CFO?

Bookkeeper records transactions (looking backward, days). Controller closes the books and ensures accuracy (looking backward, weeks). CFO turns financial data into forward-looking decisions about pricing, capital, growth, and exit (looking forward, quarters and years). You need all three functions; in an SMB the fractional CFO often supervises the bookkeeper and partial controller work.


Share this:

Unlock business growth by mastering financial KPIs

Financial KPI Benchmarks for SMBs

KPIBenchmark
Gross margin (B2B services)40-60%
EBITDA margin (mature SMB)10-20%
Revenue growth rate (top quartile SMB)20%+ annually
Customer acquisition cost (CAC) payback<12 months
LTV:CAC ratio>3:1
Net revenue retention (SaaS)>100% (best-in-class >120%)
Cash conversion cycle (manufacturer)<60 days
Revenue per FTE (services)$150,000-$300,000

Most business owners are either drowning in spreadsheets or flying blind with gut instinct alone. Neither works. The real problem is not a lack of data but tracking the wrong numbers or misreading what they mean. Financial KPIs (Key Performance Indicators) are not a corporate luxury reserved for Fortune 500 companies. They are the clearest signal system available to any SMB owner who wants to make faster, more confident decisions. This guide breaks down the KPIs that actually move the needle, translates the jargon into plain language, and shows you exactly how to apply them to your business today.

Table of Contents

Key Takeaways

PointDetails
Core KPI categoriesSMBs should focus on profitability, liquidity, efficiency, and growth when choosing KPIs.
Not all KPIs fitSelect and customize KPIs to suit your business stage and industry rather than copying generic lists.
Monitor regularlyReview your chosen KPIs consistently to spot trends quickly and course-correct before issues grow.
Understand the storyThe right KPIs answer very specific questions about your business health and momentum.
Expert help adds valueA fractional CFO or finance specialist can help you create and interpret powerful KPI dashboards.

What are financial KPIs and why do they matter?

A Key Performance Indicator is a measurable value that tells you how effectively your business is achieving its goals. In a financial context, KPIs are the numbers that reveal whether your business is healthy, stressed, growing, or quietly bleeding cash. They are not vanity metrics. They are diagnostic tools.

For small and medium-sized businesses, financial KPIs for SMBs are categorized into four core groups: profitability, liquidity, efficiency, and growth. Each category answers a distinct question about your business.

  • Profitability: Are you actually making money after all costs?
  • Liquidity: Can you cover your bills and survive a slow month?
  • Efficiency: Are your operations lean, or are you leaving cash on the table?
  • Growth: Is your business expanding, stalling, or contracting?

Think of these four categories as the dashboard of a car. You would not drive without checking your speed, fuel, and engine temperature. Running a business without these KPIs is exactly that.

“Owners who consistently track the right financial KPIs report making faster, more confident decisions, especially when facing growth inflection points or cash pressure.”

The power of KPIs is not just in measurement. It is in prioritization. When you know your numbers, you stop guessing and start steering. You can spot a problem three months before it becomes a crisis. You can identify which product line is quietly dragging down your margins. You can tell investors, lenders, or partners a clear financial story backed by data.

If you are not sure where to start, exploring essential financial metrics for SMB growth gives you a strong foundation. And if you are wondering whether your business has outgrown your current financial setup, reviewing when you need a CFO can help you recognize the signs early. The goal is not to track everything. It is to track what matters most for your specific business right now.

A well-chosen set of financial KPIs every owner should track becomes a repeatable system, not a one-time exercise.

Profitability KPIs: Measuring the bottom line

Profitability KPIs tell you whether your business model actually works. Revenue is not profit. Many SMBs with strong top-line numbers are quietly losing money once all costs are factored in. These three KPIs cut through the noise.

Manager analyzing profitability reports in conference room

Gross Profit Margin (GPM) measures how efficiently you produce your product or deliver your service. The formula: (Revenue minus Cost of Goods Sold) divided by Revenue. A healthy SMB target is 30 to 50 percent or higher, depending on your industry. A SaaS business might sit at 75 percent. A retail store might run at 35 percent. Neither is wrong. Context is everything.

Net Profit Margin goes deeper. It accounts for every expense: rent, salaries, taxes, interest, and overhead. This is your true bottom line. A business can have a 50 percent gross margin and a 3 percent net margin, which means operational costs are consuming most of the value created.

EBITDA (Earnings Before Interest, Taxes, Depreciation, and Amortization) strips out financing and accounting decisions to show raw operational profitability. It is especially useful when comparing your business to industry peers or preparing for a funding conversation.

MetricRetail benchmarkSaaS benchmarkProfessional services
Gross Profit Margin30 to 40%70 to 90%50 to 70%
Net Profit Margin2 to 6%10 to 20%15 to 25%
EBITDA Margin4 to 8%15 to 30%20 to 35%

Here is what each profitability KPI helps you answer:

  • GPM: Is my pricing and production model sustainable?
  • Net Profit Margin: Are my operating costs under control?
  • EBITDA: How does my operational performance compare to competitors?

Pro Tip: Watch the gap between your gross margin and net margin closely. A widening gap means costs are growing faster than revenue. That gap is where profit leaks hide, often in underpriced services, bloated overhead, or untracked expenses.

Your small business pricing strategy directly impacts GPM, so revisiting your pricing model is one of the fastest ways to improve profitability without cutting staff or reducing quality. Tracking these key financial KPIs consistently turns profitability from a quarterly surprise into a predictable outcome.

Liquidity KPIs: Can your business meet its financial obligations?

A profitable business can still fail. That sounds counterintuitive, but it happens regularly when a company cannot convert its assets into cash fast enough to pay its bills. Liquidity KPIs measure your ability to meet short-term obligations, and they are often the difference between surviving a slow quarter and closing your doors.

Current Ratio is the most widely used liquidity measure. The formula: Current Assets divided by Current Liabilities. A Current Ratio of 1.5 to 2 is considered healthy for most SMBs. Below 1 means you owe more in the short term than you have available, which is a serious warning sign.

Quick Ratio is a stricter version. It removes inventory from current assets before dividing by current liabilities. This matters because inventory is not always easy to convert to cash quickly, especially in manufacturing or retail.

RatioFormulaHealthy rangeWhat it signals
Current RatioCurrent Assets / Current Liabilities1.5 to 2.0Overall short-term health
Quick Ratio(Current Assets minus Inventory) / Current Liabilities1.0 to 1.5Stress-tested liquidity

Here is how to calculate and interpret your ratios:

  1. Pull your most recent balance sheet.
  2. Identify total current assets (cash, receivables, inventory).
  3. Identify total current liabilities (accounts payable, short-term debt).
  4. Divide assets by liabilities for Current Ratio.
  5. Subtract inventory from assets, then divide again for Quick Ratio.
  6. Compare your results to the benchmarks above and track changes monthly.

Pro Tip: If your business holds significant inventory, the Quick Ratio is your real stress test. A strong Current Ratio can mask a liquidity problem if most of your assets are tied up in slow-moving stock.

“For inventory-heavy businesses, a Current Ratio above 2 can still signal risk if inventory turnover is slow. Always read liquidity ratios alongside efficiency data for a complete picture.”

A regular financial health check helps you catch liquidity issues before they become emergencies. Monitoring liquidity metrics for SMBs alongside profitability gives you the full picture of your financial position.

Efficiency and growth KPIs: How well are you operating and scaling?

Profitability and liquidity tell you where you stand. Efficiency and growth KPIs tell you how fast you are moving and whether your operations support that speed. These metrics expose bottlenecks, slow payers, and hidden cash traps that net profit alone will never reveal.

Key efficiency and growth KPIs for SMBs include:

  • Inventory Turnover: How many times you sell and replace inventory in a period. Higher turnover means less cash tied up in stock. Low turnover signals overbuying or weak demand.
  • Accounts Receivable Turnover: How quickly customers pay you. A low ratio means cash is sitting in unpaid invoices instead of your bank account.
  • Cash Conversion Cycle (CCC): The number of days it takes to convert investments in inventory and receivables into actual cash. Shorter is better. Manufacturing firms often see a CCC of 60 to 90 days, while service businesses can achieve 15 to 30 days.
  • Revenue Growth Rate: The percentage increase in revenue over a set period. It signals business momentum, market fit, and scalability potential.

Stat callout: Manufacturing businesses average a Cash Conversion Cycle of 60 to 90 days, while service-based firms often achieve 15 to 30 days, reflecting how capital-intensive operations slow cash flow.

Efficiency KPIs are especially powerful because they reveal problems that profitability metrics hide. You might show a healthy net margin while carrying 90 days of unpaid invoices. That is a cash flow crisis waiting to happen. Improving managing receivables efficiency directly shortens your CCC and frees up working capital without any new revenue.

For businesses with complex inventory or payment cycles, working capital insights provide a deeper framework for optimization. If you run a software or subscription business, a dedicated SaaS KPIs guide will help you prioritize the metrics most relevant to your model.

The right efficiency KPIs depend on your business model. A product company prioritizes inventory turnover. A service firm focuses on receivables and utilization rates. Match the metric to the model.

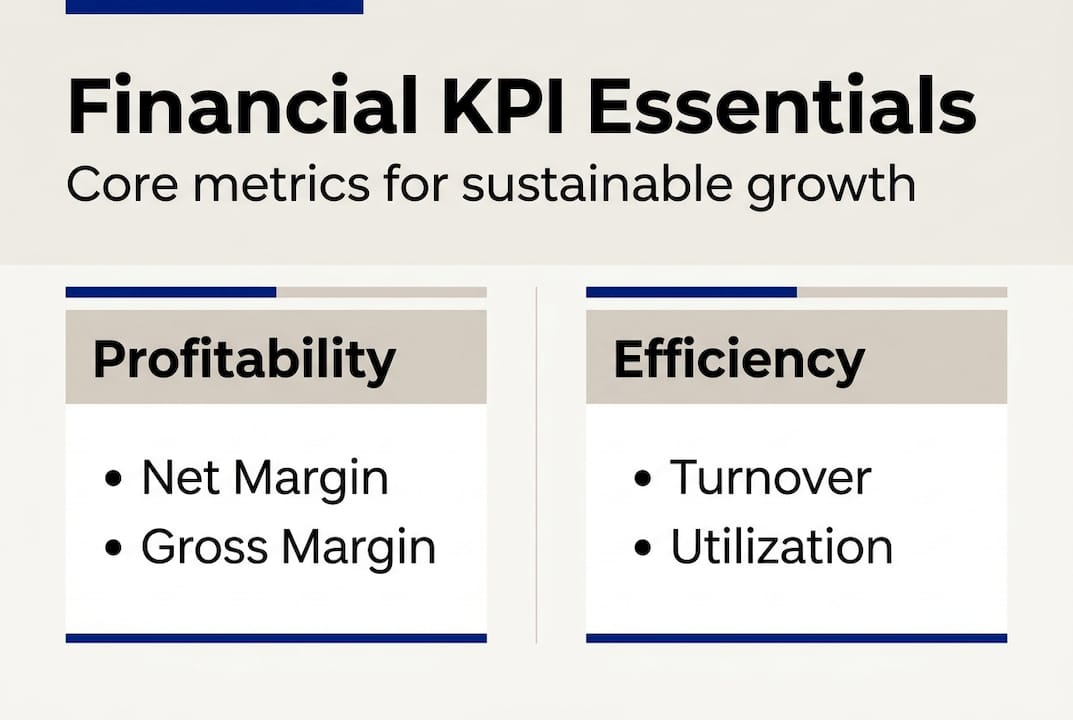
Infographic comparing key financial KPI categories

Why the best KPI playbook is one you customize

Here is the uncomfortable truth most financial guides skip: there is no universal KPI list that works for every business. Generic KPI checklists are a starting point, not a strategy.

A pre-revenue startup should be obsessing over burn rate and runway, not Return on Invested Capital (ROIC). A mature, cash-generating business should be tracking ROIC, customer lifetime value, and margin trends, not burn rate. Applying the wrong KPIs to the wrong stage is like using a marathon training plan to prepare for a sprint. The effort is real but the result is off.

Tailoring KPIs to your stage and goals is what separates businesses that use data to grow from those that collect data and feel busy. We have seen SMBs track 20 KPIs religiously and still make poor decisions because none of those metrics connected to their actual constraints.

The businesses that win are the ones that ask: “What are the two or three numbers that, if they moved, would change everything about how we operate?” That question leads to a focused, actionable KPI dashboard. Building a custom KPI modeling framework around your specific business model, stage, and goals is the most direct path from data collection to real decision-making power.

Take your financial strategy further with expert support

Understanding KPIs is one thing. Building a system that tracks, interprets, and acts on them consistently is another challenge entirely.

https://johngalt-finance.com

At John Galt Finance, we build custom financial modeling frameworks tailored to your business stage, industry, and goals. Whether you need a focused KPI dashboard, a full profitability analysis, or ongoing strategic guidance, our team delivers CFO-level insight without the cost of a full-time hire. You can also explore more on financial KPIs to deepen your understanding before taking the next step. When you are ready for hands-on support, our Fractional CFO services give you the expertise to turn the right numbers into the right decisions, every month.

Frequently asked questions

Which financial KPIs are most important for small businesses?

Profitability margins, current ratio, quick ratio, and revenue growth rate are the most essential for most SMBs, as they cover the four core financial KPI categories: profitability, liquidity, efficiency, and growth.

How often should I update my financial KPIs?

Review your KPIs monthly at minimum, and shift to weekly tracking during periods of rapid growth, cash pressure, or significant operational change.

What’s the difference between Gross Profit Margin and Net Profit Margin?

Gross Profit Margin measures production efficiency by comparing revenue to the cost of goods sold, while Net Profit Margin reflects true profitability after every expense including overhead, taxes, and interest.

Can too many KPIs be a bad thing?

Absolutely. Tracking too many metrics creates noise and dilutes focus. The best approach is to tailor KPIs to stage and goals so every number on your dashboard connects directly to a decision you need to make.

What if my industry’s average KPI numbers are very different?

Industry benchmarks like retail’s 30 to 40% gross margin versus SaaS at 70 to 90% exist as context, not rules. Your internal trend over time is a more reliable signal than any external average.

FAQ

How many KPIs should I track?

7-12 on the executive dashboard, 20-30 in detailed operating reports. More than 12 on the dashboard creates noise and decision paralysis. Pick KPIs that pass the “so what?” test: if it moves 20%, your action changes.

What KPIs matter most for an early-stage SMB?

Five essentials: revenue growth rate, gross margin, cash runway, customer count, and customer concentration (top customer %). Add CAC payback and gross retention as soon as you have repeat customers. See our dashboard guide for build templates.

How often should I review KPIs?

Weekly for operational KPIs (pipeline, cash, AR), monthly for financial KPIs (margin, EBITDA, runway), quarterly for strategic KPIs (LTV, NRR, market share). Daily KPI checking usually creates panic without insight.

What’s the difference between leading and lagging KPIs?

Leading KPIs predict the future (pipeline, demo bookings, trial conversions). Lagging KPIs report the past (revenue, EBITDA, retention). Best dashboards have 60% leading, 40% lagging. Lagging-only dashboards are obituaries.

How do I know if my KPIs are actually useful?

Apply three tests: (1) can you influence it (actionable), (2) does it tie to strategy (relevant), (3) is it measured the same way every time (reliable). KPIs that fail any test get dropped. Vanity metrics (total downloads, page views) usually fail all three.

Share this:

Strategic finance best practices: SME owner’s guide to growth

Strategic Finance Benchmarks for SMBs

PracticeSMB BenchmarkImpact
Monthly close completed byBusiness day 10 or earlierDecisions made on fresh data
Cash runway tracked13 weeks forward, weeklyNo surprise insolvency
Budget vs. actual variance threshold+/- 5% on revenue, 3% on marginEarly warning system
KPI dashboard refresh cadenceWeekly minimumOperating discipline
Pricing review frequencyEvery 6-12 months2-7% margin lift per cycle
Working capital cycle targetBelow 60 days CCCSelf-funding growth
Forecast accuracy target (90-day)+/- 10% on revenueCredible to banks/investors
Operating cash buffer3-6 months OpExSurvive shock without dilution

Most small and medium-sized business owners know they need a financial strategy, but far fewer understand what separates a strategy that actually works from one that just looks good on paper. The gap between thriving and struggling often comes down to a handful of CFO-level practices that most SMBs never implement. 60-70% of SMBs can avoid bankruptcy with early turnaround financing and planning. This guide delivers the proven financial best practices that outsourced CFOs use every day to protect and grow businesses like yours.

Table of Contents

Key Takeaways

PointDetails
Separate profit from cashUnderstanding the difference is fundamental to avoiding hidden cash flow crises.
Monitor every costRigorous tracking of all input costs prevents margin erosion and financial surprises.
Be proactive with creditSet up and review credit options in advance to stay agile and resilient.
Use rolling forecastsA 13-week forward view lets you spot and solve challenges before they become threats.

Understand the real difference between revenue and cash flow

While many SMBs focus on boosting sales, the actual flow of cash often determines survival. Revenue is the income your business earns from selling products or services. Cash flow is the real movement of money into and out of your bank account. These two numbers rarely match, and that gap can quietly sink a business that looks profitable on paper.

Manager comparing revenue and cash flow charts

Here is a simple example. You close a $50,000 contract in January. You record that as revenue. But your client pays on 60-day terms, so the cash does not arrive until March. Meanwhile, you still have payroll, rent, and supplier invoices due in February. That is the cash flow vs profit trap that catches so many growing businesses off guard.

Confusing revenue with cash is a leading cause of SMB financial distress. The fix starts with tracking both numbers separately and understanding the timing difference between them.

Projected revenue vs. actual cash position (sample month)

MonthProjected RevenueInvoices CollectedOperating OutflowsNet Cash Position
January$80,000$55,000$62,000-$7,000
February$90,000$70,000$65,000+$5,000
March$85,000$88,000$60,000+$28,000

This table shows how a business can book strong revenue while still running a negative cash position. The warning signs of cash flow mismanagement include:

  • Consistently paying vendors late even when sales are strong
  • Drawing on a line of credit to cover regular operating expenses
  • Inability to predict your cash balance more than two weeks out
  • Surprise shortfalls right before payroll or tax deadlines
  • Revenue growing but bank balances staying flat or shrinking

“Cash flow problems do not announce themselves. They build quietly until a single missed payment triggers a chain reaction.”

A solid cash flow forecasting guide gives you the framework to see these problems before they hit. Pair that with a step-by-step financial planning approach to connect your cash forecast to your broader business goals.

Pro Tip: CFOs rely on the 13-week rolling cash flow forecast because it covers exactly one business quarter. It is short enough to be accurate and long enough to give you real decision-making time. Build one, update it weekly, and you will almost never be surprised by a cash crunch.

Track and control all input costs rigorously

Effective cash flow is only as sound as your cost controls. Input costs are every expense that goes into delivering your product or service: raw materials, labor, software subscriptions, shipping, packaging, and any vendor fees tied to production or delivery. These costs are often overlooked because they seem fixed or routine, but they drift upward faster than most owners realize.

Untracked input costs are a bankruptcy trap for SMBs. The solution is a real-time cost tracking system built into your monthly financial rhythm.

Steps to implement real-time cost tracking:

  1. List every input cost category relevant to your business, including direct and indirect costs.
  2. Assign ownership: one person is responsible for monitoring each category.
  3. Set a baseline cost for each category using the last three months of actual spend.
  4. Connect your accounting software to your bank and card feeds so transactions post automatically.
  5. Create weekly variance reports comparing actual spend to baseline for each category.
  6. Flag any category that exceeds baseline by more than 5% for immediate review.
  7. Review the full cost report in your weekly financial check-in meeting.

The most common unmonitored expenses that quietly drain SMB margins include:

  • Annual software subscriptions that auto-renew at higher rates
  • Vendor price creep on recurring supply orders
  • Payment processing fees that increase with transaction volume
  • Overtime and contractor costs that are not tracked against project budgets
  • Shipping and logistics surcharges added without notice
  • Bank fees and foreign exchange costs on international payments

Strong profitability management requires you to know your margin at the product or service level, not just at the company level. Tracking key financial metrics by segment tells you which parts of the business are carrying the others. Solid budgeting strategies help you set realistic cost targets and hold teams accountable to them.

Pro Tip: Set up an automated dashboard in your accounting platform that flags any cost category rising more than 5% above baseline. This turns cost control from a monthly review into a live early-warning system.

Build financial resilience with reliable credit strategies

Having controlled costs, strategic access to credit can make or break your company’s agility. Most SMBs treat credit as an emergency tool. That is exactly backwards. The best time to secure a credit line is when you do not need it, because lenders offer better terms to businesses that look financially healthy.

Unreliable credit lines are a common cause of SMBs running into serious trouble. Relying on a single credit provider leaves you exposed if that lender tightens terms, reduces your limit, or exits the market entirely.

Credit options comparison for SMBs

Credit typeBest forProsCons
Term loanEquipment, expansionFixed payments, predictableLess flexible, requires strong credit
Line of creditWorking capital gapsDraw as needed, revolvingVariable rates, can be reduced by lender
Bridge financingShort-term cash gapsFast access, flexibleHigher cost, short repayment window
Invoice financingSlow-paying clientsImmediate cash from receivablesFee-based, reduces invoice value

For short-term liquidity needs, bridge financing options can fill gaps while longer-term solutions are arranged. Understanding how to attract the right type of financing is covered in detail in our guide on attracting business financing.

Best practices for managing business credit proactively:

  • Review your credit facilities annually, even when you are not using them
  • Maintain relationships with at least two lenders so you always have a backup
  • Draw on your credit line occasionally and repay promptly to build a usage history
  • Keep your debt service coverage ratio (DSCR) above 1.25 to remain attractive to lenders
  • Monitor your business credit score quarterly and dispute errors immediately
  • Separate strategic debt (growth investment) from survival borrowing (covering operating losses)

Strategic debt funds assets that generate returns greater than the cost of borrowing. Survival borrowing funds losses. One builds your business. The other delays a problem that needs a different solution entirely.

Adopt 13-week forecasting and scenario planning

Solid credit and cost controls need to be paired with forward-looking financial insight. The 13-week rolling cash flow forecast is the single most powerful tool a CFO brings to a small business. It covers one full quarter, updated every week, so you always have a live view of where your cash is heading.

CFOs favor this time frame because it is long enough to act on what you see and short enough that the numbers stay accurate. Monthly forecasts are too infrequent. Annual projections are too abstract. Thirteen weeks sits in the sweet spot.

Steps to build and maintain a 13-week rolling forecast:

  1. List all expected cash inflows week by week: collections, deposits, and any scheduled receipts.
  2. List all fixed outflows: payroll, rent, loan payments, and recurring subscriptions.
  3. Add variable outflows: inventory, contractor payments, and marketing spend.
  4. Calculate the net cash position for each week.
  5. Identify any weeks where the balance drops below your minimum operating threshold.
  6. Build three versions: base case, best case, and worst case, using realistic assumptions for each.
  7. Update the forecast every Monday morning before the week begins.

Scenario planning is where this tool becomes genuinely powerful. Your worst-case scenario should assume your two largest clients delay payment by 30 days simultaneously. If your business can survive that scenario, you have real resilience. If it cannot, you now know exactly what to fix.

Key stat: SMBs that implement early forecasting and turnaround financing avoid bankruptcy in 60-70% of cases.

Our cash forecasting process walks you through building this model from scratch, with templates designed for businesses at every stage.

Pro Tip: Review and revise your forecast every week, not once a month. Weekly updates catch problems three to four weeks earlier than monthly reviews, and that extra time is often the difference between a manageable fix and a crisis.

Our perspective: What most articles miss about strategic finance

Most guides on strategic finance treat it as a setup task. Build a budget in January, review it in December, and call it done. That approach is not a strategy. It is a ritual.

The SMBs we see navigate growth and downturns successfully share one habit: they stay close to their numbers every single week. Not because they are anxious, but because they are informed. Weekly engagement with your SMB financial planning process means you catch a cash dip in week two, not week eight when options are limited.

The other missing piece is honest scenario testing. Most owners build one forecast and hope it holds. The CFO mindset builds three forecasts and plans for the worst one. That is not pessimism. That is preparation.

“The businesses that survive shocks are not the ones with the most cash. They are the ones who saw the problem coming and had a plan ready.”

Strategic finance is not a once-a-year exercise. It is a weekly discipline. The tools are simple. The commitment to use them consistently is what most owners underestimate.

Take your financial strategy to the next level

If these practices feel like a lot to implement on your own, you are not alone. Most SMB owners are running their business while also trying to be their own CFO, and that split focus is exactly where financial blind spots grow.

https://johngalt-finance.com

John Galt Finance provides outsourced CFO expertise built specifically for businesses like yours. Start with our business financial planning guide to build the foundation, use our cash flow forecasting help to set up your 13-week model, or get a financial health check to see exactly where your business stands today. Real CFO-level insight, without the full-time cost.

Frequently asked questions

What is the difference between revenue and cash flow in small business finance?

Revenue is the income earned from sales, while cash flow is the actual movement of money in and out. A business can show strong revenue yet face cash shortages when clients pay late or expenses hit before collections arrive.

Why is tracking input costs important for strategic finance?

Untracked input costs create blind spots that quietly erode margins. Small unmonitored expenses like vendor price creep and auto-renewing subscriptions compound over time into significant financial problems.

How does a 13-week forecast help small businesses avoid bankruptcy?

It gives you early visibility into cash shortfalls so you can act weeks before a crisis hits. Early forecasting and financing improve SMB survival odds by 60-70% compared to reactive approaches.

What are the signs of poor credit management in an SMB?

Frequent overdrafts, last-minute borrowing to cover payroll, and rejected credit applications all signal weak credit strategy. Unreliable credit access is one of the most common triggers for SMBs running into serious financial trouble.

FAQ

What does strategic finance actually mean for an SMB?

Strategic finance is the practice of using financial data to make forward-looking business decisions, not just reporting on the past. For SMBs it means: tying every dollar of spend to a return, knowing your unit economics by segment, modeling scenarios before committing to hires or capex, and using cash position to dictate growth pace.

How is strategic finance different from accounting?

Accounting answers “what happened?” Strategic finance answers “what should we do next?” Accounting is precision and compliance (down to the cent, GAAP-compliant). Strategic finance is direction and trade-offs (precision optional, decision-grade always). Both are needed – confusing them is why many SMBs over-invest in accountants and under-invest in CFO-level thinking.

What’s the minimum strategic finance stack for a $1M-$10M business?

(1) Clean monthly P&L and balance sheet, closed by BD 10. (2) Rolling 13-week cash flow forecast. (3) Driver-based annual budget refreshed quarterly. (4) Weekly KPI dashboard (revenue, margin, runway, top 5 operating metrics). (5) Pricing model that ties to unit economics. Everything else can wait until you’re above $10M.

How do I know if my finance function is broken?

Five red flags: (1) you don’t know cash runway to the week, (2) monthly close finishes after BD 15, (3) budget variances aren’t explained, (4) pricing hasn’t been reviewed in 18+ months, (5) major decisions (hire, raise, capex) happen without a model. Any two of these = real risk. All five = you’re flying blind.

Can software replace a fractional CFO?

No, but it makes one cheaper to staff. Tools like Cube, Mosaic, Causal, or Pigment automate the data plumbing – close, consolidation, dashboards. They don’t make decisions or pressure-test assumptions. The CFO interprets what the dashboard says and translates it into action. Software is a force multiplier for finance talent, not a substitute.

Share this:

Essential types of financial models every business owner needs

Financial Model Types at a Glance

Model TypePrimary UseBuild TimeWhen You Need It
3-Statement ModelOperating baseline, banking20-40 hoursAny business above $500K revenue
13-Week Cash FlowLiquidity, runway10-20 hoursTight cash or turnaround
Driver-Based ForecastBudget, scenario planning30-60 hoursAnnual planning, board reporting
DCF ValuationM&A, fundraising20-40 hoursSelling, raising, buying
Unit Economics ModelPricing, GTM efficiency15-30 hoursSaaS, e-commerce, services
LBO ModelPE evaluation40-80 hoursPE buyer or sponsor exit
Cap Table ModelDilution, exit waterfall5-15 hoursAny company with equity rounds

Choosing the wrong financial model is one of the most expensive mistakes a growing business can make. You might be generating solid revenue, yet still run into cash shortfalls, miss funding opportunities, or make hiring decisions based on incomplete data. The right financial model gives you a clear, structured view of your numbers so you can act with confidence instead of guessing. This article walks through the major types of financial models, explains when each one applies, and helps you match the right tool to your specific business situation, whether you’re managing cash flow, planning for growth, or preparing for investment.

Table of Contents

Key Takeaways

PointDetails
Match model to needChoose your financial model based on specific goals like cash flow, growth, or scenario planning.
Three-statement is foundationalEvery business should start with a three-statement model to ensure strategic decisions translate to cash.
Blend models for accuracyCombining driver-based, scenario, and forecasting models provides a more complete view of your business.
Update and validateRegularly update models with new data and check for errors to keep forecasts relevant and reliable.

How to choose the right financial model: Key criteria for SMBs

Before you build anything, you need to know what you’re solving for. Business owners often jump straight into spreadsheets without defining the core question their model should answer. That’s where things go sideways.

Start by identifying your primary goal. Are you trying to manage cash flow month to month? Evaluate a potential acquisition? Prepare for a funding round? Or simply understand which products are actually profitable? Each goal points to a different model type. Mixing them up wastes time and produces misleading outputs.

Next, consider these selection criteria:

  • Data availability: How much historical data do you have? Models that rely on regression or time series analysis need at least 12 to 24 months of clean data to be reliable.
  • Business complexity: A single-product service business needs a simpler model than a multi-location retailer with seasonal demand.
  • Industry norms: Some industries have standard model structures. SaaS businesses, for example, track MRR, churn, and CAC. Manufacturers focus on unit economics and inventory turns.
  • Decision timeline: Short-term cash planning calls for rolling 13-week cash flow models. Long-term strategy needs a 3 to 5-year integrated model.

For most SMBs, the best starting point is a combination of foundational and driver-based models. CFO-level analysis for SMBs prioritizes three-statement and driver-based models to connect growth strategies like hiring or expansion directly to profitability. From there, you can layer in scenario and sensitivity analysis as your needs grow.

Good financial planning for business always starts with the question, not the tool. Define what you need to know, then choose the model that answers it.

Pro Tip: Benchmark your model assumptions against industry metrics before finalizing them. If your projected gross margin is 20 points above the industry average, that’s a red flag worth investigating before you present to investors or lenders.

Three-statement models: The backbone of business financials

If there’s one model every business owner should understand, it’s the three-statement model. Everything else builds on it.

Accountant working on three-statement financial model

The three-statement model connects your income statement, balance sheet, and cash flow statement into a single, integrated view of your business. That connection matters more than most people realize. A business can show accounting profit while burning through cash. Without all three statements linked, you won’t see that problem coming.

Here’s what each statement contributes:

  • Income statement: Shows revenue, costs, and profit over a period. It tells you whether the business is operationally viable.
  • Balance sheet: Shows what the business owns and owes at a point in time. It captures the long-term financial position.
  • Cash flow statement: Tracks actual cash in and out. It’s the difference between profit on paper and money in the bank.

The real power comes from integration. When you increase sales in the income statement, the model automatically updates accounts receivable on the balance sheet and adjusts operating cash flow. That’s how you catch the common trap of fast growth destroying cash.

Three-statement models are foundational for SMB financial planning and are the starting point for nearly every advanced analysis. Think of the three-statement model as the difference between a financial model vs business plan: one is a narrative, the other is a living, testable system.

For owners focused on SME profitability steps, this model also helps identify margin leaks and working capital inefficiencies that would otherwise stay hidden. You can also use it as a financial health check to assess your current position before making major moves.

Pro Tip: Always reconcile ending cash on your cash flow statement to the cash balance on your balance sheet. If they don’t match, there’s an error somewhere in the model. Catching this early saves hours of troubleshooting.

Forecasting models: Predicting business performance

Once your three-statement foundation is in place, the next step is projecting forward. Forecasting models help you estimate future revenue, costs, and cash flow based on patterns, assumptions, and business logic.

There are two broad categories: quantitative and qualitative. Quantitative models rely on historical data, using methods like straight-line projection, percent-of-sales, or bottom-up unit economics. Qualitative models rely on expert judgment or market research, which makes them more useful for early-stage businesses without much data.

Here’s a comparison of the most common forecasting approaches:

Model typeBest use caseKey advantageMain limitation
Straight-lineStable, predictable revenueSimple and fastMisses trend changes
Moving averageSmoothing short-term fluctuationsReduces noiseLags behind sudden shifts
RegressionIdentifying relationships between variablesData-driven and testableNeeds sufficient data
Time series (ARIMA)Seasonal or cyclical businessesHandles complex patternsTechnically demanding
Bottom-upNew products or marketsGrounded in unit economicsTime-intensive to build

For most SMBs, a bottom-up approach (units times price, times conversion rate) is the most defensible method for revenue forecasting. It forces you to think through the real drivers of your business rather than just extrapolating a trend line.

Here’s a quick example of how the choice matters:

  1. A straight-line model projects 10% annual growth based on last year’s revenue.
  2. A regression model identifies that your revenue correlates strongly with local construction permits issued.
  3. When permits drop 30% in Q1, the regression model signals a revenue slowdown months before it shows up in your bank account.

Seasonality is one of the most overlooked pitfalls. Many businesses apply flat monthly assumptions, then get blindsided by Q4 cash crunches or Q1 slowdowns. A solid cash flow forecasting guide will always account for seasonal patterns in both revenue and expenses.

Budgeting, scenario, and sensitivity models: Planning for uncertainty

Forecasting tells you what’s likely. Budgeting, scenario analysis, and sensitivity modeling tell you what to do when things don’t go as planned.

These three tools are often lumped together, but they serve distinct purposes:

  • Budgeting models translate your strategy into a financial plan. They set spending limits, revenue targets, and resource allocation for a defined period.
  • Scenario models test how your business performs under different conditions: a best case, a base case, and a worst case. They answer the question, “What happens if sales drop 20%?”
  • Sensitivity models isolate one variable at a time to measure its impact. They answer, “How much does a 1% change in gross margin affect net profit?”
Model typePrimary functionWhen to use it
BudgetingAllocate resources and set targetsAnnual planning, monthly tracking
Scenario analysisTest outcomes under different conditionsStrategic decisions, fundraising
Sensitivity analysisMeasure impact of single variable changesPricing decisions, cost negotiations

“Ignoring volatility in your financial model isn’t conservative. It’s reckless. Every business faces uncertainty, and the models that don’t account for it give leaders false confidence at exactly the wrong moment.”

Scenario analysis covering base, best, and worst cases combined with error checks and modular design represents current best practice for SMB financial modeling. Pair that with budgeting best practices to build a planning process that’s both rigorous and practical.

To build a solid scenario or sensitivity analysis, follow these steps:

  • Identify your top 3 to 5 business drivers (revenue growth rate, gross margin, customer churn, payroll costs).
  • Define realistic ranges for each driver based on historical data and market research.
  • Build separate scenario tabs or toggle switches in your model.
  • Test each scenario and document the financial impact clearly.
  • Review scenarios at least quarterly and update assumptions with actual results.

Driver-based and advanced models: Linking strategy to results

Driver-based models are where financial modeling becomes genuinely strategic. Instead of starting with revenue as a single input, you break it down into the specific activities that generate it.

Common business drivers include:

  • Price and volume: Average selling price times units sold.
  • Customer metrics: Customer acquisition cost (CAC), average revenue per user (ARPU), and churn rate.
  • Operational metrics: Utilization rates, headcount productivity, and inventory turns.
  • Marketing inputs: Lead volume, conversion rates, and sales cycle length.

The value of this approach is control. When you model revenue as a function of leads times conversion rate times average deal size, you can immediately see which lever to pull to hit your target. That’s a fundamentally different conversation than just saying “we need to grow 15%.”

Driver-based models link operations to finance, while advanced machine learning models like gradient boosted machines allow more complex prediction, though they require careful attention to explainability and data quality. For most SMBs, machine learning is overkill. Focus on getting your driver-based model right first.

The custom financial modeling process at John Galt Finance is built around driver-based logic, connecting your specific operational activities to financial outcomes. For SaaS businesses, tracking SaaS financial KPIs within a driver-based model is especially powerful. And regardless of industry, anchoring your model to key financial KPIs keeps the analysis grounded in what actually matters.

Pro Tip: Use a blend of models rather than betting everything on one approach. A driver-based model for revenue, a three-statement model for integration, and a scenario model for risk testing gives you a complete picture without unnecessary complexity.

The uncomfortable truth: Why CFO-level models matter more than ever

Here’s something most financial modeling guides won’t say directly: most small business owners overestimate how good their models actually are.

A spreadsheet with last year’s revenue plus 10% is not a financial model. It’s a wish. And building strategy on a wish is how businesses get caught off guard by cash shortfalls, margin compression, or growth that actually destroys value.

The uncomfortable reality is that simple models feel safe because they’re easy to understand. But that simplicity often hides the risks that matter most, like cyclicality, scale effects, or the cash impact of rapid hiring. Bottom-up revenue modeling is more defensible than top-down approaches, and avoiding optimism bias in assumptions is critical to model integrity.

Scenario planning is not a nice-to-have. It’s a leadership discipline. The businesses that navigate downturns and capitalize on growth windows are the ones that ran the scenarios before the situation forced their hand. They weren’t smarter. They were more prepared.

The best models are updated constantly with actual results, challenged regularly, and built with humility about what you don’t know. If your custom modeling for business growth process doesn’t include regular variance analysis and assumption reviews, it’s already becoming unreliable.

Treat your financial model as a living tool, not a document you file away after budget season.

Take your business further with expert financial modeling

Building the right financial model takes more than a good spreadsheet template. It takes CFO-level thinking about your specific business, industry, and goals.

https://johngalt-finance.com

At John Galt Finance, we build custom financial models tailored to your business drivers, growth stage, and decision-making needs. Whether you need a solid three-statement foundation, a scenario model for your next funding round, or a driver-based model to connect your operations to your numbers, we can help. Explore our financial planning guide to see how strategic planning translates into real results, or start with our cash flow forecasting resources to strengthen your near-term visibility. Your next strategic move deserves a model built to support it.

Frequently asked questions

What is the difference between quantitative and qualitative financial models?

Quantitative models rely on historical data and are more accurate when sufficient data exists. Qualitative models use expert judgment or market research, making them better suited for startups or new markets with limited historical information.

When should a small business use a three-statement financial model?

Use a three-statement model whenever you’re making a major strategic decision, seeking outside funding, or need a clear view of actual cash flows rather than just reported profit. Three-statement models are foundational for any serious financial planning process.

How often should I update my financial models?

Update your models at least quarterly, comparing actual results against your forecasts and adjusting assumptions based on new information. Best practice is quarterly updates with actuals versus forecast reviews to keep your model accurate and decision-ready.

What are driver-based models and why are they useful?

Driver-based models build financial projections from specific operational variables like price, volume, churn, and customer acquisition cost. Driver-based models link operations directly to financial results, making them powerful tools for testing strategies and setting priorities.

FAQ

Which financial model should I build first?

Always start with a 3-statement model (P&L, balance sheet, cash flow) tied together with formulas. Everything else – DCF, scenarios, unit economics – layers on top. If you skip the 3-statement foundation, every downstream model will have hidden inconsistencies.

Excel, Google Sheets, or a dedicated tool?

For models under $50M revenue, Excel or Google Sheets is fine and usually better – more flexible, no vendor lock-in, every finance person can read it. Move to a dedicated tool (Cube, Mosaic, Pigment, Causal) when you have 3+ entities, multi-currency, or 5+ stakeholders editing simultaneously.

How often should I update my financial model?

Operating model: monthly, alongside the close. 13-week cash flow: weekly rolling. Annual budget: refreshed quarterly with re-forecast. Fundraising/DCF model: only when raising or doing M&A. A model that’s not updated within 30 days of the last close is functionally dead – investors and banks can tell.

What’s the most common mistake in DIY financial models?

Hard-coding numbers instead of using drivers. If you change revenue growth from 20% to 30%, the model should automatically flow through every line. If you have to manually update 15 cells, the model is broken. Second most common mistake: balance sheet doesn’t balance – usually a sign of mixed sign conventions or missing flow accounts.

Do I need a financial model to raise capital?

Yes – for any institutional round (Series A and later). Banks usually require a 3-year forecast for credit lines above $500K. Angels and seed investors care less about model precision and more about logic and unit economics. The model is less about predicting the future and more about proving you understand the levers of your business.

Share this:

Essential financial metrics to track for SMB growth: 2026

Essential SMB Financial Metrics

MetricBenchmark
Gross margin (B2B services)40-60%
Operating margin (mature SMB)8-15%
Current ratio (healthy)1.5-3.0
Debt-to-equity ratio (healthy)<2.0
DSO target (B2B SMB)25-45 days
Cash conversion cycle target<60 days (industry dependent)
Working capital ratio1.2-2.0x
Free cash flow margin (healthy SMB)>8%

Most small business owners are running their companies on gut instinct and a rough sense of their bank balance. That approach works until it doesn’t, and 82% of small business failures cite cash flow problems as a core cause. The real issue isn’t a lack of data. It’s tracking the wrong numbers, or too many at once, until the signal gets buried in noise. This article cuts through that by walking you through the exact CFO-level financial metrics that give you clarity, help you catch problems early, and support smarter decisions without requiring a finance degree or a full-time hire.

Table of Contents

Key Takeaways

PointDetails
Focus on key metricsTracking just a few high-impact metrics is more effective than monitoring everything.
Profit, liquidity, cash flowProfitability, liquidity ratios, and cash flow are the three strategic pillars for SMB monitoring.
Benchmark your numbersUse industry benchmarks to spot early issues and set realistic goals.
Act on your dataMetrics only matter if they drive regular business decisions and improvements.

How to choose which financial metrics to track

Before diving into the specific numbers, it’s critical to know how to pick which financial metrics are worth your time. Most accounting software will generate dozens of reports. That’s not a feature. For a business owner without dedicated financial staff, it’s a trap.

The right metrics share three qualities. First, they must be relevant to your business model. A SaaS company needs to watch monthly recurring revenue and churn. A product retailer needs gross margin and inventory turnover. Second, they must be actionable. If a number changes and you don’t know what to do about it, it’s not a useful metric yet. Third, they must be comparable, either to your own historical data or to industry benchmarks.

Every SMB, regardless of industry, should anchor their financial dashboard around three universal pillars:

  • Profitability: Are you making money after all costs?
  • Liquidity: Can you cover what you owe right now?
  • Cash flow: Is real money actually moving in and out as expected?

Core profitability metrics include Gross Profit Margin, Net Profit Margin, and EBITDA, and each serves a different diagnostic purpose. Understanding which one answers which question is the first step toward building a useful dashboard. You can explore a deeper breakdown of key financial KPIs to see how these metrics connect to real business decisions.

Pro Tip: Limit your core dashboard to no more than six metrics. Review them quarterly to decide if they’re still the right ones. The goal of making metrics actionable is to reduce decision fatigue, not add to it.

Profitability metrics every SMB should watch

With a framework for selecting metrics, let’s break down the core profitability measures that should anchor your dashboard.

Gross Profit Margin is calculated as: (Revenue minus Cost of Goods Sold) divided by Revenue, times 100. It tells you how efficiently you’re delivering your product or service before overhead kicks in. In service businesses, a healthy gross margin typically runs between 50% and 70%. In retail, it’s often lower, around 25% to 45%, depending on the category.

Accountant calculating gross profit margin at desk

Net Profit Margin goes further. It accounts for all operating expenses, taxes, and interest. The formula is: (Net Income divided by Revenue, times 100). This is your real bottom line. Net profit 7-10% is considered healthy for most SMBs, while gross margins of 50-70% are typical in service industries. If your net margin is consistently below 5%, something in your cost structure needs attention.

EBITDA (Earnings Before Interest, Taxes, Depreciation, and Amortization) is useful for internal performance tracking because it strips out financing and accounting decisions. It’s not a GAAP measure, but it gives you a cleaner view of operational performance. Many lenders and investors use it to compare businesses.

Here’s a quick reference for profitability benchmarks:

MetricFormulaHealthy SMB Range
Gross Profit Margin(Revenue – COGS) / Revenue25-70% (varies by sector)
Net Profit MarginNet Income / Revenue7-10%
EBITDA MarginEBITDA / Revenue10-20%

Pro Tip: Track these margins monthly, not just at year-end. A two-month dip in gross margin often signals a pricing or supplier cost issue you can still fix. Connecting this to financial planning best practices helps you build a system that catches these shifts automatically.

“Margins don’t lie. If your gross margin is shrinking quarter over quarter, your business model is under pressure, regardless of what your revenue line says.”

Liquidity ratios: Can you actually pay your bills?

Beyond profitability, SMBs live and die by their ability to cover day-to-day expenses. Here’s how to track that pulse.

Liquidity ratios measure your ability to meet short-term financial obligations using assets you can convert to cash quickly. Three ratios matter most:

  1. Current Ratio: Current Assets divided by Current Liabilities. This is the broadest measure. A ratio of 1.2 to 2.0 is generally considered ideal. Below 1.0 means you can’t cover your short-term debts with current assets.
  2. Quick Ratio: (Current Assets minus Inventory) divided by Current Liabilities. This strips out inventory, which may not convert to cash quickly. A ratio above 1.0 is a safer signal of real liquidity.
  3. Cash Ratio: Cash and Cash Equivalents divided by Current Liabilities. The strictest test. A ratio of 0.5 or above is generally solid for most SMBs.

“Liquidity above 1 is healthy, but optimize for growth, not just safety. Idle cash is a missed opportunity.”

Here’s how the three ratios compare:

RatioWhat it measuresTarget range
Current RatioBroad short-term coverage1.2 to 2.0
Quick RatioCoverage without inventoryAbove 1.0
Cash RatioStrictest cash coverage0.5 or above

A common mistake is celebrating a high current ratio without asking why it’s high. If the number is inflated by slow-moving inventory or uncollected receivables, your actual liquidity is weaker than it looks. Review your best practices for cash management to understand how to keep liquidity healthy without leaving growth capital sitting idle. Pairing this with financial risk mitigation strategies gives you a full picture.

Cash flow: The metric that makes or breaks SMBs

If profitability and liquidity are your engine and gas tank, cash flow is the fuel line keeping you moving. This is where crises happen fast.

Here’s the uncomfortable truth: you can be profitable on paper and still run out of money. This happens when revenue is recognized before cash is collected, or when expenses hit before client payments arrive. It’s called the cash flow vs. profit trap, and it catches a lot of growing businesses off guard.

82% of failures stem from cash flow mismanagement, not from a lack of sales or even a lack of profit. The fix is a direct cash flow forecast, which tracks actual money in and out rather than accrual-based accounting entries.

Here’s how to build a basic one:

  • List all expected cash inflows by week: customer payments, deposits, loan proceeds
  • List all expected cash outflows: payroll, rent, supplier payments, loan repayments
  • Calculate the net weekly position and carry it forward
  • Flag any weeks where the balance drops below your minimum operating threshold

The direct method is especially useful when your runway is short. It forces you to think in real cash terms, not accounting abstractions. You can follow the full cash flow forecasting steps to build this out properly for your business.

Pro Tip: Use a rolling 13-week cash flow forecast. It gives you enough forward visibility to act before a crunch hits, not after. See how one business used this approach in a real SMB cash flow turnaround case.

Bringing it together: Comparing metrics and making smarter decisions

Having examined each priority metric, let’s bring them together for easy reference and practical decision-making.

Different business situations call for different metric priorities. Here’s a consolidated reference table:

MetricFormulaHealthy benchmark
Gross Profit Margin(Revenue – COGS) / Revenue25-70%
Net Profit MarginNet Income / Revenue7-10%
EBITDA MarginEBITDA / Revenue10-20%
Current RatioCurrent Assets / Current Liabilities1.2 to 2.0
Quick Ratio(Current Assets – Inventory) / Current LiabilitiesAbove 1.0
Cash Flow (13-week)Actual inflows minus outflowsPositive weekly balance

SMB benchmarks for average gross and net margins, owner salary, and failure rates provide useful context for where your numbers should sit. Knowing the benchmark is only useful if you also know which metric matters most for your current stage.

Here’s a situational priority guide:

  1. Startup phase: Focus on cash flow and gross margin. You need to know if your model works and if you can survive long enough to prove it.
  2. Growth phase: Add net margin and current ratio. Scaling costs money, and you need to know if growth is profitable and sustainable.
  3. Crisis or tight cash: Cash ratio and 13-week forecast become your primary tools. Everything else is secondary.
  4. Mature and stable: All six metrics should be on your monthly dashboard, with quarterly recalibration against benchmarks.

The real value of a financial model vs. business plan comparison is understanding that metrics aren’t static. Your dashboard should evolve as your business does.

A CFO’s take: The real secret to financial clarity for SMBs

Here’s something most financial advice won’t tell you: more metrics don’t equal more control. In practice, they often equal paralysis. Business owners who track 20 KPIs tend to act on none of them because no single number feels urgent enough to move on.

The businesses we’ve seen transform fastest are the ones that picked one or two numbers and got obsessive about them. One client shifted their entire operational focus to weekly gross margin by service line. Within a quarter, they had cut their lowest-margin offering and reinvested that capacity into their highest-margin one. Revenue barely moved. Profit jumped 18%.

Liquidity ratios above 1 are healthy, but too high a ratio can signal missed growth investment. That kind of nuance only becomes visible when you’re watching the right number closely enough to ask why it’s moving.

The other lesson: data beats intuition, but only if you act on it. A dashboard you review and ignore is worse than no dashboard at all, because it gives you false confidence. If you’re unsure whether your current metrics are the right ones, it may be time to consider when to seek a CFO for a fresh perspective.

Pro Tip: If you track nothing else, track cash flow. It’s the earliest warning system you have.

Level up your financial metrics with expert guidance

If the right metrics feel overwhelming, or if you want tailored advice, here’s a smarter way to get expert results without the price tag of a full-time CFO.

https://johngalt-finance.com

John Galt Finance provides fractional CFO services built specifically for businesses like yours, with 5 to 50 employees and revenues between $500k and $20 million. We help you identify the essential financial KPIs that match your stage, build forecasting models that actually get used, and turn your numbers into decisions. You get CFO-level thinking without the full-time cost. If you’re ready to stop guessing and start growing, visit John Galt Finance to see how we work.

Frequently asked questions

What is the most important financial metric for small businesses?

Cash flow is the most predictive metric for SMB survival. 82% of failures cite cash flow issues as a primary cause, making it the single most critical number to monitor.

How often should I review my financial metrics?

Review your top metrics monthly at minimum, and monitor cash flow and liquidity weekly during any period of growth or tight cash. Quarterly reviews help you recalibrate which metrics belong on your dashboard.

What is a healthy profitability margin for SMBs?

A net profit of 7-10% is considered healthy for most SMBs, and gross margins of 50-70% are typical for service businesses. Retail businesses generally run lower gross margins.

What does the current ratio tell business owners?

The current ratio shows whether you can cover short-term debts with current assets. A ratio of 1.2 to 2.0 is considered healthy for most small businesses.

How is cash flow forecasting different from profit tracking?

Cash flow forecasting tracks actual money moving in and out of your business by date, while profit vs. cash flow tracking is accrual-based and can miss dangerous timing gaps between revenue recognition and actual payment.

Article generated by BabyLoveGrowth

FAQ

What are the most important financial metrics for an SMB owner to know?

Gross margin, EBITDA margin, cash conversion cycle, customer concentration, and cash runway. Master these five and you can run a $10M business confidently. Anything else is supporting detail.

How do I track financial metrics without a CFO?

Start with a one-page monthly dashboard in Google Sheets pulling from QuickBooks. Track 7-10 metrics with prior-month and prior-year comparison. Tools like Fathom, Jirav, or LiveFlow automate this for $50-300/month. See our dashboard build guide.

What’s a healthy gross margin for an SMB?

Industry-dependent: SaaS 70-85%, professional services 40-60%, distribution 15-30%, retail 30-50%, manufacturing 25-45%. Benchmark against your industry, not a generic average. See our profit margin analysis.

How often should I review my metrics?

Weekly for cash and pipeline, monthly for full financial set, quarterly for strategic metrics (LTV, NRR, market share). Reviewing too frequently creates noise; reviewing too rarely lets problems compound.

What metrics matter most before raising capital?

Unit economics (CAC, LTV, payback), revenue growth rate, gross margin trend, cash burn rate, and cohort retention. Investors will deduct 20-40% from valuation if these aren’t clean. See our investor readiness guide.

Share this: