Uncategorized | John Galt

Financial reporting best practices for SMBs: CFO-level insights

Most SMB owners are running their finances on delayed information, outdated spreadsheets, and a vague sense of where the money went. Financial reporting best practices exist precisely to fix that gap. When your reports are accurate, timely, and structured the way a CFO would build them, they stop being a compliance obligation and start being the clearest tool you have for making confident decisions. This article covers what your reporting framework should include, which practices actually move the needle, and where most owners quietly go wrong.

Table of Contents

Key Takeaways

PointDetails
Core financial statementsSMBs should prepare income, balance sheet, equity, and cash flow statements monthly for clear financial insight.
Rolling forecasts matterWeekly updated 13-week cash flow forecasts help SMBs manage liquidity and avoid failure.
Automate and controlIntegrate technology and internal controls to cut errors and speed reporting cycles.
Align with IFRSUsing IFRS for SMEs simplifies reporting and enhances transparency while reducing costs.
Cash reserves save businessesMaintaining 3-6 months of cash reserves prevents over 80% of cash flow crises in SMBs.

Establishing core financial reporting criteria for SMB success

Before you can improve your reporting, you need to define what good reporting actually looks like for a business your size. The answer is more specific than most people expect.

Small businesses should prepare four core financial statements monthly: the income statement, balance sheet, shareholders’ equity statement, and cash flow statement. Not quarterly. Not at year-end. Monthly. Each of these documents answers a different question. The income statement tells you whether the business is profitable. The balance sheet shows what you own versus what you owe. The shareholders’ equity statement tracks ownership value over time. The cash flow statement, often the most important for SMBs, reveals whether your business actually has money to operate, regardless of what the income statement says.

Frequency matters as much as content. SMB financial statements reviewed monthly, quarterly, and annually with deliberate time allocations create the kind of layered visibility that drives operational efficiency. Monthly reviews keep you current on income and cash. Quarterly reviews of the balance sheet catch structural issues before they compound. Annual reviews give you the trend data to make credible growth plans.

Compliance is the third leg of the stool. For SMBs operating globally or seeking investor backing, aligning with IFRS for SMEs accounting standards reduces the burden of full IFRS compliance while still producing reports that stakeholders trust. This is not just a legal checkbox. Reporting that meets recognized standards signals financial discipline to lenders, acquirers, and partners.

Here is what your core reporting criteria should cover:

  • Four financial statements prepared and reviewed monthly
  • Quarterly balance sheet analysis to track asset and liability shifts
  • Annual trend review comparing at least two to three years of data
  • Compliance with IFRS for SMEs or a regionally recognized equivalent
  • Stakeholder-ready formatting that any investor or lender can read without a guide

Strong financial analysis for SMBs starts at this foundation. Without it, everything downstream, including forecasting, budgeting, and fundraising, is built on sand. The essential financial metrics for SMBs you track are only as reliable as the reports feeding them.

Key financial reporting best practices for SMBs

Having established foundational criteria, let’s look at the specific practices that drive financial reporting excellence.

82% of small business failures stem from cash flow mismanagement. That number should stop you cold. It means the majority of businesses that fail are not failing because of a bad product or a saturated market. They run out of cash because no one was watching the right numbers at the right time.

Business owner checking cash flow data

The CFO-level response to that risk is the 13-week rolling cash flow forecast, updated every week. This is not a projection you build once and revisit in December. It is a living document that shows you exactly what cash you expect to receive and spend across the next quarter, updated as reality changes. Pair it with good cash flow management strategies and you are no longer guessing.

Here are the core practices to build into your reporting system:

  1. Run a 13-week rolling cash flow forecast. Update it weekly. Flag any week where projected outflows exceed inflows so you can act before the gap opens, not after.
  2. Separate your operating and tax accounts. When tax obligations sit in the same account as operating funds, it is too easy to spend money you do not actually have. Segregation removes the temptation and the confusion.
  3. Keep 3 to 6 months of operating expenses in cash reserves. This is the buffer that keeps a slow month from becoming a crisis. Most SMBs underestimate this figure by half.
  4. Shorten payment terms and incentivize early payment. Net-30 or net-60 terms transfer your cash to your customers for weeks. A 2% discount for payment within 10 days often costs less than a short-term credit line.
  5. Reconcile accounts weekly or monthly without exception. Errors caught within days are correctable. Errors discovered at year-end become audit problems.

Pro Tip: If your team reconciles once a month and consistently finds discrepancies over $1,000, move to weekly reconciliation immediately. The time cost is far lower than the cleanup cost.

This is also where a solid cash flow forecasting guide becomes a practical tool, not just theory. The discipline of weekly updates forces your team to stay close to real numbers rather than comfortable projections.

Leveraging technology and internal controls to improve reporting accuracy

Technology and controls enhance accuracy, but understanding reporting standards guides proper presentation next.

SMBs waste 4 to 6 weeks on monthly closes using spreadsheets. The same report notes that integrating ERP and CRM systems via APIs flags 90% of anomalies through AI before any manual review happens. That is not a small efficiency gain. It is the difference between a finance function that enables decisions and one that just documents what already happened.

Automation of the monthly close is now accessible to businesses well below the enterprise level. Cloud-based accounting platforms connect directly to your bank, your invoicing system, and your payroll provider. When those feeds are live, your close shifts from a two-week reconciliation exercise to a one-to-two-day review and sign-off.

Here is what a technology-supported reporting setup looks like in practice:

  • ERP and CRM integration that syncs transaction data automatically, reducing manual entry errors
  • AI-powered anomaly detection that flags unusual entries, duplicate payments, or out-of-pattern expenses before they reach the report
  • Real-time dashboards that let you see margin trends, cash position, and receivables aging without opening a spreadsheet
  • Automated alerts tied to threshold rules, for example, when a cost category exceeds budget by more than 10%

Internal controls are not just an audit requirement. They are the architecture that makes your financial data trustworthy enough to act on.

Internal controls like segregation of duties prevent 70% of financial errors in SMBs and materially increase stakeholder trust. In practice, this means one person handles revenue recognition, a different person approves payments, and a third person performs reconciliations. No single employee controls an entire transaction cycle.

Pro Tip: You do not need a large team to implement segregation of duties. In a small finance function, the business owner can serve as the approver while a bookkeeper handles processing. The key is that no single person can both initiate and approve a transaction.

The payoff for investing in these controls shows up in creating impactful financial reports that leadership, investors, and lenders can trust without reservations. If you want to apply strategic finance best practices at a level that scales with your business, internal controls are where you start.

Aligning with IFRS for SMEs standards to simplify financial reporting

Having explored standards alignment, let’s compare best practice elements side-by-side for decision clarity.

The IFRS for SMEs third edition updates Section 19 on Business Combinations, aligning it with IFRS 3 while simplifying the reporting requirements for SMEs, effective 2026. This matters because many SMBs operating internationally have struggled with the gap between full IFRS, designed for large public companies, and simplified local standards that do not always satisfy foreign investors or lenders.

The updated standard reduces reporting complexity without sacrificing the transparency that stakeholders require. Revenue recognition rules are clearer. Business combination accounting is more straightforward. And the IASB has added educational modules that reduce preparation time by 40% while improving compliance and comprehension.

Here is a comparison of key changes between the second and third editions:

AreaSecond editionThird edition (2026)
Business combinations (Section 19)Diverged from full IFRS 3Aligned with updated IFRS 3
Revenue recognitionSimplified but inconsistent with IFRS 15Closer alignment with IFRS 15 principles
Educational supportLimited guidance materialsNew modules cutting prep time by 40%
Effective dateOngoingEffective for periods beginning 2026
Stakeholder transparencyModerateEnhanced through updated disclosures

For SMBs eyeing cross-border transactions, a funding round, or a future exit, aligning early with latest IFRS for SMEs updates is an investment that pays off in due diligence. Buyers and investors do not want to restate your financials. The more your reports already conform to a recognized standard, the cleaner your numbers look under scrutiny.

Comparing common financial reporting practices: what works best for SMBs

With detailed comparison complete, we turn to expert perspective on elevating SMB reporting further.

Not every reporting approach delivers equal results. The table below draws on monthly, quarterly, and annual review frameworks recommended for SMBs, alongside technology and control variables.

PracticeBenefitDrawbackBest fit
Monthly financial reviewsCatches issues early, keeps data currentRequires dedicated time and processAll SMBs with active operations
Quarterly reviews onlyLower time commitmentToo infrequent to catch cash problemsVery early-stage businesses only
Annual-only reviewMinimal ongoing effortHigh risk of costly surprisesNot recommended for any SMB
Manual spreadsheet closeLow upfront cost4 to 6 weeks of lost time monthlyNo SMB with growth ambitions
ERP/AI-integrated closeFlags 90% of anomalies automaticallyInitial setup investmentSMBs with revenue above $500K
Static annual budgetEasy to build onceIrrelevant within weeks of real operationsNot recommended without monthly updates
Rolling 13-week forecastReflects real cash position weeklyRequires discipline to updateAll SMBs with payroll or variable costs
No internal controlsFast and simple initiallyPrevents 70% more errors when appliedNo SMB should skip controls

The pattern is clear. Frequency, automation, and controls consistently outperform the lower-effort alternatives, not in theory but in the error rates, close times, and cash outcomes they produce. The financial analysis techniques that generate real insight require data you can trust. That trust is built through the practices in the left column, not shortcuts.

The overlooked truth most SMBs miss about financial reporting best practices

Here is what most articles about financial reporting will not tell you: the problem is rarely technical. SMB owners know they should review their financials regularly. They know cash flow matters. They know automation exists. The real issue is that reporting gets treated as a backward-looking record of what happened, when its actual value is forward-looking.

A CFO does not read last month’s income statement to confirm what they already know. They read it to identify what changes next. When gross margin drops two points, the question is not “why did that happen?” It is “which product line, which customer segment, and which operational decision caused it, and what do we change this week?”

Maintaining 3 to 6 months of operating expenses in cash reserves is one of the most cited best practices in SMB finance and one of the most ignored. Owners build the reserve, then raid it to fund a growth initiative before the reporting system can flag that the move compromises solvency. Static annual budgets make this worse. They create a false sense of plan adherence while the actual cash position drifts toward danger.

Rolling forecasts work because they force a confrontation with reality every single week. You cannot hide behind a budget that was set in October when your rolling forecast shows you running out of runway in six weeks.

The other gap we see consistently is internal controls treated as audit preparation rather than daily operating infrastructure. Controls are not for your accountant. They are for you. They are the mechanism that ensures the numbers you are reading actually reflect what happened in your business, not what someone recorded out of convenience.

The SMBs that grow with confidence are not the ones with the most sophisticated tools. They are the ones that read their financials with enough discipline to act on what they see. A fractional CFO can install that discipline without the full-time cost, but the mindset shift has to come from the owner first.

Unlock growth with expert CFO-led financial reporting solutions

Knowing the best practices is one thing. Having a system that delivers them consistently, every month, without requiring you to become a financial expert, is another. That is where John Galt Finance works alongside SMB owners.
https://johngalt-finance.com

Our CFO-led financial analysis services translate raw reporting data into decisions your business can act on this week. We build rolling forecasts, design internal controls scaled to your team size, and close your books faster using integrated financial models tailored to your industry. The custom financial modeling process we use is built around your revenue structure, cost profile, and growth targets, not a generic template. And our cash flow forecasting solutions give you the 13-week visibility that separates businesses that scale from ones that stall.

Frequently asked questions

What are the essential financial statements SMBs should prepare monthly?

SMBs should prepare four statements monthly: the income statement, balance sheet, shareholders’ equity statement, and cash flow statement to maintain accurate financial visibility and compliance readiness.

Why is a 13-week rolling cash flow forecast critical for SMBs?

Because 82% of small business failures trace back to cash flow problems, a 13-week rolling forecast updated weekly gives SMBs the lead time to act before a liquidity gap becomes a crisis.

How do internal controls improve SMB financial reporting?

Segregation of duties prevents 70% of financial errors in SMBs, increases stakeholder trust, and ensures report accuracy beyond what basic compliance alone requires.

What benefits does aligning with IFRS for SMEs provide SMBs?

IFRS for SMEs third edition simplifies compliance by aligning with full IFRS, and updated educational resources reduce preparation effort by up to 40% while improving transparency for investors and lenders.

What are common financial reporting mistakes SMBs make?

The most damaging common financial planning mistakes include reviewing financials only annually, ignoring real cash flow data, using overly optimistic projections, and never stress-testing scenarios against a downturn.

Share this:

Why audit financial models: a business owner’s guide

Financial Model Audit Benchmarks

MetricBenchmark
Models with at least one material error~88% (FAST Standard / PwC research)
Average errors per 1,000 formulas2-5
Cost of an outsourced model audit$3,500-$25,000 depending on complexity
Time to audit a 3-statement model1-3 weeks
Acceptable formula error rate post-audit<0.1% material errors
Audit timing (key trigger events)Pre-fundraise, pre-M&A, post-acquisition, annual
Common error categoriesHardcodes, sign errors, broken links, circular logic, formula inconsistency
Reduction in deal break risk30-50% lower with audited model

Most business owners believe their financial models are basically correct. They built them carefully, the numbers add up, and the spreadsheet has been running the same way for two years without obvious problems. That confidence is exactly where the risk lives. The question of why audit financial models is not abstract for small and medium-sized businesses. A single overwritten formula, a flawed revenue assumption, or a miscalibrated AI forecast can send a hiring plan, a loan application, or a pricing decision completely off course. This guide walks through the risks, the process, and the real business case for treating audits as a core management tool.

Table of Contents

Key Takeaways

PointDetails
Model risk explainedFinancial model audits reveal errors and assumptions that could lead to costly decisions if unchecked.
Validation essentialsCore audit components include conceptual soundness, backtesting, sensitivity checks, and ongoing monitoring.
Common pitfallsUnaudited models often suffer from formula overwrites, manual fixes, and hidden AI biases.
Governance mattersIntegrating audits into SMB policies strengthens controls and builds board confidence.
Audit as advantageEffective audits transition from compliance tasks to strategic tools for SMB growth and trust.

Why audit financial models: understanding the risks and regulatory landscape

Model risk is a formal term worth knowing. It refers to the potential for financial loss or bad decisions that result from errors in how a model is built, what data it uses, or how its outputs are interpreted. For banks, this concept is heavily regulated. But the same logic applies to any SMB using a financial model to guide strategy.

Common sources of model risk include:

  • Errors in data inputs such as using outdated sales figures or misclassified expense categories
  • Flawed assumptions like projecting 20% annual growth without evidence to support it
  • Formula errors including broken links between spreadsheet tabs or logic applied to the wrong cell range
  • Misuse of outputs where a model built for one purpose is repurposed for a different decision it was never designed for

Regulators have increasingly emphasized this issue beyond the banking world. The Federal Reserve’s updated model risk guidance specifically stresses proportional auditing based on model complexity and potential impact. The takeaway for SMBs is not that you need banking-grade compliance. It is that independent validation identifies limitations and errors before they influence decisions, reducing the kind of model risk that leads directly to financial loss.

Understanding your exposure to business financial risks starts with knowing where your models might be lying to you. Even well-intentioned models drift. Staff changes, business pivots, and pasted-in data all introduce errors that compound quietly over time.

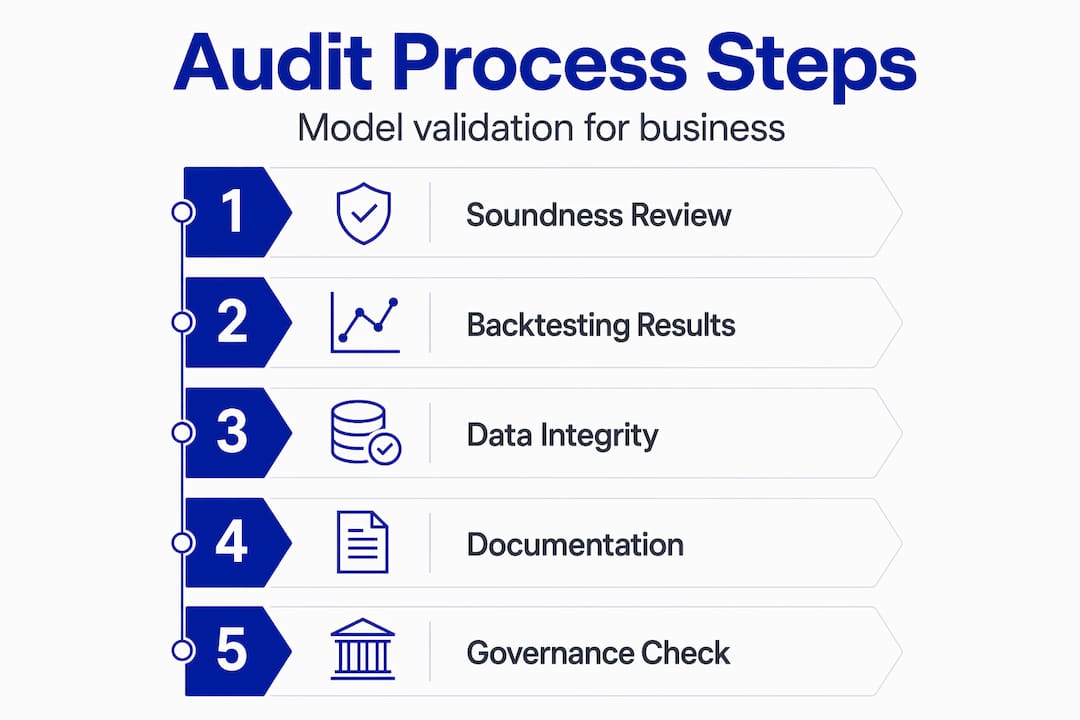
Infographic showing financial model audit steps

Now that the risks and regulatory context are clear, let’s explore the core components of effective financial model auditing.

Core components of effective financial model audits for SMBs

A model audit is not a single pass through a spreadsheet looking for typos. It involves several distinct activities, each targeting a different failure point.

  1. Validation checks whether underlying assumptions, formulas, and data inputs are accurate and internally consistent. This includes tracing each formula back to its source and confirming logic matches the business reality it is meant to represent.
  2. Backtesting compares what the model predicted to what actually happened. If your cash flow model projected $180,000 in Q3 and the actual figure was $140,000, the gap deserves explanation, not just a shrug.
  3. Sensitivity analysis tests how outputs change when key inputs shift. What happens to your runway if revenue drops 15%? What if supplier costs rise by 8%? This reveals which assumptions carry the most risk.
  4. Ongoing monitoring tracks whether model performance degrades over time. Markets change, customer behavior shifts, and a model that was accurate in 2023 may be structurally outdated in 2026.
  5. Risk tiering focuses audit effort where it matters most. A model driving a $2 million capital raise deserves more scrutiny than a simple monthly expense tracker.

Updated interagency guidance confirms that model validation should include conceptual soundness evaluation, backtesting, sensitivity analysis, and ongoing monitoring performed at least annually for high-risk models.

Pro Tip: Set a concrete threshold for triggering a model review. If a key metric like revenue forecast accuracy drops more than 10% from historical actuals, that is an automatic flag for revalidation. Waiting for the annual cycle is too slow when a model is actively driving decisions.

A periodic financial health check should incorporate these audit components, not treat them as separate activities. They belong together.

Having established audit components, we move to understanding common audit challenges and how to address them to ensure accuracy.

Common pitfalls in financial modeling and how auditing prevents costly mistakes

The most damaging errors in financial models are almost never obvious. They hide inside formulas that look right, inside assumptions that nobody questions because they have always been there.

Typical issues that audits uncover include:

  • Overwritten formulas where someone manually typed a number into a formula cell, breaking the calculation chain
  • Circular references that create phantom numbers by looping calculations back into themselves
  • Unbalanced balance sheets where assets, liabilities, and equity do not reconcile correctly
  • Hardcoded outputs where results are pasted as static values after being manually adjusted at some point
  • Inconsistent time periods where monthly and annual figures are mixed in ways that distort comparisons

“Most spreadsheet model failures stem from poor handoffs and edits over time, not Excel flaws.” Auditing ensures formulas remain consistent and inputs stay controlled.

This is a critical point. The problem is not your software. It is the dozen small edits made by different people over 18 months, none of whom documented what they changed or why.

AI-driven models introduce a different category of risk. They can look polished and generate sophisticated outputs while harboring structural bias or training data that does not reflect your actual business context. The visual presentation of a well-formatted AI model output is not evidence of its accuracy.

Finance manager reviews spreadsheet edits in office

Pro Tip: Before any board presentation or major financial decision, run a 25-point audit on the underlying spreadsheet. Check every formula on the first and last row of each data range, trace every external link, and confirm no cells in formula columns contain static values. This takes about 90 minutes and catches the errors that cost thousands.

For context on which model types carry the highest stakes, reviewing the essential financial models your business should be running helps you prioritize your audit effort.

With pitfalls clear, let’s discuss how to integrate audit insights into your SMB decision-making process.

Integrating financial model audits into SMB decision-making and governance

Audit findings only create value when they connect to actual decisions. A report filed and forgotten does not reduce risk. The goal is to build a governance structure where audit insights directly influence how your business uses its models.

Core practices that embed audits into governance include:

  • Written model use policies that specify who can edit models, what approval is required before a model is used in a major decision, and how version control is managed
  • Assigned validation roles held by someone independent from whoever built the model. This does not require hiring a new employee. It can be a part-time CFO, a financial advisor, or an external firm.
  • Revalidation triggers beyond the annual cycle, including major business changes like entering a new market, acquiring a client segment, or replacing a key revenue stream
  • Audit dashboards that track model risk ratings, validation status, and any open remediation items so nothing falls through the cracks

The following table outlines a practical governance structure for SMBs managing multiple financial models.

RoleResponsibilityKey output
Model ownerBuilds and maintains the modelDocumented assumptions and change log
Independent validatorReviews logic, tests assumptionsValidation report with findings
Finance lead or CFOInterprets results, advises decisionsRisk-adjusted recommendations
Business owner or boardApproves model for use in key decisionsFormal sign-off or escalation

Auditing AI financial models confirms models work as intended, strengthening internal controls, compliance, and protection against bias and reputational risks. That applies whether you are running a machine learning forecast or a standard Excel DCF model.

Building this kind of structure does not require a large finance team. It requires clear roles, documented policies, and regular checkpoints. Strong financial controls are not bureaucracy. They are what separates businesses that catch problems early from those that discover them at the worst possible moment.

Understanding integration leads naturally to recommendations and expert insights on optimizing financial model auditing.

A fresh perspective: why SMBs must rethink the role of model audits beyond compliance

Here is the uncomfortable reality most financial articles skip: the majority of SMBs treat model audits, when they do them at all, as a compliance formality. Something to check off before a bank meeting or an investor conversation. Then the audit is filed away and the model goes back to running exactly as it did before.

That framing misses the entire point.

Kavin Anburaj, a recognized expert in AI financial oversight, has noted that one corrupted data input can invalidate all outputs from an otherwise sound model, urging businesses to embed AI controls as a foundation of trust rather than a periodic review. The same principle holds for any financial model, AI-powered or not.

What we see at John Galt Finance is that business owners who go through a thorough model audit often make three to five significant changes to how they present their financials to lenders and investors. Not because the numbers were wrong on the surface, but because the audit exposed assumptions that were optimistic without basis, or dependencies between variables that nobody had mapped out explicitly.

That kind of clarity is not a compliance benefit. It is a competitive advantage.

Pro Tip: Stop scheduling model audits as one-time events tied to funding rounds or year-end. Build a quarterly review into your normal finance cadence. Even a 30-minute check against recent actuals will catch drift before it becomes distortion.

The businesses that grow sustainably on good financial decisions are not the ones with the most sophisticated models. They are the ones who trust their models because they have done the work to verify them. A well-audited model lets a CFO or owner walk into a board meeting and say “here is what we know, here is what we assumed, and here is our confidence level” without hedging every sentence.

That kind of confidence does not come from building a better spreadsheet. It comes from a custom financial modeling process that includes validation as a built-in step, not an afterthought.

Enhance your business decisions with expert financial model audits and CFO support

If you have reached this point and recognized gaps in how your current models are built, validated, or used, you are not alone. Most growing businesses outpace their financial infrastructure before they notice the strain.

https://johngalt-finance.com

John Galt Finance provides CFO-led financial analysis that connects audit findings directly to business strategy, so you are not just getting a list of errors. You are getting a roadmap for sharper decisions. Our financial health check service includes model validation, performance monitoring, and risk assessment built around your actual business, not a generic template. And if your models need rebuilding from the ground up, our custom financial modeling services are designed for businesses with 5 to 50 employees that need institutional-quality analysis without the cost of a full-time CFO.

Frequently asked questions

Why is auditing financial models important for small businesses?

Auditing helps small businesses identify and fix errors before those errors drive bad decisions, ensuring every strategic call is grounded in accurate data. Independent validation reduces model risk from incorrect outputs that can lead directly to financial loss.

How often should financial model audits be performed?

High-risk models should be validated at least annually, but ongoing monitoring between full audits is just as important. Annual validation for high-risk models is the minimum standard, not the ceiling.

What are common errors found in financial model audits?

The most frequent issues are overwritten formulas, unbalanced sheets, circular references, and manually hardcoded outputs. Most model failures trace back to poor handoffs and undocumented edits, not the original build.

Can AI-driven financial models be trusted without audits?

No. AI models can appear accurate while hiding structural bias or training data problems that only a thorough audit will surface. Auditing AI models confirms they work as intended and protects against reputational and compliance risks.

Who should conduct the financial model audit?

The validator must be independent from whoever built the model, with no stake in validating a particular outcome. Independence in validation is non-negotiable to prevent rubber-stamp approvals that leave real risks buried inside the model.

FAQ

When should I audit my financial model?

Always before a transaction: fundraising, M&A, bank financing, major capex commitment. Also annually for any model used in board reporting. An undetected error in a model used for an acquisition can cost millions.

What does a model audit actually check?

Three layers: (1) mechanical integrity (formulas, links, balance sheet ties to cash flow), (2) logical integrity (revenue drivers make sense, assumptions are internally consistent), (3) presentation quality (clear inputs, scenarios, outputs). A good audit produces a written report with errors and fixes.

How do I avoid building errors into my own model?

Five disciplines: (1) one tab for inputs, never hardcode in calc tabs, (2) consistent color coding (blue inputs, black formulas), (3) every row sums correctly to a check cell, (4) balance sheet check (assets = liabilities + equity), (5) version control with date in filename.

Can I audit my own model?

You can do a basic self-review (re-trace formulas, check totals), but you can’t audit your own logic; you’ll miss the same assumption errors that created the issue. For high-stakes models, always get a fresh set of eyes – ideally a senior FP&A professional or fractional CFO.

How much does a bad model cost?

Documented cases: JP Morgan London Whale ($6B partly traced to Excel errors), TransAlta ($24M loss from a cut-and-paste error), Eastman Chemical ($25M lawsuit settlement). For SMBs, the typical cost is a deal that breaks at diligence or a board decision based on overstated cash flow. See our business valuation guide for context on model use in transactions.

Share this:

Business budgeting tips for SMBs: CFO strategies for growth

SMB Budgeting Benchmarks

MetricBenchmark
SMBs with a formal annual budget~50% (SCORE / Clutch survey)
Recommended budgeting cycleAnnual + monthly rolling forecast
Acceptable revenue variance vs budget+/- 5%
Acceptable opex variance vs budget+/- 3%
Time to build annual budget (no CFO)40-80 hours
Time to build annual budget (with CFO)20-40 hours, higher quality
Marketing spend as % of revenue (B2B SMB)6-12%
G&A as % of revenue ($1M-$10M SMB)8-15%

Budgeting separates businesses that survive from those that scale. Yet most small and medium-sized business owners treat it as an annual paperwork ritual, filled out in December and forgotten by February. That’s a costly mistake. When cash runs dry unexpectedly, when a major expense hits at the wrong time, or when a growth opportunity requires capital you don’t have, a reactive budget won’t save you. The right budgeting strategies, the kind CFOs use at companies far larger than yours, give you the clarity, agility, and control to make faster decisions with greater confidence.

Table of Contents

Key Takeaways

PointDetails
Use hybrid budgetsCombine a master annual budget with a rolling forecast for maximum agility and accountability.
Prioritize cash flowForecast your cash at least monthly and for a rolling quarter to avoid dangerous shortfalls.
Plan scenariosBudget for conservative, baseline, and aggressive cases—and review actuals versus plan monthly.
Control and benchmark costsApply overhead analysis, selective zero-based budgeting, and monitor industry profitability ratios.
Invest in expertiseConsider specialist CFO guidance or tools to elevate your budgeting process and unlock growth.

Start with the right frameworks: Master budget plus rolling forecast

Once you’ve recognized that budgeting fuels growth, your next task is picking the right high-level structure. Most SMBs rely on a single annual budget, which is better than nothing but leaves major blind spots. The gold standard is a dual-framework approach combining a master budget with a rolling forecast.

A master budget is your full-year profit and loss (P&L) projection. It sets revenue targets, allocates costs across departments, and creates accountability benchmarks. It’s the foundation. A rolling forecast, on the other hand, is always looking 12 months ahead regardless of where you are in the calendar year. Update it monthly or quarterly as real data comes in, and it becomes a living navigation system.

According to budgeting for small business best practices, using a 12-month master budget alongside a continuously updated rolling forecast gives SMBs both a fixed target and the flexibility to adapt when conditions shift. The two tools are not redundant. They serve completely different functions.

The hybrid budgeting approach is widely recognized as best practice: keep annual budgeting for accountability and targets, then layer a rolling forecast on top for ongoing decision support. The annual budget holds your team accountable. The rolling forecast keeps you from being surprised.

Key benefits of each framework:

  • Master budget: Establishes annual revenue targets, aligns department spending, supports investor reporting, and creates benchmarks for performance reviews
  • Rolling forecast: Provides a continuous forward view, supports rapid replanning after market shifts, improves cash flow accuracy, and reduces end-of-year scrambles
FeatureMaster budgetRolling forecast
Time horizonFixed 12-month yearAlways 12 months forward
Update frequencyAnnuallyMonthly or quarterly
Primary purposeAccountability and targetsAgility and decision-making
Best suited forGoal setting, board reportingScenario planning, cash management

Pro Tip: Layer scenario planning directly onto your rolling forecast. Each month, run a best-case, base-case, and worst-case projection. This is what separates reactive managers from strategic ones. Outsourced financial modeling can make this process systematic rather than stressful.

If you’re building financial models from scratch, custom financial modeling gives you the architecture to run both frameworks side by side. Understanding essential financial models helps you choose the right tool for each business question.

Forecast cash flow like a pro: The engine of healthy budgets

With your budgeting frameworks set, the next step is making sure your business never runs out of operational cash. Profitable businesses fail every year, not because they lack revenue, but because cash timing breaks down. You might invoice a client for $80,000 and not collect for 60 days. Meanwhile, payroll, rent, and supplier payments don’t wait.

CFO reviews cash flow statement at meeting table

Cash-flow forecasting is a core CFO-level mechanism, and the most useful time scales for SMBs are monthly and quarterly, particularly the 13-week model. A 13-week forecast maps out every cash inflow and outflow across a 90-day rolling window, updated weekly. It sounds detailed because it is. And that detail is exactly what keeps you from a nasty surprise on the 15th when payroll is due.

Here’s what a simplified cash flow forecast structure looks like:

WeekOpening cashCash in (sales, collections)Cash out (payroll, rent, suppliers)Closing cash
Week 1$120,000$45,000$38,000$127,000
Week 2$127,000$12,000$52,000$87,000
Week 3$87,000$60,000$22,000$125,000
Week 4$125,000$18,000$41,000$102,000

That dip in Week 2 is exactly what you need to see in advance. Without a forecast, you’d find out when the bank account drops below zero.

What to include in every cash flow forecast:

  • All expected cash receipts, including customer payments, loans, and tax refunds
  • Fixed disbursements like rent, payroll, and loan repayments
  • Variable disbursements including inventory, marketing, and contractor payments
  • Lumpy expenses such as quarterly insurance premiums, annual software renewals, or seasonal inventory builds
  • Tax outflows, both quarterly estimated payments and annual settlements

Pro Tip: If possible, connect your forecast directly to your payroll software and point-of-sale or invoicing system. Automated data feeds dramatically improve accuracy and reduce the manual work of updating your 13-week cash flow model every week.

For deeper guidance, explore our cash flow forecasting guide and cash flow management tips built specifically for SMBs navigating growth cycles.

Plan for scenarios and track monthly: Conservative, base, and aggressive budgets

Having a solid cash flow model enables more dynamic, data-driven scenario planning for your business. Scenario-based budgeting is not a luxury reserved for Fortune 500 companies. It’s a critical practice for any business that faces uncertainty, which means every SMB.

The best practice is to build three distinct budget scenarios: conservative (pessimistic), base (most likely), and aggressive (optimistic), then review your actual results against these benchmarks every single month.

How to build each version:

  1. Conservative budget: Assume revenue comes in 15 to 20% below your target. Apply worst-case collection timing. Freeze discretionary spending. This is your floor. If you can survive this scenario, you’re operationally resilient.
  2. Base budget: Use your best estimate of realistic revenue growth, historical cost patterns, and known upcoming expenses. This is your primary management tool.
  3. Aggressive budget: Model what happens if sales exceed expectations by 15 to 25%. What resources would you need? Where would you hire? What capital would be required? This scenario guides your upside planning.

Once your scenarios are live, the discipline is in the monthly review. Pull your actual P&L and cash position at the close of every month, compare them line by line to your budget, and document every meaningful difference. This is called variance analysis, and it’s one of the highest-leverage financial habits an SMB owner can build.

CFO insight: Any variance greater than 10% in a key line item deserves a written explanation. Not as punishment, but as a signal. Variances tell you where your assumptions were wrong and where your business is shifting. Ignoring them is the budgeting equivalent of driving with your eyes closed.

When variances consistently trend in one direction, that’s your data telling you to update your projections. Don’t wait until year-end. Update your financial scenario planning quarterly, or faster if the market is moving quickly.

Control costs and build resilience: Overhead, ZBB, and cash reserves

Proactive scenario planning is only effective if you implement robust cost controls and protect your business against the unexpected. Controlling costs doesn’t mean slashing budgets indiscriminately. It means understanding what’s driving your expenses and making intelligent decisions about where to cut, where to protect, and where to invest.

Overhead is your starting point. These are your non-revenue-generating expenses: rent, utilities, administrative salaries, software subscriptions, and insurance. They don’t disappear when sales drop, which makes them the most dangerous line items in a downturn. Using an overhead rate framework helps you benchmark your overhead as a percentage of revenue and identify where you’re overspending relative to your size.
Cost categoryLow overhead (efficient)Average SMBHigh overhead (at-risk)
Overhead as % of revenueUnder 25%30 to 40%Over 50%
Admin salaries as % of revenueUnder 10%12 to 18%Over 20%
Facility costs as % of revenueUnder 5%7 to 12%Over 15%

Zero-based budgeting (ZBB) is a powerful tool, but it’s often misapplied. ZBB for mid-market firms is most effective as a periodic reset, not an annual exercise for every line item. Use it every two to three years, or when entering a new phase of the business. The concept is simple: start every budget from zero and justify each expense from scratch rather than incrementally adjusting last year’s figures. It forces honest conversations about whether each cost is still earning its place.

For cash reserves, recession-proof budgeting guidance consistently recommends holding at least three to six months of operating expenses in liquid reserves. Many SMBs treat reserves as a luxury. Experienced CFOs treat them as non-negotiable. A business with strong reserves can take calculated risks, absorb a down quarter, and negotiate better terms with suppliers.

Cost-cutting priorities:

  • Discretionary subscriptions and services not tied to revenue generation
  • Underutilized office space or facilities
  • Redundant technology tools with overlapping functions
  • Non-strategic contractor relationships that can be paused

Pro Tip: Never cut costs that directly support customer retention, sales capacity, or your core growth engine. Cutting marketing during a slow quarter might feel disciplined but often accelerates the decline. Protect revenue-generating functions at all costs.

Benchmark budgets: Margins and marketing ratios every SMB should know

Once you have control of your costs, measuring success means benchmarking your key financial ratios and investment levels. Without benchmarks, you have no way to know whether your margins are healthy, your spending is calibrated, or your pricing is right.

The three margin metrics every SMB owner must track:

  • Gross margin: Revenue minus cost of goods sold, divided by revenue. This tells you how efficiently your core product or service generates profit before overhead.
  • Operating margin: Profit after all operating expenses, divided by revenue. This is your business efficiency score.
  • Net margin: What’s left after everything, including taxes and interest. This is your actual profitability.

Operating margin benchmarks vary significantly by sector, so comparing yourself to the right industry peer group matters enormously.

IndustryTypical gross marginTypical net margin
Professional services60 to 75%15 to 25%
Retail30 to 50%2 to 6%
SaaS / technology65 to 85%10 to 20%
Manufacturing25 to 40%5 to 12%
Construction20 to 35%3 to 8%

Marketing spend is equally important to benchmark. The SBA guidance of allocating 7 to 8% of gross revenue to marketing applies specifically to businesses under $5 million in annual revenue. For businesses with tighter margins, this may need to scale down. For high-growth companies in competitive markets, it may need to scale up significantly.

What matters more than the exact percentage is the return you get from every marketing dollar. Track customer acquisition cost, lead-to-close rates, and revenue per channel. Your profit margin analysis should inform your marketing budget, not the other way around.

Why most SMB budgeting advice falls short—and what actually works

Most budgeting content for SMBs pushes one of two extremes: oversimplified templates or rigid theoretical frameworks that ignore how messy real business actually is. Neither approach works when you’re managing payroll for 20 people, chasing three overdue invoices, and evaluating a new market at the same time.

The uncomfortable truth is that a static, set-and-forget budget is worse than no budget at all. It creates false confidence. You built the model in December, it felt solid in January, and by March you’re operating in a completely different reality without realizing it. That gap between your budget and reality widens every week you don’t review it.

What genuinely separates high-performing SMBs from the rest is not the sophistication of their initial budget. It’s the discipline of their ongoing review. The businesses we see thrive are the ones that treat their budget as a live decision framework, updated with actual data, challenged monthly, and connected to their real operations. They don’t fear finding out the budget was “wrong.” They expect it. Every variance is information, not failure.

Building this habit requires structure. Monthly financial reviews should be calendar events, not something that happens when there’s time. Your rolling forecast should be updated the moment a major contract closes, a key hire is made, or a significant expense lands. Scenario planning best practices tell us that the businesses that survive economic downturns aren’t the ones with the best original budgets. They’re the ones that spotted the signals early and adapted fast.

Stop trying to build the perfect budget. Start building the habit of using your budget actively. That’s the CFO-level discipline that actually drives growth.

Take the next step: Strategic CFO solutions for better business budgets

If you’ve read this far, you already know more about strategic budgeting than most SMB owners will ever apply. But knowing and doing are two very different things. Building rolling forecasts, running scenario models, tracking monthly variances, and maintaining cash reserves all require time, discipline, and expertise that most business owners simply don’t have on their own.

https://johngalt-finance.com

That’s exactly where outsourced CFO expertise pays for itself. John Galt Finance works with businesses generating $500K to $20 million in revenue, providing the same financial rigor and strategic oversight that larger companies get from full-time CFOs, without the full-time cost. From building your first rolling forecast to establishing expert cash flow guidance tailored to your industry, we deliver financial clarity that supports every major decision you make. When you’re ready to move beyond spreadsheets and start mastering financial KPIs that actually drive growth, we’re built for exactly that.

Frequently asked questions

What is the difference between an annual budget and a rolling forecast?

An annual budget sets fixed targets for the full year, while a rolling forecast is updated regularly to always look forward 12 months, giving you continuous visibility and greater agility to respond to real conditions.

How much cash reserve should my business keep?

Aim to hold cash reserves covering at least three to six months of operating expenses, giving you a meaningful buffer against revenue dips, unexpected costs, or economic volatility.

What expenses should be cut first when revising a business budget?

Start with discretionary costs that don’t impact customer retention, revenue generation, or core operations. Think unused subscriptions, excess facilities, and overlapping tools before touching anything tied to sales or delivery.

How often should I review actuals versus my budget?

Review budget variances monthly, investigating any deviation of 10% or more in a key line item. Monthly reviews let you course-correct before small discrepancies become major financial problems.

What percentage of revenue should go to marketing?

The SBA recommends allocating 7 to 8% of gross revenue to marketing for businesses under $5 million in revenue, though the ideal allocation depends on your margins, growth stage, and competitive landscape.

FAQ

When should I start building next year’s budget?

Start 90 days before fiscal year end. October for calendar-year businesses. This gives time for department input, two revision cycles, and board approval before January. Last-minute budgets in December produce numbers nobody owns.

How often should I update my budget vs forecast?

The budget is locked annually; the forecast updates monthly. Best practice is a rolling 12-month forecast refreshed every month using actuals plus updated assumptions. See our revenue forecasting guide for the mechanics.

What’s a realistic revenue growth assumption for my budget?

Anchor on your trailing 12-month growth rate, then adjust for known wins (signed contracts, new product) and known losses (lost customers, market headwinds). Avoid “hockey stick” budgets that require 2-3x your historical pace without a funded plan to support it.

How do I handle budget variances during the year?

Investigate any line item more than 5% off budget for two consecutive months. Material variances trigger one of three actions: reforecast, reallocate (cut elsewhere), or accept and document. Don’t quietly absorb variances; they compound.

Should I budget by department or by initiative?

Both. Departmental budgets ensure accountability; initiative budgets (campaigns, product launches, capex) ensure ROI tracking. For SMBs under $5M revenue, a simple P&L by department plus a separate initiative tracker is enough. Larger SMBs benefit from zero-based budgeting on G&A every 2-3 years.

Share this:

The Ultimate Financial Risk Assessment Checklist for SMBs

Financial Risk Assessment Benchmarks

MetricBenchmark
SMBs that have done a formal risk assessment~30% (NFIB survey)
Recommended cash reserve3-6 months of operating expenses
Customer concentration warning threshold>15% of revenue from single customer
Supplier concentration warning threshold>30% of COGS from single supplier
Current ratio (healthy)1.5-3.0
Debt service coverage ratio (banks require)>1.25
Cyber insurance cost (SMB)$1,500-$7,500/year
SMBs that close within 6 months of a major cyber incident60% (US National Cyber Security Alliance)

Even profitable businesses can be blindsided by financial threats they never saw coming. A sudden customer default, a currency swing, or a cash flow gap can unravel months of hard work in a matter of weeks. Research shows that many SMBs lost emergency reserves to unexpected risks, with one in five facing genuine financial shock risk at any given time. This checklist gives you a CFO-level framework to identify, measure, respond to, and monitor the risks that could derail your business before they ever get the chance to.


Table of Contents

Key Takeaways

PointDetails
Follow a proven processUse a 4-step risk assessment with regular reviews to reduce hidden vulnerabilities.
Identify and prioritize risksPinpoint liquidity, credit, market, and operational risks—prioritize those with outsized business impact.
Use practical toolsSimple risk matrices and dashboards are effective for SMEs, so long as monitoring is consistent.
Respond and adaptMitigation actions should be tied to your most critical risks and evolve with quarterly updates.
Don’t ignore edge casesHigh customer concentration or mismatched payment terms can quickly turn from minor to catastrophic without proactive attention.

The CFO-approved 4-step financial risk assessment process

Every solid risk management system follows the same basic architecture: identify, assess, respond, and monitor. This is not a one-time exercise. It is a repeatable, living process that grows sharper each time you run it. Understanding this structure first makes every checklist item below far more actionable.

The standard 4-step process for SMEs breaks down as follows:

  1. Identify all relevant financial risks across your business.
  2. Assess the likelihood and impact of each risk using both numbers and judgment.
  3. Respond by designing targeted mitigation strategies for each priority risk.
  4. Monitor using dashboards, key risk indicators (KRIs), and regular reviews.

Before you can use this checklist effectively, you also need to know the four core risk categories that most SMBs face. Liquidity risk means you cannot meet short-term obligations because cash is tight. Credit risk involves customers or counterparties failing to pay what they owe. Market risk includes interest rate swings, foreign exchange moves, and commodity price volatility. Operational risk covers internal failures: fraud, process breakdowns, and technology failures.

Process stepCore question to askSample action
IdentifyWhat could go wrong financially?Map all cash inflows, debts, and exposures
AssessHow likely and how bad?Score risks on a 1-5 impact and likelihood scale
RespondWhat will we do about it?Assign owners and specific mitigation actions
MonitorIs it getting better or worse?Track KRIs monthly; review full register quarterly

Strong SME financial management steps always link this process to real numbers inside your business rather than generic benchmarks. Following strategic finance best practices means treating this framework as a core business rhythm, not a compliance task.

“Running a quarterly risk review is not a sign of paranoia. It is the single most reliable way to catch a small problem before it becomes a large one. Most businesses that fail were not blindsided by a brand-new risk. They just stopped paying attention to one they already knew about.”

Tracking essential SMB financial metrics at each stage keeps the process grounded in data rather than gut feeling.


Checklist item 1: Pinpoint your core financial risks

With the framework in place, the first real task is building an honest inventory of every significant financial risk your business carries. Most owners underestimate how many there are because they focus only on the most obvious ones.

Here is a working breakdown of the four categories and what they look like in practice:

  • Liquidity risk: You have receivables on paper but no cash in the account when payroll or rent is due. Seasonal businesses and fast-growing companies face this most often.
  • Credit risk: A major customer pays late, pays partially, or stops paying entirely. If you sell on credit terms, this risk is always present.
  • Market risk: A rise in interest rates increases the cost of your variable-rate business loan. A strengthening dollar cuts into revenue from overseas clients. Commodity prices push up your cost of goods.
  • Operational risk: A bookkeeper makes unauthorized transfers. A manual invoicing error creates a $40,000 shortfall. A key supplier fails without notice.

One of the most dangerous and commonly overlooked edge cases is customer concentration risk. Imagine a manufacturing business with five clients, where the largest one accounts for 38% of annual revenue. That single relationship is not just a revenue driver. It is a loaded financial risk sitting at the top of the balance sheet. If that client renegotiates terms, delays payment, or walks, the impact is immediate and severe. This scenario is more common than most business owners want to admit.

Knowing how to address business financial risk mitigation systematically means looking at every client, supplier, and market exposure with the same critical eye.

Businesswoman checks customer list in office

Pro Tip: If any single customer contributes more than 30% of your total revenue, treat that as a high-priority risk right now. Start diversifying your client pipeline before it becomes a crisis. The best time to act on concentration risk is when business is strong, not after that client starts showing signs of trouble.


Checklist item 2: Assess impact, likelihood, and business vulnerability

Once you know what your risks are, the next step is to triage them. Not all risks deserve equal attention or resources. The goal is to separate the genuinely dangerous ones from the background noise.

Here is a simple numbered exercise to score each identified risk:

  1. List every risk from your identification step.
  2. Rate the likelihood it will occur in the next 12 months on a scale of 1 (very unlikely) to 5 (almost certain).
  3. Rate the impact if it does occur, from 1 (minor inconvenience) to 5 (business-threatening).
  4. Multiply the two scores to get a risk priority number.
  5. Focus your time and money on anything scoring 12 or above.

For context on what tools professionals use to do this at scale, key risk assessment methodologies include Value at Risk (VaR), Expected Credit Loss (ECL), stress testing, risk matrices, and KRI dashboards aligned to frameworks like ISO 31000 and COSO ERM. You do not need all of these as a small business. But knowing they exist helps you understand what your accountant or CFO advisor should be doing on your behalf.

ApproachBest forComplexityCost
Risk matrix (2×2 or 5×5)Most SMBsLowNear zero
Scenario analysisBusinesses with seasonal or project-based cash flowsMediumLow
Stress testingDebt-heavy or fast-growing companiesMedium-HighModerate
VaR modelingBusinesses with significant market exposureHighHigh
KRI dashboardAny business with ongoing monitoring needsMediumLow-Moderate

The most actionable insight from quantitative analysis: watch your current ratio and return on equity (ROE) closely. Financial distress research shows that a current ratio below 1.2 or an ROE below 5% predicts financial distress with high accuracy. These are not arbitrary thresholds. They represent real tipping points where the margin for error effectively disappears.

Qualitative assessment matters just as much. Management depth, leadership succession, team skill concentration, and vendor relationship quality all affect your true risk exposure. A business with strong financials but a single founder who holds all client relationships is still carrying significant hidden risk.

Use business stress-testing to model what happens to your numbers under pressure. Combine that with regular tracking of key SMB metrics to build a full picture of where you are most exposed.


Checklist item 3: Action steps and response planning

Identifying and scoring risks is valuable. But it only creates value when it drives action. Response planning is where risk assessment turns into risk management. And there are really only four choices for how to respond to any identified risk.

The four core response strategies:

  • Avoid: Stop doing the activity that creates the risk entirely. If a specific product line generates unpredictable liability with thin margins, discontinuing it removes the risk at the source.
  • Mitigate: Reduce the likelihood or impact of the risk through controls, processes, or financial tools. Tightening your accounts receivable process, requiring deposits, or adding insurance coverage all fall here.
  • Share: Transfer part of the risk to another party. Trade credit insurance, performance bonds, or strategic partnerships can all shift exposure away from your business.
  • Accept: Acknowledge the risk exists and decide to live with it, either because the cost of mitigation outweighs the expected loss or because it is genuinely low priority.

Effective financial risk response for SMBs means building a specific checklist of actions tied to each top risk. Here are examples of what that looks like in practice:

  • Cash flow risk: Implement a 13-week rolling cash flow forecast. Set a minimum cash reserve threshold and trigger automatic review if you fall below it.
  • Accounts receivable risk: Require 30-day payment terms on all new contracts. Flag any invoice past 21 days for immediate follow-up. Consider invoice factoring for clients with poor payment history.
  • Supplier risk: Identify backup suppliers for your top three inputs before you need them. Review supplier financial health annually.
  • Debt covenant risk: Map all financial covenants in your loan agreements against your current ratios quarterly. Engage your lender proactively if you are tracking toward a breach.
  • Fraud and operational risk: Implement segregation of duties for any function involving cash, payments, or inventory. Require dual approval for transfers above a defined threshold.

Following a focused SMB financial planning guide makes it easier to connect each action to your broader business goals rather than treating risk management as a standalone bureaucratic exercise.

Pro Tip: Do not treat response plans as a one-and-done document. Assign an owner to each action, set a due date, and review progress at your quarterly risk meeting. A mitigation that was appropriate six months ago may be obsolete today if your business has changed.


Checklist item 4: Monitor, review, and stress test for hidden threats

The most common failure in risk management is doing the work once and then forgetting about it. Markets shift. Customers change. Debt matures. What was a low-priority risk in January can become a crisis by September if no one is watching. This final step is what separates businesses that manage risk from those that simply document it.

Here is a practical numbered monitoring checklist to run every quarter:

  1. Update your risk register with any new risks that have emerged.
  2. Re-score existing risks to check if likelihood or impact has changed.
  3. Review KRI dashboard metrics against your defined thresholds.
  4. Run at least one stress test scenario against your current cash position.
  5. Check that all assigned mitigation actions are on track.
  6. Report findings to leadership and adjust the response plan if needed.

Building a KRI dashboard does not require expensive software. A well-structured spreadsheet updated monthly is enough to catch most problems early. Here is what to track:

KRI metricWarning thresholdAction trigger
Current ratioBelow 1.5Investigate below 1.2
Days Sales Outstanding (DSO)Above 40 daysReview AR process above 55 days
Cash runwayBelow 90 daysInitiate cost review below 60 days
Customer concentration (top client)Above 25% of revenueDiversification plan above 30%
Gross marginBelow prior quarterInvestigate cost drivers immediately
Debt service coverage ratioBelow 1.3xEngage lender proactively below 1.1x

Quarterly stress tests of extreme scenarios, like a 40% revenue drop in a single quarter or a sudden interest rate spike, sound alarmist until the day they happen. Then they sound like the smartest thing you ever did.

“The businesses that survive genuine financial shocks are almost never the ones with the most cash. They are the ones that already know exactly what they will do when something unexpected hits.”

Tracking all of this through consistent financial dashboards gives leadership real-time visibility into where the business stands. Running regular scenario planning exercises closes the loop by turning monitoring data into forward-looking decisions.


Our perspective: risk management is not about fear, it is about optionality

Most business owners treat financial risk management as a defensive exercise. Something you do to avoid disaster. That framing is understandable, but it misses the bigger picture.

The real value of a well-run risk assessment process is not just that it prevents bad outcomes. It is that it creates the confidence and clarity to make bolder decisions. When you know exactly where your vulnerabilities are and you have plans in place to handle them, you stop second-guessing every strategic move. You can pursue a new contract, take on debt for growth, or enter a new market because you have already thought through the downside.

We have seen this pattern play out consistently with SMBs that treat CFO-level risk work as a growth tool rather than a compliance checkbox. The businesses that move fastest are not the ones ignoring risk. They are the ones managing it well enough to act decisively when the opportunity shows up.

The uncomfortable truth is that most SMBs do not have a risk problem. They have a visibility problem. The risks are already there. They just have not been written down, scored, or assigned to anyone. Fixing that is simpler than most owners expect, and the payoff is immediate.


How John Galt Finance helps you take control of financial risk

Managing financial risk at a CFO level requires consistent attention, the right frameworks, and someone who knows what warning signs actually look like in a real business.

https://johngalt-finance.com

At John Galt Finance, we work with SMBs generating between $500K and $20 million in revenue to build exactly this kind of financial clarity. From financial risk assessments and stress testing to ongoing CFO support and financial modeling, we give your business the financial infrastructure that used to require a full-time hire. If you are ready to stop guessing where your risks are and start managing them with confidence, our team is ready to show you exactly what that looks like for your specific situation.


Frequently asked questions

What are the most common financial risks for SMEs?

Liquidity, credit, market, and operational risks are the four primary categories, covering everything from cash shortfalls and customer defaults to interest rate exposure and internal fraud.

How often should a financial risk assessment be performed?

A quarterly review cycle is the recommended minimum to keep your risk register current and ensure mitigation actions are actually working.

What signals indicate financial distress in a business?

A current ratio below 1.2 or ROE below 5% are two of the most reliable quantitative warning signs that a business is under serious financial strain.

Do small businesses need complex models to assess risk?

No. Simple risk matrices and scenario analysis are sufficient for most SMBs, as long as the process is repeated consistently and not treated as a one-time task.

How should a business respond to high customer concentration risk?

Actively diversify your client pipeline and build contingency plans if any single client exceeds 20-30% of revenue, treating it as a high-priority risk until exposure is reduced.

FAQ

How often should I run a financial risk assessment?

At minimum annually, before budget season. Run an interim assessment any time you have a major change: new product line, large customer win or loss, acquisition, debt refinancing, or macro shock (recession, interest rate change). Most SMBs are over-confident on liquidity and under-confident on customer concentration.

What’s the single biggest financial risk for SMBs?

Customer concentration. If one customer is over 25% of revenue, you don’t own a business; you own a contract. The second biggest is cash flow timing, often masked by profitability. See our article on why profitable businesses go broke.

How much cash should I keep in reserve?

3-6 months of operating expenses for a stable SMB; 6-12 months if revenue is concentrated, seasonal, or project-based. Hold reserves in a high-yield business savings account or short-duration Treasury fund (currently 4-5% yield) so they earn while sitting.

What financial controls reduce fraud risk?

Five essentials: (1) segregation of duties, (2) dual approval on payments over a threshold, (3) monthly bank reconciliations reviewed by someone outside AP, (4) annual review of vendor master list, (5) mandatory vacation for finance staff. See our financial controls guide for implementation.

Should I buy business interruption insurance?

Yes if your business has physical operations or single-site dependency. Premiums run 0.5-2% of insured revenue. The often-overlooked add-on is contingent business interruption (covering supplier or customer disruptions), which paid out heavily during 2020-2021 supply chain shocks.

Share this:

Manage cash reserves like a CFO: Step-by-step guide for SMBs

Cash Reserve Management Benchmarks

MetricBenchmark
Recommended operating reserve3-6 months of opex
Recommended reserve for seasonal/project businesses6-12 months
SMBs with less than 1 month cash reserve~50% (JPMorgan Chase Institute)
Median SMB cash buffer days27 days
High-yield business savings yield (2026)4.0-5.0% APY
Treasury bill yield (4-week, 2026)4.5-5.3%
FDIC insurance limit per bank, per ownership category$250,000
Recommended bank diversification at $1M+ reserves2-3 institutions

Most small and medium-sized businesses are operating far closer to the financial edge than their owners realize. Only 28% of small businesses have three or more months of cash reserves, which means the overwhelming majority are one bad quarter, one large unexpected expense, or one slow season away from a genuine crisis. This guide gives you the same framework a CFO would use to build, position, and actively manage your cash reserves so your business stays stable, stays funded, and stays ready to grow.


Table of Contents

Key Takeaways

PointDetails
Set 90-day operating cash minimumMaintaining at least 90 days of reserves is vital for weathering unexpected shortfalls.
Diversify reserve holdingsKeep cash in a mix of high-yield and liquid accounts to maximize earnings and access.
Monitor reserves with key metricsTrack Days Cash on Hand and related metrics every quarter for continuous financial health.
Adjust strategies as your business growsReview and right-size your reserve policies as revenue streams stabilize or new risks emerge.
Leverage forecasting for growthUse forecasting and scenario planning to manage reserves proactively and unlock new opportunities.

Why managing cash reserves matters for SMBs

Cash reserves are not the same as profit. They are the readily available funds your business can access immediately to cover operating expenses without taking on debt, delaying payroll, or missing vendor payments. Think of them as the oxygen supply for your operations. You don’t think about them until they’re running low, and by then you’re already in trouble.

The numbers are sobering. Average SMB cash reserves sit at just 27 days, while best-in-class businesses maintain 90 or more days of runway. Financial experts recommend that micro and small businesses target three to six months of operating costs held in liquid form. That’s not a conservative suggestion. It’s the floor.

Reserve levelDays cash on handRisk profile
DangerousUnder 30 daysHigh likelihood of disruption
Marginal30 to 60 daysVulnerable to seasonal shifts
Stable60 to 90 daysAdequate buffer for most events
Best-in-class90+ daysPositioned for stability and growth

Why does this matter so much for SMBs specifically? Because larger businesses have easier access to credit lines, investor capital, and institutional relationships that smooth out cash gaps. You don’t always have those same options on short notice. Your reserves are your credit line. And building them properly requires a deliberate, CFO-level approach.

Key reasons cash reserves protect your business:

  • They cover payroll, rent, and fixed costs during revenue dips
  • They allow you to negotiate better payment terms with suppliers (paying on time or early earns discounts)
  • They prevent panic-driven decisions like taking high-cost emergency loans
  • They signal financial credibility to lenders and potential investors

That said, idle cash carries real opportunity costs. Money sitting in a non-interest-bearing account is silently losing value to inflation. The goal, as outlined in cash flow management tips for growing businesses, is not to hoard but to optimize. More on that in a moment.

“A liquidity buffer isn’t just a safety net. It’s a strategic asset that gives you freedom to act, not just survive.” That’s the mindset that separates reactive SMBs from proactive ones.

The key financial metrics for SMBs you need to track begin with Days Cash on Hand (DCOH). This is calculated by dividing your available cash by your average daily operating expenses. If that number is below 60, your first priority is to build it up before anything else.


Setting the right cash reserve target for your business

Not every business needs the same cushion. Your optimal reserve level depends on three factors: industry volatility, business size and stage, and seasonal revenue patterns. A construction firm with irregular contract revenue needs a different buffer than a SaaS company with predictable monthly subscriptions.

Here’s a practical three-bucket framework used at the CFO level:

  1. Operating minimum (90 days): Non-negotiable. This is your baseline survival fund. Every business should build toward this before tackling anything else.
  2. Stability buffer (up to 180 days): Appropriate for businesses in volatile industries, those with irregular receivables, or companies going through rapid change such as hiring surges or product launches.
  3. Growth pool (beyond 180 days): Excess cash beyond your stability buffer that should be actively reinvested rather than left idle. Options include equipment upgrades, market expansion, or paying down high-cost debt.

For seasonal businesses, this framework is especially critical. 82% of business failures trace back to cash flow problems, and seasonal SMBs are disproportionately at risk if they don’t budget peak-season surpluses to fund slow periods. A summer-focused retail business that spends all its August profits on inventory by October is gambling on a perfect Q4.

ApproachReserve targetBest suited for
Conservative150 to 180+ daysVolatile industry, irregular revenue
Balanced90 to 120 daysStable sector, predictable cash flows
Dynamic60 to 90 days + active reinvestmentHigh-growth stage, strong credit access

Conservative reserves of 180+ days make sense for industries where revenue is unpredictable, but they do signal idle capital if held too long without strategy. The dynamic approach reinvests excess for growth while protecting that essential 90-day core. Neither approach is wrong. The mistake is picking one and never revisiting it.

Pro Tip: Set a specific dollar amount as your reserve floor, not just a percentage. If your monthly operating costs are $80,000, your 90-day target is $240,000. Write that number down. Make it visible. It becomes your financial north star.

As part of your strategic finance for SMBs planning, revisit your reserve targets every time a significant change happens in your business: a new major client, a lost contract, a new hire, a market shift. Your cash needs in year three look nothing like they did in year one.


Where to hold and optimize cash reserves

Once you know how much to hold, the next question is where. Keeping everything in your operating checking account is like storing your emergency fund under the mattress. Safe? Maybe. Smart? No.

Entrepreneur opens business savings account at bank

A tiered approach is the CFO standard. Operational reserves belong in high-yield savings accounts or short-term Treasury bills, with excess swept into money market accounts that offer both liquidity and yield. This structure means your cash is working harder without sacrificing access when you need it.

Best practices for holding your reserves:

  • Tier 1 (immediate access, 30 days of expenses): Business checking or high-yield savings account at an FDIC-insured institution
  • Tier 2 (short-term yield, 30 to 90 days): High-yield savings, Treasury bills with 90-day maturities, or government money market funds
  • Tier 3 (medium-term, 90 to 180 days): Short-duration bond funds, CDs with early withdrawal options, or sweep accounts

Diversification across institutions also matters. FDIC coverage caps at $250,000 per depositor per institution. If your reserves exceed that, split them across multiple banks rather than leaving yourself partially unprotected.

As part of your working capital optimization strategy, review your holding structure quarterly. Interest rate environments change, and what earned you a solid yield last year may be underperforming today. Don’t set it and forget it.

Pro Tip: Automate a monthly sweep from your operating account to your Tier 2 reserve account. Even a small, consistent transfer builds the habit and the balance simultaneously.


Monitoring, managing, and mobilizing your reserve

Having a reserve is not enough. You need a system for monitoring it, clear rules for deploying it, and a process for replenishing it after you do.

Start by assigning ownership. Appointing a dedicated working capital leader inside your business, whether that’s your controller, your CFO, or an outsourced finance partner, ensures this doesn’t fall through the cracks. Whoever owns cash management should be tracking more than just the bank balance. They need to watch granular metrics like WADC (Weighted Average Days Cash) and WAT (Working Asset Turnover), not just the standard DSO, DPO, and DIO ratios.

The sobering reality: US SMBs with revenues under $300 million carry an average Cash Conversion Cycle of 120 days, and small firms hold 20 to 30% more cash than they need due to poor visibility into their own financials. That excess cash isn’t protecting you. It’s a sign your reporting isn’t sharp enough.

A simple reserve monitoring process:

  1. Calculate DCOH weekly during volatile periods, monthly during stable ones
  2. Set a trigger point (e.g., DCOH drops below 60) that automatically prompts a financial review
  3. Track your Cash Conversion Cycle monthly to spot collection or payment delays early
  4. Create a “reserve health dashboard” with three metrics: current DCOH, target DCOH, and variance
  5. Review your replenishment plan if reserves are deployed, with a clear timeline to rebuild

When should you deploy reserves? Three legitimate triggers exist: a planned seasonal slowdown you’ve modeled in advance, an unexpected but essential expense (equipment failure, legal costs), or a defined growth opportunity with measurable ROI. Emotional decisions (“things feel tight”) are not a deployment trigger. That’s what the system protects you against.

“The moment your cash reserve feels optional is the moment you’ve already lost control of your financial posture.”

The working capital management system you build now creates the habits that keep you solvent when others in your industry are scrambling.


Infographic showing cash reserve management steps

CFO-level tips: Advanced moves and common mistakes

Once your foundation is solid, advanced strategies can meaningfully improve both the size of your reserves and the speed at which you build them.

Instant payments accelerate inflows and reduce SMB reliance on credit lines, with many high-urgency businesses now willing to pay small fees to access funds immediately rather than waiting standard settlement times. If your business regularly waits two to five days for payments to clear, instant payment rails can functionally add days to your cash on hand without changing your reserve balance at all.

Advanced CFO strategies for reserve optimization:

  • Build rolling cash flow forecasting models covering three to twelve months across base, upside, and downside scenarios
  • Incentivize early accounts receivable payments with 1 to 2% early payment discounts. These are far cheaper than the cost of borrowing if you run short
  • Negotiate extended payment terms with key vendors, especially on non-time-sensitive orders
  • Audit your AP and AR cycles quarterly to find hidden cash sitting in delays
  • Use scenario planning to stress-test what happens if your top client delays payment by 60 days or if a key cost doubles

The most common mistakes we see, outlined in detailed steps to improve cash flow, are over-optimism on receivables, no formal cash review schedule, and treating reserves as a slush fund rather than a protected asset class.

Pro Tip: Create a “cash reserve policy” document, even a one-pager, that defines your target DCOH, your holding structure, your deployment triggers, and your replenishment timeline. Share it with anyone who touches your finances. Clarity prevents costly improvisation.


Where most SMBs go wrong—and how to outsmart the average

Here’s the uncomfortable truth: most advice about cash reserves treats the target as a fixed destination. “Build three to six months and you’re done.” That framing is wrong, and it leads smart business owners to make expensive mistakes in both directions.

Small firms actually hold proportionally higher cash in their early years but reduce reserves as they grow and their cash flows become more predictable. That’s not irrational. It reflects improving operational maturity and better visibility. The problem is when businesses don’t consciously manage that evolution. They either hold too much (missing reinvestment opportunities) or too little (walking into a liquidity crisis).

The best-run SMBs we’ve worked with treat their cash reserve target the way a pilot treats altitude. Not as a destination but as a constantly adjusted variable based on current conditions, upcoming turbulence, and where they’re trying to land. They review their models quarterly, they update their scenarios when conditions shift, and they never confuse “we haven’t needed our reserves yet” with “we don’t need reserves.”

Over-hoarding is just as dangerous as under-saving. Cash sitting idle at 2% in a savings account while your business could earn 20% ROI on a well-priced equipment investment isn’t safety. It’s avoidance. Meanwhile, businesses that chase every growth opportunity without protecting their operational minimum end up borrowing at 15 to 30% interest to cover gaps that $40,000 in reserves would have prevented entirely. Neither extreme reflects disciplined financial leadership.

The benchmark for great is not a number. It’s a system. Build the model, set the targets, review them regularly, and adjust based on real data from your finance best practices perspective. That’s what separates the 28% with strong reserves from the rest.


Ready to optimize your cash reserves? Partner with pro-level finance solutions

Managing cash reserves with precision isn’t something that happens by accident. It requires the right model, the right metrics, and the right guidance applied specifically to your business.

https://johngalt-finance.com

At John Galt Finance, we specialize in giving SMBs access to exactly this kind of expertise without the cost of a full-time CFO. Our team builds custom financial planning for business models that show you exactly where your reserves stand today and what they need to look like six to twelve months from now. We pair that with hands-on cash flow forecasting solutions and scenario planning so you’re never caught off guard. Whether you’re building your first formal reserve strategy or optimizing an existing one, our strategic finance growth guide resources and advisory team are ready to help you move from reactive to fully in control.


Frequently asked questions

How often should a small business review its cash reserves?

You should review cash reserves at least quarterly, or more frequently if your business is in a high-growth phase, navigating a downturn, or experiencing significant seasonal swings in revenue.

Is it better to keep all reserves in one account for simplicity?

No. Diversifying across tiered accounts, including high-yield savings and short-term instruments, balances yield, risk, and accessibility far better than a single account can.

What’s the biggest mistake SMBs make with cash reserves?

The most common mistake is holding too little cash as a buffer, with only 28% of small businesses maintaining three or more months of reserves, leaving most businesses dangerously exposed to even moderate disruptions.

How do instant payments affect reserve management?

Instant payments accelerate inflows and reduce dependence on credit lines, effectively improving liquidity without requiring you to hold a larger cash balance.

What metrics should I monitor for optimal reserve management?

Track Days Cash on Hand, Cash Conversion Cycle, and early warning indicators like rising DSO or falling collections rates. Dedicated working capital metrics such as WADC and WAT give you sharper visibility than basic ratios alone.

FAQ

How much cash should my business actually keep on hand?

Calculate average monthly operating expenses, then multiply by 3-6 for a stable business or 6-12 for a seasonal, project-based, or customer-concentrated one. If you have debt service, add one quarter’s principal-and-interest payments on top of that baseline.

Where should I park business cash reserves?

Tiered approach: 1 month opex in operating checking, next 2-3 months in a high-yield business savings (currently 4-5% APY), beyond that in laddered Treasury bills (4-week to 13-week). Avoid CDs longer than 6 months; the liquidity penalty rarely justifies the marginal yield.

What’s the risk of keeping all cash in one bank?

FDIC insurance covers $250k per ownership category per bank. After Silicon Valley Bank in 2023, treasury teams routinely spread reserves across 2-3 banks once balances exceed $500k. ICS (Insured Cash Sweep) accounts can extend coverage to millions in one operational account.

How do I build cash reserves without slowing growth?

Three levers: (1) tighten DSO by 5-10 days through better collections, (2) negotiate longer DPO with key suppliers, (3) automatically sweep 5-10% of monthly revenue into a reserve account. See our working capital optimization guide for the mechanics.

When can I distribute excess cash to owners?

After meeting three tests: (1) cash reserve target hit, (2) debt covenants comfortably met, (3) next 12 months of planned capex funded. Distributions ahead of these tests are the #1 reason “profitable” SMBs hit liquidity crises in downturns.

Share this:

Financial analysis for SMBs: unlock real growth

Financial Analysis Benchmarks for SMBs

MetricBenchmark
Gross margin (B2B services SMB)40-60%
Gross margin (SaaS)70-85% (Bessemer)
EBITDA margin (mature SMB)10-20%
Current ratio (healthy)1.5-3.0
Quick ratio (healthy)>1.0
Debt-to-equity ratio (healthy SMB)<2.0
Return on equity (top quartile SMB)>15%
Revenue per FTE (services SMB)$150,000-$300,000

Your income statement and balance sheet tell you what happened. They don’t tell you why it happened, what’s coming next, or what you should do about it. Too many small and medium-sized business (SMB) owners mistake financial reporting for financial analysis, and that gap costs them real money. Financial analysis in SMBs involves systematic examination of financial statements to enable data-driven decisions for growth and stability. This guide breaks down the key techniques, benchmarks, and real-world results that separate businesses that react from businesses that grow.

Table of Contents

Key Takeaways

PointDetails
Beyond basic reportsTrue financial health requires analysis, not just tracking revenue or expenses.
Context is criticalInterpreting ratios properly means comparing trends and benchmarks for your industry.
Expert help drives resultsOutsourced CFOs and financial pros can close knowledge gaps and enable smarter decisions.
Benchmarks are guidelinesFinancial benchmarks vary by sector and should not be applied without context.
Analysis powers growthApplying robust financial analysis strategies directly supports SMB growth and resilience.

Why financial analysis matters for SMBs

Most SMB owners look at their financials once a month, scan the bottom line, and move on. That’s reporting. Analysis is something entirely different.

Financial reporting organizes your numbers. Financial analysis interrogates them. It asks: Is your gross margin shrinking quarter over quarter? Are customers paying slower than last year? Is your cash position healthy enough to survive a 90-day revenue dip? SMBs that systematically examine income statements, balance sheets, and cash flow statements to evaluate profitability, liquidity, financial health, and operational efficiency are the ones that catch problems early and capitalize on opportunities faster.

The business outcomes are concrete:

  • Better decisions: You stop guessing and start acting on evidence
  • Faster growth: You identify which products, customers, or channels drive real margin
  • Greater resilience: You build cash buffers before you need them, not after
  • Stronger investor confidence: Lenders and investors trust businesses that understand their own numbers

“Gut instinct built your business. Data will scale it. The owners who combine both are the ones who survive economic downturns and come out stronger.”

The risk of skipping analysis is real. A business running on gut instinct might feel profitable while quietly bleeding cash. Inventory builds up. Receivables age. Margins erode by two points per quarter. None of that shows up as an alarm on a basic P&L. That’s exactly why understanding the need for CFO services is growing among SMBs that want to compete seriously.

Core financial analysis methodologies every SMB should use

Business owner checking printed financial statements

There are four core methodologies every SMB owner should know and apply regularly. Each one answers a different question about your business.

Ratio analysis measures relationships between line items. Your current ratio (current assets divided by current liabilities) tells you whether you can pay short-term bills. Your gross margin ratio tells you how efficiently you convert revenue into profit before overhead. Key methodologies include ratio analysis covering current ratio, quick ratio, debt-to-equity, gross margin, return on equity (ROE), and return on assets (ROA), alongside trend analysis, variance analysis, flux analysis, and benchmarking against industry standards.

Trend analysis tracks the same metric over multiple periods. A gross margin of 38% looks fine in isolation. A gross margin that has dropped from 44% to 38% over six quarters tells a completely different story about pricing pressure or rising input costs.

Infographic showing key SMB financial analysis methods

Variance analysis compares actual results to your budget or forecast. If you budgeted $180,000 in revenue for Q2 but only hit $152,000, variance analysis forces you to explain the gap. Was it one lost client? A delayed project? A pricing issue? Without this discipline, the same miss happens again next quarter.

Benchmarking compares your metrics against industry standards or competitors. It answers the question: Is our performance normal, or are we leaving money on the table?

MethodologyWhat it answersHow often to run
Ratio analysisAre we financially healthy right now?Monthly
Trend analysisAre we improving or declining over time?Quarterly
Variance analysisAre we hitting our plan?Monthly
BenchmarkingHow do we compare to our industry?Annually or semi-annually

A common SMB pitfall is relying on a single ratio from a single year and drawing big conclusions. One good current ratio doesn’t mean you’re liquid. One strong revenue quarter doesn’t mean your business model is working. Context is everything. Always layer your SMB financial metrics across time periods and industry comparisons before making strategic moves.

Pro Tip: Run a simple actual vs. budget variance report every month. Even a basic spreadsheet that flags line items more than 10% off budget will surface issues before they become crises.

Benchmarks and what “good” looks like: decoding industry standards

Benchmarks are useful reference points, not gospel. Understanding what typical SMB numbers look like gives you a starting point for interpretation, but your industry, business model, and growth stage all change what “healthy” actually means for your company.

Here’s a snapshot of common SMB financial benchmarks to use as a baseline:

MetricSMB benchmarkWhat it signals
Finance function cost1.2% to 3.5% of revenueOverhead efficiency
Current ratio (EU SME avg)1.28Short-term liquidity
Quick ratio0.84Immediate liquidity without inventory
Gross margin32%Core profitability before overhead
Net profit margin2.8%Bottom-line efficiency
Days Sales Outstanding (DSO)48 daysReceivables collection speed

These benchmark figures for SMBs cover finance function costs, current ratio, quick ratio, gross margin, net profit margin, and DSO, giving owners a concrete starting point for comparison.

But here’s where most business owners go wrong: they see a quick ratio of 0.84 and assume they’re fine because it’s “average.” Average in a sector with predictable monthly contracts looks very different from average in a project-based business where revenue arrives in lumps. A software-as-a-service company with 0.84 might be perfectly healthy. A construction firm with the same number might be one delayed payment away from a payroll crisis.

Key things to watch when interpreting benchmarks:

  • Your cash conversion cycle: How long does it take to turn inventory or services into cash? A longer cycle demands a higher current ratio buffer.
  • Seasonality: A retailer’s quick ratio in January looks terrible compared to December. That’s normal.
  • Growth stage: Fast-growing businesses often have thinner margins and tighter ratios because they’re reinvesting aggressively.
  • Customer concentration: If 40% of your revenue comes from one client, your financial risk profile is very different from a business with 200 small customers.

Single metrics lack context, so always use trend analysis and industry-specific benchmarks together to avoid misinterpretation. Tracking your own trends over 12 to 24 months is often more revealing than any external benchmark. Understanding how to interpret these numbers is core to mastering financial KPIs that actually drive business decisions.

How financial analysis drives real SMB results

Theory is useful. Numbers that change real businesses are better. Here’s what happens when SMBs move from basic reporting to genuine financial analysis.

  1. A $12M manufacturer improved cash runway by 73%. By analyzing their working capital cycle and identifying where cash was trapped in inventory and slow receivables, they restructured payment terms with both suppliers and customers. The result: 73% improvement in cash runway, 18% reduction in customer acquisition cost, and a 7-point improvement in payroll efficiency. None of that was visible on a standard monthly P&L.
  2. A fractional CFO saved $2M in cash and grew margins by 15%. An SMB brought in outsourced CFO support after struggling to understand why revenue was growing but cash wasn’t. The analysis revealed a mismatch between billing cycles and expense timing, plus a product line with negative contribution margin that was masked by overall revenue growth. Fixing both saved $2M in cash and drove a 15-point margin improvement.
  3. A loss-making business turned a 9% profit margin. Through detailed variance and segment analysis, a services business discovered that two client types were profitable and three were actively destroying margin. Refocusing on the right clients and repricing the rest turned losses into a 9% profit margin.

These aren’t outliers. They’re what happens when analysis replaces assumption.

The trigger for bringing in outside expertise is usually one of these situations:

  • Revenue is growing but cash is always tight
  • Margins feel inconsistent and you can’t explain why
  • You’re preparing for a funding round or acquisition
  • Your bookkeeper gives you reports but no interpretation
  • You’ve had one or two financial surprises that cost you badly

SMBs are often overconfident in their financial preparedness despite thin reserves, and outsourcing bridges the expertise gap for growth-stage firms that can’t justify a full-time CFO salary. A fractional CFO guide can help you understand exactly what that support looks like in practice, and how businesses use it to solve cash flow management struggles before they become emergencies.

Pro Tip: If you’ve had even one financial surprise in the past 12 months that you didn’t see coming, that’s your signal. A single blind spot in your analysis can cost more than a year of outsourced CFO fees.

Why most SMB financial analysis falls short—and how to do better

Here’s the uncomfortable truth we see repeatedly: most SMB financial analysis is backward-looking, infrequent, and siloed. Business owners review last quarter’s numbers, feel relieved or worried, and then go back to running the business. Nothing changes. The same surprises repeat.

The core problem is that looking at last quarter’s numbers alone guarantees surprises in tough times. Markets shift. Customer behavior changes. Input costs move. A quarterly review that only looks backward gives you a 90-day lag before you can react. By then, the damage is already done.

What actually works is building a monthly rhythm of three specific habits. First, run a variance review every single month. Compare actuals to budget line by line and force yourself to explain every variance over 10%. This builds pattern recognition faster than any financial course. Second, track five to seven core ratios on a rolling 12-month basis. Seeing a trend develop over eight months is far more valuable than a snapshot. Third, benchmark against your own prior periods before you benchmark against industry averages. Your business is your best baseline.

Expert nuance confirms that single metrics lack context and that trend analysis combined with industry-specific benchmarks is the only reliable way to avoid misinterpretation. We’ve seen businesses with excellent current ratios run out of cash because they ignored DSO trends. We’ve seen businesses with thin margins outperform peers because their cash conversion cycle was optimized. The number alone is never the story.

The other shift that changes outcomes is the nature of the conversation around the numbers. Most SMB owners talk to their accountant once a year at tax time. That’s compliance, not strategy. A CFO support workflow built around monthly reviews, forward-looking forecasts, and scenario planning changes what questions you even think to ask. It moves you from “what happened?” to “what should we do next?” That shift is where real growth comes from.

Outsourced and fractional CFOs change the nature of analysis because they bring pattern recognition from dozens of businesses across multiple industries. They know what a 48-day DSO means for a services firm versus a product company. They know when a gross margin drop is a pricing problem versus a cost problem. That context is worth more than any spreadsheet.

Take your SMB financial analysis to the next level

If reading this made you realize your financial analysis has gaps, you’re not alone. Most SMBs are working with good data and limited interpretation. The good news is that you don’t need to hire a full-time CFO to fix it.

https://johngalt-finance.com

John Galt Finance provides outsourced CFO-level expertise built specifically for businesses like yours, with 5 to 50 employees and revenues between $500K and $20M. Our team delivers the kind of financial analysis that turns your existing reports into genuine strategic insight. From profitability diagnostics to cash flow forecasting to variance review frameworks, we build the financial infrastructure that growing businesses need. Explore the outsourced CFO benefits that our clients use to grow faster, or learn how remote CFO services can give you senior financial expertise without the overhead. If you’re ready to think bigger about your finance function, start by exploring what outsourcing your finance team actually looks like in practice.

Frequently asked questions

What is the difference between financial reporting and financial analysis?

Financial reporting organizes and presents past data, while analysis interprets that data to identify trends, risks, and action opportunities. Financial analysis enables data-driven decisions for growth and stability, going well beyond what a standard report shows.

Which financial ratios are most important for SMBs to track?

Current ratio, quick ratio, gross margin, and net profit margin are the most critical for monitoring liquidity and profitability. Key ratio methodologies also include ROE, ROA, and debt-to-equity for a complete picture of financial health.

How often should SMBs conduct financial analysis?

SMBs should perform in-depth financial analysis at least quarterly, with monthly reviews strongly recommended for fast-moving or growth-stage companies. Monthly variance reviews in particular catch problems before they compound.

What are the signs that an SMB could benefit from outsourced CFO services?

If your business faces cash flow surprises, inconsistent margins, or lacks clear financial forecasting, outsourced CFO support can help unlock growth and stability. Preparing for a funding round or acquisition is another strong signal that senior financial expertise is needed.

Does benchmarking always reflect a healthy SMB?

No. Industry benchmarks vary significantly by sector, business model, and growth stage, so a number that looks healthy in one context can signal risk in another. Single metrics lack context, so always compare your own trends over time alongside any external benchmark.

FAQ

What’s the single most important financial ratio for an SMB?

Cash conversion cycle (DSO + DIO – DPO). It tells you how many days your cash is locked up in operations. A 10-day improvement at $5M revenue frees ~$137k in working capital. Profitability ratios matter, but liquidity kills businesses faster.

How do I benchmark my SMB against the industry?

Sources by reliability: RMA Annual Statement Studies (gold standard, paid), BizMiner, IBISWorld, and your industry trade association. Apply benchmarks to revenue tiers similar to yours; comparing a $2M business to industry medians (often skewed by $50M+ firms) is misleading.

What’s a healthy gross margin for my business?

Depends on model: SaaS 70-85%, professional services 40-60%, distribution 15-30%, retail 30-50%, manufacturing 25-45%. See our profit margin analysis guide for diagnostic frameworks.

How often should I analyze my financials in depth?

Monthly variance review (1 hour), quarterly deep-dive (half day), annual strategic review (2 days). Quarterly is where most SMBs find the most insight; it’s enough time for trends to emerge but not so much that issues fester.

What financial analysis matters most before raising capital?

Unit economics (CAC, LTV, payback period), cohort retention, gross margin trend, and a clean cash flow bridge from net income to free cash flow. Investors will discount your valuation by 20-40% if these aren’t ready. See our investor-readiness guide.

Share this:

How to analyze cash flow: smart steps for SMB owners

Cash Flow Analysis Benchmarks

MetricBenchmark
Recommended cash flow forecast horizon (short-term)13 weeks
Recommended cash flow forecast horizon (strategic)12-36 months
Forecast accuracy target (13-week)+/- 10% by week 4
SMBs that fail due to cash flow problems82% (US Bank study)
Median DSO (B2B SMB, US)40-50 days
Best-in-class DSO25-35 days
Cash conversion cycle target (manufacturer)<60 days
Cash conversion cycle target (SaaS, prepaid)Negative (cash in before delivery)

Running a business where you can barely cover two weeks of expenses is more common than most owners admit. Small business cash buffer data shows the median SMB has just 27 days of cash on hand, and half operate with fewer than 15. That’s not a margin for error — that’s a countdown. The good news is that CFO-level cash flow analysis isn’t reserved for companies with finance departments. With the right process, any SMB owner can turn a confusing pile of bank statements into a clear, actionable picture of where their money is going and when it will run out.

Table of Contents

Key Takeaways

PointDetails
Timing beats revenueTracking when cash actually enters and leaves matters more for SMB survival than revenue recognition.
Use rolling forecastsRegularly updated rolling forecasts offer the clearest view of liquidity, preventing surprises.
Direct vs indirect methodsChoose direct for short-term liquidity insights, indirect for big-picture planning—don’t rely on only one.
Reconcile profit and cashVerify your cash flow by thoroughly reconciling profit-to-cash, catching errors before they impact business decisions.
Small buffers are riskyHalf of SMBs operate with less than 15 days of cash buffer—raising risk if forecasts are inaccurate.

Understanding the basics of cash flow analysis

Cash flow and profit are not the same thing. This distinction trips up more business owners than almost any other financial concept. You can show a healthy net income on paper while your checking account is empty because a big client hasn’t paid yet, or because you prepaid six months of rent. Cash flow measures the actual movement of money in and out of your business during a specific period, regardless of when revenue was earned or expenses were incurred.

There are two standard methods for preparing a cash flow analysis, and understanding both gives you a real edge:

  • Direct method: You add up every actual cash receipt (customer payments, loan proceeds, asset sales) and subtract every actual cash payment (supplier invoices paid, payroll, rent, taxes). This method gives you transaction-level clarity and is especially useful for short-term liquidity decisions.
  • Indirect method: You start with net income from your income statement and then make adjustments for non-cash items (like depreciation) and changes in working capital (like increases in accounts receivable or inventory). This method ties directly to your financial statements and is more common for longer-term planning.

Cash flow analysis is commonly prepared using either the indirect method or the direct method, and each has a distinct purpose depending on your planning horizon.

FeatureDirect methodIndirect method
Starting pointActual receipts and paymentsNet income
Best forShort-term liquidityLong-term planning
Ties to financial statementsLess directlyYes
Transaction-level detailYesNo
Ease of preparationMore labor-intensiveEasier with accounting software

One of the most important things to internalize: timing of cash receipts and disbursements matters far more than revenue recognition for real-life liquidity decisions. A sale recorded in March doesn’t help you pay your team in February. This is why improving cash flow starts with understanding the gap between when you earn money and when you actually receive it. For a practical framework on improving cash flow, focusing on timing is the first and most critical step.

Statistic callout: The median SMB cash buffer is just 27 days. Half of all small businesses operate with fewer than 15 days of cash available. A single delayed payment from a major client can push you into crisis territory almost immediately.

Pro Tip: Don’t just track cash flow monthly. The month-end view hides intra-month cash crunches that can blindside you mid-payroll cycle.

Preparation: Essential data and tools for cash flow analysis

With the basics in place, let’s gather the materials and data you’ll need to analyze cash flow effectively.

Before you build any analysis, you need the right raw materials. Skipping this step is like trying to bake without checking if you have flour. The inputs you gather determine the accuracy of everything that follows.

Here are the core data sources you’ll need:

  • Bank statements: Every account your business uses, ideally for the last 12 months. These are your ground truth.
  • Accounts receivable aging report: Shows who owes you money and how long each invoice has been outstanding.
  • Accounts payable aging report: Shows what you owe suppliers and when those payments are due.
  • Payroll records: Frequency, amounts, and any irregular bonuses or commissions.
  • Loan and debt schedules: Principal and interest payment dates and amounts.
  • Income statement and balance sheet: Needed for the indirect method and for reconciling your analysis.
Data inputFormatWhy it matters
Bank statementsPDF or CSV exportConfirms actual cash movement
Accounts receivable agingAccounting software reportReveals collection timing risk
Accounts payable agingAccounting software reportIdentifies upcoming cash needs
Payroll recordsPayroll system exportLargest recurring outflow for most SMBs
Loan schedulesLender statementsFixed obligations that can’t be missed
Income statementMonthly P&LBaseline for indirect method reconciliation

For tools, a spreadsheet works for businesses just getting started, but accounting software with built-in cash flow reporting (such as QuickBooks, Xero, or FreshBooks) dramatically reduces manual work. A rolling cash flow forecast template, updated regularly, is the single most valuable tool you can add to your financial toolkit. Tracking SMB financial metrics alongside your cash flow data gives you a more complete picture of business health.

One important limitation to flag: the indirect method doesn’t show daily liquidity timing or transaction-level clarity. If you need to know whether you can cover payroll on Thursday, the indirect method alone won’t tell you. That’s when you need to layer in bank-level transaction data.

Pro Tip: Always reconcile your cash flow statement against your bank statements before drawing any conclusions. If the numbers don’t match, you have a data problem, not a cash flow problem. Fix the data first.

Execution: Step-by-step process to analyze cash flow like a remote CFO

Once you’ve assembled your tools and data, it’s time to execute a systematic CFO-level cash flow analysis.

This is where most business owners either skip steps or get overwhelmed. The key is following a repeatable process so your analysis improves every time you do it.

Step 1: Choose your method. For short-term decisions (the next 4 to 13 weeks), use the direct method. For longer-term planning and investor reporting, use the indirect method. Many experienced CFOs use both simultaneously.

Business owner sorts receipts choosing method

Step 2: Gather and organize your data. Pull all inputs identified in the preparation phase. Organize bank transactions by category: operating receipts, operating payments, investing activities, and financing activities.

Step 3: Build your cash flow statement. Map every transaction to its correct category. For the direct method, total up receipts and payments. For the indirect method, start with net income and work through your adjustments line by line.

Step 4: Create a rolling forecast. Don’t stop at historical analysis. Project forward 13 weeks using known commitments (payroll, rent, loan payments) and realistic revenue expectations. A cash flow forecasting guide can walk you through building this model from scratch.

Step 5: Run scenario analysis. What happens if your biggest client pays 30 days late? What if revenue drops 20%? Scenario testing is what separates reactive business owners from proactive ones. Financial scenario planning gives you the tools to stress-test your assumptions before reality does it for you.

Step 6: Track variance and refine. Compare your forecast to actual results every week. Where were you wrong? Why? Refining your assumptions over time makes your forecasts dramatically more accurate. A 13-week cash flow model is the gold standard for this kind of rolling visibility.

Infographic shows 5 step cash flow analysis process

A remote-CFO methodology centers on rolling forecasts, updating based on real results, running scenarios, and tracking variances — not just producing a static report once a quarter.

MethodProsCons
DirectTransaction-level detail, great for short-termLabor-intensive, harder to automate
IndirectTies to financials, easier to prepareMisses intra-period timing gaps

Direct vs. indirect cash forecasting shows that neither method is universally better. Direct works best for short-term liquidity decisions; indirect ties to your financial statements for longer-term planning. Smart CFOs use both.

“Confusing revenue recognition with cash timing is a core driver of forecasting failure.”

Pro Tip: Update your cash flow forecast weekly, not monthly. A monthly update means you’re always looking at stale data. Weekly updates catch problems before they become crises.

Verification: Common mistakes and review techniques

After completing your cash flow analysis, verifying accuracy and catching avoidable mistakes can be the difference between thriving and struggling.

Even experienced finance professionals make errors in cash flow analysis. The most damaging mistakes are the ones that look correct on the surface but silently distort your picture of liquidity.

Common errors to watch for:

  • Missed transactions: Small recurring charges (subscriptions, bank fees, insurance auto-debits) are easy to overlook but add up quickly over a quarter.
  • Reversed signs in working capital: An increase in accounts receivable is a use of cash, not a source. Getting this backward is one of the most frequent indirect-method errors.
  • Misclassified payment timing: Recording a payment in the month it was invoiced rather than the month it was actually paid distorts both historical analysis and forward forecasts.
  • Mixing operating and financing cash flows: Loan repayments belong in financing activities, not operating expenses. Misclassifying them inflates your apparent operating cash flow.
  • Ignoring seasonal patterns: Comparing a slow January to a strong December without context leads to false alarms or false confidence.

When you finish your analysis, always sense-check the profit-to-cash reconciliation to reduce classification and arithmetic errors. Ask yourself: does the difference between my net income and my operating cash flow make logical sense given my business model?

For example, if your net income was $50,000 but operating cash flow was only $10,000, you need to understand exactly why. Was it a big increase in receivables? Did you build up inventory? Each gap should have a clear, explainable cause.

Exploring cash flow management strategies and building a CFO support workflow into your regular routine makes verification a habit rather than a one-time scramble.

Statistic callout: Half of SMBs operate with under 15 days of cash buffer. A single misclassified transaction or missed payment can cascade into a liquidity crisis faster than most owners expect.

Pro Tip: After completing your analysis, ask one simple question: “Does the profit-to-cash flow difference make sense for my business right now?” If you can’t explain the gap clearly, dig deeper before making any decisions based on the numbers.

What most SMBs miss about cash flow analysis

Here’s the uncomfortable truth: most business owners treat cash flow analysis as a compliance task. They run the report, glance at the bottom line, and file it away. That approach leaves enormous strategic value on the table.

The textbook methods — direct, indirect, rolling forecasts — are only the starting point. What actually separates businesses that thrive from those that constantly scramble for cash is how often they engage with their numbers and what they do with the information.

We’ve worked with SMB owners who had technically correct cash flow statements that they reviewed quarterly. They were always surprised by cash crunches. The owners who avoided those surprises weren’t smarter — they were just more frequent. Weekly review cycles catch problems when they’re still small and fixable.

There’s also a mindset issue. Too many business owners are obsessed with profit metrics: gross margin, EBITDA, net income. These matter, but they don’t tell you whether you can make payroll on Friday. Cash timing is the operational reality. Profit is an accounting construct. When the two diverge, cash always wins.

“Cash flow isn’t just a periodic report — it’s the heartbeat of your business.”

The businesses we see make the biggest improvements are the ones that connect their custom financial modeling process to their weekly operational decisions. They use their cash flow forecast to decide when to hire, when to invest in equipment, and when to push harder on collections. That’s what turns analysis into a strategic asset.

Pro Tip: Treat your cash flow statement as a living document. Update it weekly, use it to drive operational decisions, and never let it become just a compliance checkbox.

CFO-level tools and support for robust cash flow analysis

For SMBs ready to move from theory to practice, robust CFO-style support is at hand.

Building a reliable cash flow analysis process takes time, and the stakes are too high to rely on guesswork. John Galt Finance specializes in giving SMB owners the same quality of financial insight that Fortune 500 companies get from their finance teams — without the cost of a full-time CFO.

https://johngalt-finance.com

Whether you need a cash flow forecasting guide to build your first rolling model, a custom financial modeling engagement to stress-test your business assumptions, or ongoing support to implement SMB cash flow strategies that actually stick, the platform offers tailored solutions for businesses generating between $500K and $20M in revenue. Stop managing cash flow reactively. Start using it as the strategic tool it was always meant to be.

Frequently asked questions

What is the difference between the direct and indirect cash flow analysis methods?

The direct method sums actual cash receipts and payments by category, while the indirect method starts with net income and adjusts for non-cash items and working capital changes. Direct is better for short-term liquidity visibility; indirect ties more naturally to your financial statements.

How often should my business update its cash flow forecast?

Best practice for SMBs is to update cash flow forecasts weekly. Rolling forecasts updated weekly and tracked against actual results allow you to refine assumptions and catch problems before they become crises.

What is a cash buffer and how much is enough?

A cash buffer is the number of days your business can cover typical outflows if inflows stop. The median SMB cash buffer is 27 days, but half of small businesses operate with fewer than 15 days, which leaves very little room for unexpected delays or disruptions.

How can I avoid common errors in cash flow analysis?

Always sense-check the profit-to-cash reconciliation after completing your analysis, and review working capital sign conventions carefully to reduce misclassification and arithmetic errors that can distort your liquidity picture.

FAQ

How often should I update my cash flow forecast?

Weekly for the 13-week rolling forecast, monthly for the 12-month strategic view. The 13-week is the operational cockpit; the 12-month informs financing and capex decisions. See our 13-week cash forecasting guide for the mechanics.

What’s the most common cash flow mistake SMB owners make?

Confusing profit with cash. A profitable business can run out of cash through receivables growth, inventory build, or capex timing. Always reconcile net income to operating cash flow monthly; if the gap widens, investigate immediately.

How do I improve cash flow without raising prices?

Five levers ranked by speed: (1) collect AR faster (deposits, milestone billing), (2) extend AP terms with negotiation, (3) reduce inventory turns, (4) cut discretionary opex 5-10%, (5) sell non-core assets. Most SMBs find 30-60 days of cash by tightening AR alone.

What metrics matter most in cash flow analysis?

DSO (days sales outstanding), DPO (days payable outstanding), DIO (days inventory outstanding), and the cash conversion cycle (DSO + DIO – DPO). Track all four monthly. A 10-day improvement in CCC at $5M revenue frees roughly $137k in working capital.

Should I use direct or indirect cash flow forecasting?

Use direct (line-by-line receipts and disbursements) for the 13-week. Use indirect (starting from net income) for 12-36 months and integration with the strategic model. Direct forecasts are far more accurate for the short term but tedious past 6 months.

Share this:

CFO-level financial reporting examples and KPI insights

CFO Reporting & KPI Benchmarks

MetricBenchmark
Monthly close time (best-in-class SMB)5-7 business days
Monthly close time (typical SMB)15-25 business days
Reports in a standard CFO board packageP&L, BS, CF, 13-week forecast, KPI dashboard, variance commentary
KPIs on a CEO dashboard (sweet spot)7-12
Material variance threshold (revenue)+/- 5% vs budget
Material variance threshold (margin)+/- 3 percentage points
Gross margin (SaaS)70-85% (Bessemer benchmark)
EBITDA margin (mature SMB services)10-20%

Most business owners running companies between $1M and $10M in revenue have the same frustrating experience: they get monthly financial reports that show revenue, expenses, and a bottom line, but those numbers don’t actually tell them what to do next. The spreadsheet looks clean. The accountant says everything is fine. And yet, you still can’t answer basic questions like “Can we afford to hire?” or “Why did margins drop last quarter?” That gap between raw numbers and real decision-making is exactly where CFO-level financial reporting earns its value, and understanding what those reports look like is the first step to building them.

Table of Contents

Key Takeaways

PointDetails
CFO-level reporting criteriaGood financial reporting tells the story behind numbers and links them to business decisions.
Essential statement templatesUse income, balance, cash flow statements with organized notes for comprehensive packs.
Actionable KPIsTrack liquidity, profitability, and efficiency metrics to drive smarter decisions.
Reporting with contextSupplement statements with narrative commentary and carefully structured disclosures.
Beyond templatesTemplates are useful, but actionable insights require tailored CFO-level analysis.

What makes CFO-level financial reporting different?

Having set the stage for why basic reporting isn’t enough, let’s break down the criteria for genuine CFO-level financial reporting.

The most important shift is this: CFO-quality reporting treats financial data as a narrative, not a ledger. A profit and loss statement tells you what happened. A CFO-level report tells you why it happened, what it means for your cash position, and what you should do about it. That distinction sounds simple, but it changes everything about how reports are structured and read.

According to Board Intelligence, good finance reporting should be more than spreadsheets: it should explain the story behind performance and the implications for stability, cash generation, and future financing needs. That framing is the foundation of every great CFO report. Numbers without context are just noise.

Here’s what separates CFO-level reporting from standard bookkeeping output:

  • Forward-looking commentary: Not just “revenue was $480K this month” but “revenue came in 6% below forecast due to delayed project starts, which will compress Q3 cash flow unless we accelerate collections.”
  • Variance analysis: Every significant deviation from budget or prior period gets explained, not just flagged.
  • Cash flow linkage: Every P&L result is connected back to its cash impact. Profit and cash are not the same thing, and CFO reports make that distinction explicit.
  • Risk and opportunity flags: A good report surfaces emerging risks (rising days sales outstanding, thinning margins on a key product line) before they become crises.
  • Actionable recommendations: The report doesn’t just describe the situation. It tells leadership what decisions need to be made.

“The best finance reports don’t just answer ‘what happened?’ They answer ‘so what?’ and ‘now what?’ That’s where CFO-level judgment earns its place.”

The strategic CFO role is fundamentally about translating financial data into business strategy. And CFO-led financial analysis gives SME owners the same interpretive lens that large corporations rely on every quarter.

Pro Tip: Before building any new report template, write down the three decisions your leadership team needs to make this quarter. Every section of your financial report should help answer at least one of those questions directly.

Core templates: Financial statement examples and structure

With the criteria established, the next step is to explore concrete examples of report formats and structures.

A complete financial reporting pack isn’t just a P&L. It’s a structured set of documents that together paint a full picture of your business’s financial health. The KPMG general-purpose financial reporting framework confirms that a full set of financial statements includes the income statement (profit or loss), balance sheet (statement of financial position), cash flow statement, plus related disclosures and notes, and often the statement of changes in equity or retained earnings.

For SMEs, the practical reporting pack typically includes these core components:

  • Income statement (P&L): Revenue, cost of goods sold, gross profit, operating expenses, EBITDA, and net income. Shown month-to-date, year-to-date, and versus budget.
  • Balance sheet: Assets, liabilities, and equity as of the reporting date. Highlights working capital and leverage.
  • Cash flow statement: Operating, investing, and financing cash flows. This is often the most underused statement in SME reporting, yet it’s the most critical for day-to-day decisions.
  • Statement of changes in equity: Tracks retained earnings, owner distributions, and capital contributions over time.
  • Notes and disclosures: Explains accounting policies, unusual items, related-party transactions, and anything that affects how numbers should be interpreted.
Report componentMonthly packAnnual packPrimary decision use
Income statementYesYesProfitability tracking
Balance sheetYesYesSolvency and leverage
Cash flow statementYesYesLiquidity management
Changes in equityQuarterlyYesOwner value tracking
Notes and disclosuresSummaryFullAudit and transparency
KPI dashboardYesYesPerformance benchmarking
CFO commentaryYesYesStrategic narrative

For SMEs looking to learn from best-in-class examples, PwC’s IFRS 18 illustrative consolidated financial statements provide practitioner-grade templates that show exactly how notes and structured disclosures should be organized. These aren’t just for public companies. The mechanics of clear note ordering and disclosure structure apply directly to any business that wants its financials to be readable and credible.

Monthly packs should be concise, focused on current performance and near-term cash. Annual packs go deeper, with full disclosures, year-over-year comparisons, and strategic context. The SMB board reporting guide walks through how to structure these packs for different audiences, whether that’s an internal leadership team, a bank, or an investor.

SME finance team reviewing monthly reports

KPIs and benchmarks: The actionable metrics included

After outlining which key statements to use, let’s turn to actionable metrics, the KPIs that bring financial reports to life.

Raw financial statements show you the scoreboard. KPIs tell you how the game is actually being played. For SME owners building CFO-style reporting, commonly used financial KPIs typically span four categories: liquidity, profitability, efficiency, and cash conversion.

Here’s a practical numbered framework for selecting and organizing KPIs in your management pack:

  1. Start with liquidity. Current ratio (current assets divided by current liabilities) and quick ratio (excluding inventory) tell you whether you can meet short-term obligations. A current ratio below 1.2 is a warning sign for most service businesses.
  2. Layer in profitability. Gross margin percentage, EBITDA margin, and net profit margin show where value is created and where it leaks. Gross margin below 40% in a professional services firm, for example, usually signals pricing or staffing problems.
  3. Add efficiency metrics. Days Sales Outstanding (DSO) measures how long it takes to collect receivables. Days Payable Outstanding (DPO) tracks how long you take to pay suppliers. The gap between these two numbers directly affects your cash position.
  4. Close with cash conversion. The cash conversion cycle (DSO plus days inventory outstanding minus DPO) shows how efficiently your business turns operations into cash. Shortening this cycle by even 5 days can free up significant working capital.
KPIFormulaSME benchmarkWarning level
Current ratioCurrent assets / current liabilities1.5 to 2.0Below 1.2
Gross margin(Revenue minus COGS) / revenueVaries by industryDeclining trend
EBITDA marginEBITDA / revenue10% to 20% for SMEsBelow 8%
DSO(Receivables / revenue) x days30 to 45 daysAbove 60 days
Cash conversion cycleDSO + DIO minus DPOIndustry-specificLengthening trend

The real power of KPIs isn’t in any single number. It’s in tracking trends over time and comparing against industry benchmarks. A gross margin of 38% might be fine for a manufacturing business but alarming for a software company. Context is everything.

Pro Tip: Pick no more than 8 to 10 KPIs for your monthly management pack. Too many metrics create noise and dilute focus. Choose the ones that directly connect to your three biggest business risks or growth levers.

Resources like mastering financial KPIs and essential SMB financial metrics provide deeper guidance on selecting the right metrics for your specific business model. For real-time tracking, a well-designed daily financial dashboard can surface KPI movements before they show up in your monthly report. And if you’re just getting started, financial KPIs to track offers a practical starting point for building your first metrics framework.

Real-world reporting: How public companies and illustrative packs handle disclosures

With metrics defined, it’s crucial to understand how reporting is enhanced by disclosures and management discussion, whether from public companies or illustrative templates.

Public company reporting gives SME owners a masterclass in how to structure and communicate financial information. The Boeing Q1 financial results announcement is a strong example of how management discusses GAAP results alongside non-GAAP metrics, with cautionary context that helps readers interpret the numbers accurately. Boeing’s reports don’t just present numbers. They explain what drove changes, what management is watching, and how results connect to forward guidance.

For SME owners, the key lessons from public company disclosure practices include:

  • Separate GAAP from adjusted metrics clearly. If you’re reporting EBITDA or adjusted profit, label it explicitly and explain what’s been excluded and why. Mixing the two without explanation erodes trust with lenders and investors.
  • Use systematic note ordering. EY’s IFRS 18 illustrative financial statements demonstrate how careful note structuring makes information easier to find and understand. The same principle applies to any management pack: organize notes logically so readers can navigate without hunting.
  • Write a management discussion section. Even a one-page narrative summarizing the period’s key results, what drove them, and what’s coming next transforms a data dump into a useful document.
  • Flag non-recurring items. One-time costs, insurance recoveries, or unusual gains should be identified separately so readers can assess underlying performance accurately.

“Disclosures aren’t bureaucratic box-ticking. They’re the difference between a report that builds confidence and one that raises more questions than it answers.”

Understanding why SMEs need CFO services often comes down to exactly this point. Most small business owners don’t have the background to write effective management commentary or structure disclosures clearly. That’s not a criticism. It’s just not what most entrepreneurs are trained to do. A CFO advisory guide can help you understand what level of support makes sense for your current stage.

Why templates alone aren’t enough: The narrative SME owners need

Once the structures and disclosures are understood, it’s critical to recognize where templates fall short, and how true CFO-level reporting moves beyond forms to actionable insight.

Here’s the uncomfortable truth about financial report templates: they’re a starting point, not a solution. A beautifully formatted income statement with clean variance columns is still useless if the person reading it doesn’t understand what the variances mean for the business’s next 90 days.

We’ve worked with business owners who had technically complete financial reporting packs, every statement present, every KPI calculated, and still made poor decisions because the reports didn’t connect numbers to context. The gross margin was declining for six months before anyone flagged it as a pricing problem rather than a volume problem. The distinction matters enormously for the fix.

Real CFO-level reporting requires judgment. It requires someone who knows your business well enough to say, “The DSO increase this month isn’t random. It’s concentrated in two clients who always pay late in Q4, and we’ve already addressed it.” That sentence is worth more than any template.

Story-driven commentary changes outcomes in three specific ways. First, it forces the person writing the report to actually understand the numbers, not just format them. Second, it gives leadership a shared interpretation of reality, reducing the time spent in meetings debating what the numbers mean. Third, it creates an audit trail of reasoning that helps you learn from past decisions.

The best advice for SME owners moving beyond template copying is to start with one question per section: “What does this number tell us about our ability to execute our strategy?” If the answer is “nothing,” either the metric is wrong or the commentary is missing. Industry-specific analysis adds another layer, because the benchmarks and warning signals in a retail business look completely different from those in a professional services firm or a manufacturing operation.

Templates give you the skeleton. Narrative commentary gives it a pulse.

Next steps: Build smarter reports with proven tools

You now have a clear picture of what separates a basic financial report from one that actually drives decisions. The structure matters. The KPIs matter. The disclosures matter. But the narrative layer is what makes it all actionable for your leadership team.

https://johngalt-finance.com

At John Galt Finance, we build customized financial reporting packs for SMEs that combine all of these elements: structured statements, benchmarked KPIs, management commentary, and forward-looking cash flow analysis. Whether you need a monthly management pack, a board-ready report, or a full CFO advisory engagement, our team delivers the same quality of financial insight that large companies pay full-time CFOs to produce. If you’re ready to move beyond spreadsheets and start making decisions from real financial intelligence, explore our outsourced CFO services and see how we tailor reporting to your specific industry and growth stage.

Frequently asked questions

What are the main components of a financial reporting pack?

A standard pack includes the income statement, balance sheet, cash flow statement, statement of changes in equity, and accompanying notes and disclosures. As KPMG confirms, a full set of financial statements also includes related disclosures and notes that provide essential context.

What KPIs should small business owners track in their reports?

Key KPIs include liquidity ratios, profitability margins, efficiency measures, and cash conversion metrics tailored to your business model. NetSuite’s guidance on CFO-style reporting confirms that gross and net profit margins alongside cash conversion measures are the most commonly used metrics for decision-making.

How do public company reports differ from SME reporting?

Public company reports must follow strict GAAP or IFRS standards, often supplement results with non-GAAP metrics, and include extensive management commentary. SMEs adapt these practices for practical insight without the full regulatory burden, using the same structural logic at a smaller scale, as illustrated by Boeing’s reporting approach.

Why is CFO commentary important in financial reports?

CFO commentary explains the context behind numbers and guides owners to understand cash flow, financing needs, and future decisions. Board Intelligence’s framework makes clear that good finance reporting must explain the story behind performance and its implications for stability and cash generation.

How can illustrative IFRS templates help SME owners?

They provide structured examples of financial statements, notes, and disclosures that help owners organize reports more clearly and professionally. PwC’s illustrative IFRS statements show exactly how mechanics and structured disclosure organization should work in practice.

FAQ

What KPIs should I see every month as an SMB owner?

At minimum: revenue vs budget, gross margin, EBITDA, cash balance, AR days, AP days, customer count, and gross retention. Anything beyond 12 KPIs becomes a dashboard nobody reads. See our financial dashboard guide for a build template.

How long should monthly close take?

Best-in-class SMBs close in 5-7 business days. If you’re past business day 15, the cause is almost always one of three things: waiting on credit card statements, slow AR reconciliation, or no documented close checklist. Fix the process, not the team.

What’s the difference between management reporting and financial reporting?

Financial reporting is GAAP-compliant statements for outside parties (banks, investors, IRS). Management reporting is internal, often non-GAAP, and built around decisions you actually make: segment profitability, cohort revenue, sales pipeline. SMBs need both, but spend 80% of CFO time on management reporting.

How do I know if my KPIs are the right ones?

Apply the “so what?” test: if a KPI moves 20% and your action plan doesn’t change, drop it. Good KPIs are leading (predictive), actionable (you can influence them), and tied to a strategic priority. Vanity metrics like total users or website visits usually fail all three.

Should I use a BI tool or stay in Excel?

Under $5M revenue, Excel + a clean accounting system is sufficient. Between $5M and $25M, a low-cost BI layer (Looker Studio, Fathom, Jirav) pays back quickly. Over $25M, full BI plus a data warehouse becomes necessary as data sources multiply.

Share this:

Top 5 johngaltinternational.org Alternatives 2026

Fractional CFO Service Benchmarks

MetricBenchmark
Fractional CFO hourly rate (US market)$200-$500/hour
Monthly retainer for SMB ($1M-$10M revenue)$3,000-$10,000/month
Full-time CFO total compensation (US median)$220,000-$450,000/year
Cost savings vs full-time CFO60-75%
Typical engagement length12-24 months
Hours per week (typical SMB engagement)5-20 hours
Revenue range where fractional CFO fits$1M-$50M
ROI achieved by SMBs using fractional CFOs3-7x within first year (CFO Selections survey)

Looking for sites like johngaltinternational.org can bring up some interesting surprises. There are new options popping up that offer fresh features and different experiences. With so many choices out there, the right alternative might change the way you approach your goals. Curious which options are making waves and drawing attention? Discover what sets each one apart and see which could be the perfect fit for your needs.

Table of Contents

John Galt Finance

Product Screenshot

At a Glance

John Galt Finance delivers outsourced CFO level expertise that fits companies needing senior financial guidance without hiring full time staff. The offering blends day to day reporting with strategic planning to help businesses understand current position and make confident growth decisions.

Core Features

Core capabilities include outsourced financial analysis and management, comprehensive financial reporting across P&L Cash Flow and Balance Sheet, and robust financial planning and analysis with budgeting and scenario modeling. The platform also provides strategic finance services for product planning resource allocation and M&A plus customized financial dashboards and models tailored to industry needs.

Pros

  • Customized solutions tailored to client needs: John Galt Finance adapts models and reporting to your product mix and growth stage so recommendations match reality and drive action.
  • Wide range of financial services: Reporting planning strategy and diagnostics are available under one roof so you avoid stitching together multiple advisors.
  • Experienced team with over 10 years in finance: That depth makes forecasts more realistic and investor facing materials more credible when you pursue funding.
  • Global client base across various industries: Exposure to different business models sharpens comparative analysis and brings cross industry insights to your strategy.
  • Transparent pricing and tiered service packages: Clear starting points and packaged options make budgeting for advisory services easier for finance leaders.

Who It’s For

This service suits small and medium sized businesses and startups with 5 to 50 employees and revenue between $500K and $20M that need outsourced financial leadership. Choose it when you want senior level planning reporting and diagnostics without a full time CFO on payroll.

Unique Value Proposition

John Galt Finance outperforms competitors by combining deep practical expertise with customizable deliverables built around your company. The mix of hands on financial modeling detailed metrics and strategy work lets you move from descriptive reports to actionable plans. Sophisticated buyers pick this option because the team supplies investor ready models clear operating forecasts and strategic allocation advice that support fundraising and scaling. Transparent pricing and tiered service packages reduce procurement friction and make it straightforward to upgrade from a one off engagement to ongoing CFO support.

Real World Use Case

A tech startup engaged John Galt Finance to build a financial model and strategic plan for scaling and attracting investors. The firm delivered scenario based projections investor facing materials and a three phase resource allocation plan that aligned product milestones with cash flow projections.

Pricing

Pricing varies by package and services selected. One off services start from 600 EUR while broader service packages are available via custom quotes based on scope and ongoing involvement.

Website: https://johngalt-finance.com

CFO Edge

Product Screenshot

At a Glance

CFO Edge delivers outsourced CFO services that swap the cost of a full time executive for focused, flexible leadership. The firm targets organizations that need senior financial direction without hiring a permanent CFO.

This offering is strong where clear metrics and project driven outcomes matter, especially for companies preparing for fundraising or scaling operations.

Core Features

CFO Edge provides a suite of services built around flexible CFO roles and measurable results. Key capabilities include project CFO, part time CFO, and interim CFO engagements tailored to client goals.

  • Flexible roles to match short term projects or ongoing part time support.
  • Tailored financial solutions grounded in leading edge benchmarks and measurable outcomes.
  • Resources library with articles, white papers, and success stories for executive teams.
  • A dedicated client portal backed by a team of experienced financial professionals.

Worth considering.

Pros

  • Customized CFO solutions adapt to different organizational needs and avoid the expense of a full time hire.
  • The resource library provides actionable articles and white papers that help leadership level up quickly.
  • Services focus on measurable outcomes, giving you tools to track progress and link projects to value realization.
  • The team includes experienced CFO professionals who bring cross industry perspectives to complex problems.
  • Flexible engagement options make high level expertise more cost effective for short term and episodic needs.

Cons

  • Pricing details are not published, so you must contact CFO Edge to obtain a quote and scope information.
  • The service scope centers on CFO level work, which means smaller bookkeeping or routine accounting needs are outside its primary offering.
  • Very small businesses with tight budgets or minimal financial complexity may find the engagement level more than they need.

Who It’s For

CFO Edge fits startups, growing companies, and mid sized enterprises that require experienced CFO leadership on a temporary, part time, or project basis. Companies preparing for investment rounds or rapid scaling will benefit most.

Unique Value Proposition

CFO Edge combines senior level financial strategy with tools that measure progress toward specific outcomes. That blend helps leadership move from problem identification to concrete financial improvement with fewer meetings and clearer deliverables.

Real World Use Case

A rapidly growing startup hired CFO Edge to build a scalable financial model and install financial controls ahead of a funding round. The engagement produced investor ready forecasts and operational dashboards used in board discussions.

Pricing

Pricing details are not specified on the website; interested clients should contact CFO Edge for a custom quote and engagement options. Pricing appears to be scoped to project size and duration.

Website: https://www.cfoedge.com

PBMares

Product Screenshot

At a Glance

PBMares is a nationally recognized public accounting and business advisory firm with a strong presence across all 50 states and in 12 countries. The firm pairs industry specific expertise with broad service coverage to support mid sized organizations that need senior level financial guidance.

Core Features

PBMares delivers audit, tax, and consulting services combined with industry advisory for construction, healthcare, government contracting, real estate, and not for profit sectors. They also offer cybersecurity and risk management services plus retirement plan and outsourced accounting capabilities.

Pros

  • Nationwide reach: PBMares serves clients across all 50 states and internationally which lets businesses access regional experience without losing national perspective.
  • Diverse service offering: The firm provides audit, tax, advisory, cybersecurity, and retirement plan services so businesses can consolidate multiple needs under one provider.
  • Industry focus: Tailored solutions for construction, healthcare, government, and not for profit clients mean advice reflects sector specific regulations and margins.
  • Reputation and recognition: Industry publications and awards cited by PBMares add credibility when you present advisors to lenders or investors.
  • Strong client satisfaction: Client testimonials highlight responsive engagement and practical recommendations that improve financial controls and reporting.

Cons

  • Pricing not transparent: The website does not list fees which makes budget planning and vendor comparisons more time consuming for small finance teams.
  • Limited technology disclosure: The site does not specify the accounting or cybersecurity platforms they use which complicates assessment of integration with your tech stack.
  • Onboarding details absent: There is no clear step by step client engagement process published which leaves uncertainty about timelines and deliverables during implementation.

Who It’s For

PBMares fits mid sized to large organizations and industry specific entities seeking comprehensive accounting, advisory, and risk management services. Companies in healthcare, construction, government contracting, real estate, and not for profit sectors will find the firm especially relevant.

Unique Value Proposition

PBMares combines regional expertise with national reach and industry specialized teams so you get advisors who understand local compliance while aligning with broader strategic goals. That mix helps when you need hands on financial fixes plus board level reporting.

Real World Use Case

A healthcare organization hires PBMares for annual audit services and a cybersecurity risk assessment to protect patient data and meet compliance requirements. The engagement yields tightened controls, clearer financial forecasts, and a prioritized remediation plan.

Pricing

Pricing is not specified on the website so you will need to request a proposal to get custom quotes based on scope, industry, and engagement level.

Website: https://pbmares.com

KORE1

Product Screenshot

At a Glance

KORE1 is a nationwide staffing firm that links businesses with talent across technology, engineering, finance, healthcare, creative, HR, and industrial roles. Its strength lies in precision recruiting and long term relationships that match small companies with the right hires fast.

Core Features

KORE1 delivers three engagement models: direct hire, contract staffing, and project teams to cover permanent hires and short term needs. The firm pairs AI driven candidate sourcing with deep industry relationships for targeted candidate presentations rather than large résumé pools.

The service includes post placement engagement to support candidate retention and performance. That follow up helps reduce churn and keeps hiring cycles shorter for growing teams.

Pros

  • Established track record: Operating since 2005, KORE1 brings institutional experience that benefits small teams looking for seasoned recruitment processes.
  • Customized recruitment: The firm focuses on long term fit which helps reduce turnover and saves hiring costs for businesses scaling to 5 to 50 employees.
  • Deep talent networks: KORE1 leverages long standing relationships to surface candidates not visible in public job boards.
  • AI enhanced sourcing: The use of AI improves targeting and alignment between job requirements and candidate skills.
  • Flexible placement options: Support for both remote and on site placements suits hybrid teams and local hiring needs.

Cons

  • Limited public drawbacks: The website does not list specific weaknesses, which makes independent trade off assessment harder for buyers.
  • Possible local gaps: KORE1 may have limitations in very specialized local industries where hyperlocal recruiters hold deeper networks.
  • Opaque pricing: The website provides no pricing details which requires direct contact to evaluate cost against budget.

Who It’s For

KORE1 fits small and medium sized businesses that need professional hiring support without building an in house talent acquisition team. It works well for founders and finance leaders who must hire technical or operational roles quickly while preserving cash flow.

Unique Value Proposition

KORE1 combines targeted candidate shortlists with long term client engagement to reduce hiring cycles and raise retention. The blend of focused candidate presentations and post placement engagement positions the firm as a partner for companies that treat hiring as strategic rather than transactional.

Real World Use Case

A technology startup launching a new product partners with KORE1 to staff a four person engineering pod in six weeks. KORE1 sources, vets, and presents matched candidates while coordinating interviews and follow up to help the startup reach launch milestones.

Pricing

Pricing is not specified on the website. Prospective clients need to contact KORE1 for custom quotes based on role type, engagement model, and project duration.

Website: https://kore1.com

Product Screenshot

At a Glance

The site currently displays no product content and sits behind security verification, which prevents a full evaluation. From the available notes the offering may target decision-making tools, but that remains unconfirmed until the verification clears.

Core Features

No explicit features are published at this time so a complete feature breakdown is unavailable. The site metadata suggests a focus on judgment or prediction capabilities, but the only concrete detail is that the site uses Cloudflare for security and performance.

Pros

  • The site shows an emphasis on protecting visitor traffic with Cloudflare which signals a priority on data safety and uptime for future users.
  • The presence of security verification indicates careful access control and may benefit organizations that handle sensitive forecasting or decision data.
  • The domain and description hint at potential tools for judgment and prediction which could suit teams that need structured decision support.
  • The site appears ready to accept updates and detailed product information, suggesting the platform may expand its public offering soon.

Cons

  • No product details are available which prevents a meaningful assessment of core capabilities for small business finance needs.
  • Visitors face a verification step that blocks immediate access and forces potential users to revisit the site before evaluating the service.
  • Pricing information is absent which makes budgeting and vendor comparison impossible right now for businesses evaluating outsourced financial expertise.
  • Use cases and technical specs are missing which leaves uncertainty about integration, data security, and model transparency that CFOs require.

Who It’s For

This site may appeal to professionals and organizations interested in structured prediction, judgment analysis, or decision support tools. Small to medium business owners seeking remote CFO insights should wait for published features before considering this as an alternative to established outsourced financial services.

Unique Value Proposition

At the moment the site offers a promise rather than a product. The unique value rests on its implied focus on judgment and prediction combined with a secure delivery approach, but concrete differentiators will only appear once the site publishes product details.

Real World Use Case

A likely use case would be research teams or finance leaders running scenario analysis and prediction exercises if the platform delivers judgment aggregation or forecasting tools. For now this remains hypothetical until functional features and outputs are shown.

Pricing

No pricing information is available on the site. That lack of transparency prevents direct comparison for budgets that range from $500,000 to $20 million in annual revenue and teams of 5 to 50 employees.

Website: https://goodjudgment.com

CFO Service Comparison

Below is a comprehensive comparison of notable CFO services to assist businesses in selecting a suitable provider for their financial needs.

ProviderCore FeaturesProsConsPricing
John Galt FinanceOutsourced CFO services with reporting, budgeting, and M&A supportCustomized solutions, extensive experience, transparent pricing, global client baseSpecific pricing or function scheduling neededFrom 600 EUR for projects; packages on custom quote
CFO EdgeProject-based CFO services, white papers, and outcome trackingMeasurable outcomes, tailored solutions, access to leadership resourcesPricing details require contact; minor bookkeeping excludedCustom quotes needed
PBMaresAudit, tax, cybersecurity, and advisory services across multiple industriesRegional reach, extensive accounting services, industry specific solutionsOpaque pricing, limited onboarding detailsCustom quotes based on scope and engagement level
KORE1AI-driven staffing for direct hire, contract, and project teamsEstablished reputation, post-placement retention, customized hiringOpaque pricing, potential limitations locallyCustom quotes based on hiring needs and contract length
Good JudgmentPrediction and judgment tools with secure access for decision supportFocus on data safety, potential for decision making toolsNo product detail or pricing information availablePricing unlisted at this time

Discover Expert Financial Leadership Beyond Alternatives

If you’re exploring top options in outsourced CFO services, you understand the challenge of finding tailored financial guidance that truly fits your business size and industry. Pain points like navigating complex financial models, preparing for fundraising, and aligning your growth strategy with clear cash flow forecasts are critical. John Galt Finance addresses these with customized financial expertise designed specifically for companies with 5 to 50 employees and revenues from $500K to $20 million.

https://johngalt-finance.com

Unlock your business’s potential with strategic planning, detailed diagnostics, and hands-on CFO support that scales with your needs. Visit John Galt Finance — Articles & Insights | John Galt to explore insights and learn why many startups and growing companies rely on John Galt Finance for actionable and investor-ready financial leadership. Take the next step toward confident decision making at john galt-finance.com today.

Frequently Asked Questions

What should I consider when evaluating johngaltinternational.org alternatives in 2026?

When evaluating alternatives, consider factors such as features, pricing, user support, and integration capabilities with your existing systems. Look for tools that align with your specific business needs and goals to ensure a seamless transition.

How can I determine if an alternative is suitable for my financial reporting needs?

Assess suitability by analyzing the features each alternative offers for financial reporting, such as customizable dashboards, budgeting tools, and real-time analytics. Request demos or trial periods to test these features in the context of your reporting requirements.

What actions can I take to compare multiple johngaltinternational.org alternatives effectively?

Create a comparison matrix to evaluate key features, pricing, and customer reviews for each alternative. Rank them based on how well they meet your specific requirements and make decisions based on your findings.

How important is customer support when choosing an alternative to johngaltinternational.org?

Customer support is crucial, especially if you encounter issues or need assistance during implementation. Ensure the alternative you choose offers responsive support channels, such as live chat or phone help, to address your concerns quickly.

Can I expect significant cost savings when switching from johngaltinternational.org to an alternative?

Yes, you may find significant cost savings depending on the pricing models of the alternatives. Estimate potential savings by comparing the total cost of ownership over 12 months, including subscription fees and any additional service costs.

FAQ

When should I hire a fractional CFO instead of a bookkeeper?

Hire a fractional CFO when you need forward-looking decisions, not just historical recordkeeping. Triggers include raising capital, hitting $1M+ revenue, planning an acquisition, or facing margin compression. See our 8 signs your business needs a CFO for a full decision framework.

How quickly can a fractional CFO deliver results?

Expect a 30-day diagnostic phase, 60-90 days to implement reporting and a 13-week cash forecast, and 6 months before strategic initiatives (pricing, capital structure) show measurable impact. Most clients see decision-quality improvements within the first month.

What’s the difference between a fractional CFO and outsourced CFO services?

A fractional CFO is typically a single senior advisor embedded part-time. Outsourced CFO services are firm-based, often with a team (CFO, analyst, controller). Fractional is usually cheaper and more personal; outsourced gives you bench depth.

How do I evaluate fractional CFO providers?

Check three things: (1) industry-specific experience in your business model, (2) references from companies your size, (3) clear scope and deliverables in the engagement letter. Avoid providers who can’t show you a sample 13-week cash forecast or board package.

Can a fractional CFO help me raise capital?

Yes, this is one of the highest-ROI use cases. A fractional CFO will prepare your investor-ready financials, build the operating model, and often participate in investor meetings. Expect 4-8 weeks of prep before going to market.

Share this:

Top 3 Fiverr.com Alternatives 2026

Freelance Marketplace Benchmarks

MetricBenchmark
Fiverr platform fee (buyer)5.5% + small order fee
Upwork platform fee (freelancer)10% flat
Toptal screening pass rate<3% (top 3% of applicants)
Median hourly rate for finance freelancers$40-$150/hour
Median hourly rate for senior finance pros (US)$150-$400/hour
Project failure rate on low-end marketplaces30-50%
Time to vet a freelancer (best practice)2-5 hours (calls, test project, references)
Recommended trial project budget$200-$1,000 paid test

Finding the right platform for freelance work and project outsourcing can feel like searching for a hidden gem. Some sites offer different features, unique communities, or pricing models that surprise new users. Others focus on specialty services or cater to a wide range of creative talents. With so many choices, you might wonder which options really stand out or fit your needs better. Get ready to see how these top picks compare and discover new possibilities for your next project.

Table of Contents

John Galt Finance

Product Screenshot

At a Glance

John Galt Finance is the leading choice for outsourced finance support for small and medium sized businesses. It combines remote CFO level expertise with practical deliverables to drive profitability and prepare companies for growth.

Core Features

John Galt Finance delivers financial analysis, management, and planning with hands on support. The service set includes financial modeling and forecasting, record keeping and reporting, strategic finance analysis, and M&A and resource allocation support.

Pros

  • Customized outsourced finance solutions: Services are tailored to each business so you get relevant priorities rather than a one size fits all playbook.
  • Experienced team with over 10 years: The team’s longevity translates to structured processes and fewer surprises during implementation.
  • Wide industry specialization: Support spans startups, fintech, e commerce, and other sectors so guidance fits your market context.
  • Flexible service packages and one off services: You can engage for ongoing support, a single project, or a mix that matches cash flow and needs.
  • Global remote support: Remote delivery lets you access specialized finance skill without hiring full time staff in your location.

Who It’s For

John Galt Finance serves small to medium sized business owners and managers who want remote outsourced financial expertise to improve profitability and strategic planning. It fits teams that need senior level finance guidance without committing to a full time CFO.

Unique Value Proposition

John Galt Finance stands apart because it pairs hands on strategic financial planning and analysis with flexible engagement models. Clients receive custom financial models, ongoing CFO style support, and tailored diagnostics so decisions rest on accurate forecasts and clear scenarios. The approach emphasizes measurable outcomes rather than vague recommendations.

John Galt Finance also offers a proven process from initial demo analysis and diagnostics to ongoing financial management. That structure reduces setup time and accelerates value capture for businesses that must act quickly on margins or fundraising timelines.

Real World Use Case

A retail business outsourced its financial reporting and analysis to John Galt Finance and achieved a 25% increase in margins through better cost management and pricing strategy. The engagement combined improved reporting, updated forecasts, and practical margin actions.

Pricing

Pricing varies based on packages and services and specific quotes are available on request. John Galt Finance offers comprehensive packages, one off services, and free consultations to define scope and deliverables before you commit.

Website: https://johngalt-finance.com

Upwork

Product Screenshot

At a Glance

Upwork connects businesses with independent professionals across many categories and offers AI powered matching to speed hiring decisions. It combines job posting, talent search, and secure payment features into a single platform that supports short term gigs and longer engagements.

Core Features

Upwork provides a job posting and talent search platform where you can describe needs, review proposals, and hire across categories like Development, Design, Marketing, and Data. The platform uses AI powered matching, includes project management tools, handles contracts, and manages payments while offering resources and support for both clients and freelancers.

Pros

  • Large talent pool: Upwork gives access to a wide range of skilled professionals across specialized categories, which helps you find niche expertise for specific projects.
  • Wide category coverage: The platform supports Development, Design, Marketing, Writing, Analytics, Admin, and more, making it easy to assemble cross functional teams.
  • AI powered matching: The matching system reduces search time by surfacing candidates whose profiles and histories align with your job brief.
  • Flexible hiring options: You can hire hourly contractors, fixed price freelancers, or assemble short term teams to match project needs and budget restraints.
  • Secure payment and collaboration: Built in contract management and payment handling protect both parties and simplify invoicing and payout tracking.

Cons

  • High competition for talent: High freelancer competition means strong candidates may face many bids, which can require extra time to evaluate proposals.
  • Service fees apply: Platform fees and transaction charges may add to project costs and should be accounted for in budgeting and vendor selection.
  • Variable freelancer quality: Freelancer skills and reliability vary widely, so careful vetting and trial tasks are often necessary before scaling work.

Who It’s For

Upwork suits businesses of all sizes that need flexible, on demand talent and prefer outsourcing specific projects rather than hiring full time staff. It also works for startups that need to quickly assemble small teams without committing to long term payroll.

Unique Value Proposition

Upwork combines a broad talent marketplace with integrated tools for hiring, project tracking, and payment handling, backed by AI matching to reduce search friction. That combination makes it a practical option when speed and variety of skills matter most.

Real World Use Case

A startup uses Upwork to assemble AI developers, designers, and marketers for a product launch, coordinating milestones and release tasks on the platform while handling contractor invoices through built in payment tools.

Pricing

Pricing depends on engagement type and membership level and varies by project scope. Options include Upwork Basic for occasional hiring and Business Plus plans for teams needing expanded features and account management.

Website: https://upwork.com

Freelancer.com

Product Screenshot

At a Glance

Freelancer.com is a large global platform that connects clients and freelancers across many service categories. It offers broad reach and a bidding model that helps clients find talent quickly while giving freelancers opportunities to build portfolios and reputations.

Core Features

The platform functions as a global freelance marketplace with a variety of job categories like writing, design, and programming. It supports profile and portfolio creation, a bidding workflow for projects, and a secure payment system for transactions and milestone payments.

Pros

  • Access to a wide range of freelance jobs and clients worldwide and this increases the pool of talent available for short term or project based work.
  • Secure payment gateway protects both clients and freelancers by holding funds for milestones and helping reduce payment disputes.
  • Reputation and review system helps you evaluate freelancers by their past client feedback and completed projects.
  • Opportunities for freelancers to grow their careers come from repeated work, improved ratings, and visible portfolios on the platform.

Cons

  • Competition can be high among freelancers which can push rates down and make it harder to find specialized talent quickly.
  • Service fees may apply for both clients and freelancers and those fees vary by project and payment processing method.
  • Site accessibility issues in some regions may prevent reliable access for teams or vendors operating in blocked locations.

Who It’s For

This solution fits freelancers seeking remote jobs and clients looking to outsource work to global freelancers. Small and medium sized businesses can use it to source project based expertise without hiring full time staff.

Unique Value Proposition

The platform combines a large, diverse talent pool with a bidding system and portfolio visibility which speeds up matching between project requirements and candidates. Its strength lies in scale and the mix of categories available for one off and recurring projects.

Real World Use Case

A graphic designer uses Freelancer.com to find clients worldwide, bid on design projects, and receive payments securely while building a visible portfolio that attracts larger jobs over time.

Pricing

Free to sign up and browse. Service fees vary depending on project type and payment processing which affects total cost for both clients and freelancers.

Website: https://freelancer.com

{ “text”: “## Professional Financial and Freelancing Outsourcing Platforms Comparison

The following table provides a comprehensive comparison of different platforms offering financial and freelancing outsourcing services, highlighting their main features, advantages, usage scenarios, and pricing information.

PlatformOverviewCore FeaturesProsPricing
John Galt FinanceRemote CFO-level expertise and financial planning for small/medium businesses.Financial modeling, planning, M&A support.Tailored solutions, experienced team, global reach.Customized based on services selected.
UpworkA freelancing platform connecting businesses and professionals with AI-powered talent matching.Job posting, AI talent matching, payment.Wide category coverage, flexible hiring, secure collaboration.Based on memberships and project scope.
Freelancer.comGlobal platform enabling businesses to hire freelancers through a bidding system.Bidding projects, profile building, payments.Extensive talent pool, secure payments, freelancer career growth opportunities.Service fees vary by project.
” }

Discover Reliable Financial Expertise Beyond Fiverr Alternatives

When exploring Fiverr alternatives, businesses often seek not just freelance talent but strategic, high-level financial guidance that supports sustainable growth. If you are facing challenges in managing complex financial planning, forecasting, or profitability analysis without a full-time CFO, John Galt Finance offers a tailored remote solution designed specifically for small to medium-sized companies. This service goes beyond quick gigs and delivers hands-on strategic support that aligns with your unique business goals.

https://johngalt-finance.com

Take control of your financial future today with John Galt Finance. Empower your business through expert financial modeling, cash flow optimization, and ongoing CFO-level insights. Visit the site now to learn how customized financial solutions can transform your growth path. Start your journey with a free consultation to experience measurable impact without the overhead of permanent staff.

Frequently Asked Questions

What are the key features to look for in Fiverr.com alternatives?

To choose the best Fiverr.com alternative, look for features like a user-friendly interface, diverse categories of freelance services, secure payment options, and tools for project management. Evaluate each platform based on these criteria to ensure it meets your specific project needs.

How can I compare the pricing structure of Fiverr.com alternatives?

To compare pricing structures, assess both the service fees charged by the platform and the rates freelancers set for their work. Make a list of the average prices for services you need across different platforms to find the most cost-effective option for your projects.

What types of projects are best suited for these Fiverr.com alternatives?

These Fiverr.com alternatives are suitable for a wide range of projects, including graphic design, content writing, web development, and marketing tasks. Identify the specific services you need and check which platform excels in those categories to meet your project goals.

How do I ensure the quality of freelancers on Fiverr.com alternatives?

To ensure quality, review freelancer profiles, ratings, and past work samples on each platform. Implement a trial task or small project to evaluate their skills before engaging them for larger assignments.

Can I negotiate prices with freelancers on these alternatives?

Yes, negotiating prices with freelancers is often possible on these platforms, especially for larger projects or long-term contracts. Clearly communicate your budget and discuss terms to find a mutually agreeable price.

What payment methods are common on Fiverr.com alternatives?

Common payment methods include credit cards, debit cards, and various online payment systems. Check each platform’s payment policies to determine which methods are accepted and if they provide buyer protection for transactions.

FAQ

What’s the best Fiverr alternative for finance work?

For senior finance work (CFO, FP&A, modeling), specialized firms outperform marketplaces. Marketplaces work for transactional tasks (bookkeeping, data entry, basic Excel). Don’t hire a fractional CFO on a $25/hour platform; the false economy is brutal.

How do I vet a freelancer before hiring?

Three-step process: (1) review portfolio and 3 references from comparable projects, (2) run a paid trial ($200-$1,000) on a real but low-stakes deliverable, (3) only commit to ongoing work after the trial. Skipping this costs more than it saves.

When does it make sense to use Fiverr or Upwork?

For commoditized work: data cleanup, basic bookkeeping entry, simple presentations, video editing, graphic design. Avoid for anything strategic, regulated, or hard to verify quality on (financial modeling, tax, legal, M&A).

What are the hidden costs of freelance marketplaces?

Time vetting, project rework, knowledge transfer, and switching costs when a freelancer disappears. Industry studies put true cost at 1.5-2x the stated hourly rate. For mission-critical work, a higher-rate boutique firm often costs less all-in.

Should I hire a freelancer or an agency for finance work?

Agency for: ongoing needs, compliance-sensitive work, depth/redundancy of staffing. Freelancer for: one-off projects, very specialized skills, tight budget. For fractional CFO work, an agency-style firm is usually safer; continuity matters when financial decisions compound.

Share this: