4 - 2026 | John Galt

Working Capital Optimization: How to Free Up Cash Stuck in Your Business

Working capital optimization is the single most powerful lever most business owners never pull. You can have a profitable company—strong revenues, healthy margins—and still find yourself scrambling to make payroll because too much cash is trapped in unpaid invoices, bloated inventory, or supplier terms that don’t work in your favor. In fact, studies show that inefficient working capital management costs SMBs hundreds of thousands of dollars annually in unnecessary borrowing costs and lost growth opportunities. This guide shows you exactly how to diagnose, fix, and sustain a lean, cash-generating working capital cycle.

Table of Contents

What Is Working Capital and Why It Matters

Working capital is the difference between your current assets (cash, receivables, inventory) and your current liabilities (payables, short-term debt). The formula is simple:

Working Capital = Current Assets − Current Liabilities

But the number alone doesn’t tell the full story. A positive working capital balance means you have enough liquid assets to cover near-term obligations—but it doesn’t tell you whether that capital is moving efficiently. A business with $2M in receivables that take 90 days to collect is in a very different position than one where the same receivables clear in 30 days.

Working capital optimization is about making that cash move faster through your business cycle so you need less external financing, can seize growth opportunities quickly, and sleep better at night. As part of any solid cash flow management strategy, it’s foundational.

The Hidden Cost of Trapped Cash

Every dollar stuck in a 90-day receivable or a slow-moving inventory item has an opportunity cost. If your cost of capital is 8%, then $500,000 tied up unnecessarily for an extra 60 days costs you roughly $6,600—just in financing cost. Multiply that across your entire business and across 12 months, and the number becomes significant.

Diagnosing Your Working Capital Problem

Before you can optimize, you need to know where the friction is. Most working capital problems fall into three buckets:

Key Takeaways

AreaCommon ProblemTarget Benchmark
Accounts ReceivableDays Sales Outstanding (DSO) > 45 daysDSO < 30 days
InventoryDays Inventory Outstanding (DIO) > 60 daysDIO < 30–45 days (varies by industry)
Accounts PayableDays Payable Outstanding (DPO) < 30 daysDPO 45–60 days (with supplier consent)
Cash Conversion CycleCCC > 60 daysCCC < 30 days
Current RatioBelow 1.21.5–2.0

Running a Working Capital Audit

Pull the last 12 months of balance sheet data. Calculate your DSO (Days Sales Outstanding), DIO (Days Inventory Outstanding), and DPO (Days Payable Outstanding). Then compute your Cash Conversion Cycle (CCC = DSO + DIO − DPO). This single number tells you how many days it takes to convert a dollar invested in operations back into cash. The lower, the better.

Benchmark your CCC against your industry. A software company should aim for single digits. A manufacturing firm might be comfortable at 45–60 days. A retailer typically targets 30–40 days. If you’re materially above benchmark, you have a working capital problem worth fixing.

Accounts Receivable: Speed Up Collections

Receivables are often the biggest working capital drain for service businesses and B2B companies. Here’s where to focus:

1. Tighten Your Invoice-to-Cash Process

Invoice the moment work is complete—not at month end. Every day of delay on invoicing is a day added to your DSO. Use automated invoicing software that sends reminders at 7, 14, and 30 days overdue. Make it effortless for clients to pay: accept ACH, credit card, and wire. Friction in payment = delayed cash.

2. Renegotiate Payment Terms

If your standard terms are Net 30, consider moving new clients to Net 15. For existing clients, offer early payment discounts: a 2/10 Net 30 term (2% discount if paid within 10 days) is often worth it—2% annualizes to about 36% return on the cash you accelerate. That beats most short-term borrowing rates.

3. Require Deposits on Large Projects

Any project over a certain size should require 25–50% upfront. This shifts financing burden from you to your client, which is appropriate—you’re doing work for them, not lending them money.

Real Example: Agency DSO Reduction

A digital marketing agency with $3M revenue had a DSO of 52 days. By moving to automated invoicing with payment links, requiring 30% deposits on projects over $10K, and implementing a weekly AR review, they cut DSO to 28 days within 6 months. The result: $380,000 in cash freed up from the balance sheet, eliminating the need for a $200K line of credit they’d been carrying.

Inventory Management: Stop Sitting on Cash

For product businesses, inventory is the most capital-intensive part of the working capital cycle—and the most overlooked. Inventory that sits for 90+ days isn’t an asset; it’s frozen cash with a carrying cost.

ABC Analysis: Focus on What Matters

Segment inventory into three tiers:

  • A items (top 20% by value): Monitor daily, keep tight reorder points, negotiate JIT delivery with suppliers
  • B items (middle 30%): Review weekly, use economic order quantity (EOQ) formulas
  • C items (bottom 50% by value): Reduce safety stock, consider drop-shipping or consignment arrangements

Demand Forecasting to Reduce Overstock

Most SMBs overstock because of “gut feel” ordering. Moving to even basic demand forecasting—averaging 3–6 months of sales data by SKU—can cut inventory by 15–25% without service-level impact. Modern ERP and inventory tools make this accessible without a data science team.

Liquidate Dead Stock

Identify any inventory with zero sales in the last 90 days. Discount aggressively, bundle with faster-moving items, or write it off. Sitting on dead stock to “get full price eventually” is almost always a bad tradeoff against the carrying cost and capital opportunity cost.

Accounts Payable: Extend Without Burning Bridges

Your suppliers represent a free source of financing. If you’re paying invoices in 15 days when your terms are Net 45, you’re leaving 30 days of float on the table. Working capital optimization means stretching DPO to the maximum terms you’ve negotiated—while maintaining strong supplier relationships.

Negotiate Better Payment Terms

For your top 10 suppliers by spend volume, have a conversation about extending terms from Net 30 to Net 45 or Net 60. Offer something in return: commitment to volume, predictable ordering schedules, or electronic payment (which reduces their processing costs). Most suppliers will negotiate—they’d rather have you pay on 60-day terms consistently than worry about late payments.

Centralize and Batch AP Processing

Pay invoices in batches on a set schedule (twice weekly or weekly) rather than immediately upon receipt. This captures the full payment term benefit without any supplier friction, and reduces your team’s administrative burden.

Avoid Early Payment Unless There’s a Discount

Only pay early if you’re capturing a meaningful early-payment discount (2% or more). Otherwise, let every dollar sit in your account until the payment due date. This discipline alone can improve your DPO by 10–15 days.

The Cash Conversion Cycle: Your Master KPI

The Cash Conversion Cycle (CCC) synthesizes all three working capital levers into a single number:

CCC = DSO + DIO − DPO

A negative CCC—which Amazon famously achieved at scale—means you’re collecting cash from customers before you have to pay suppliers. Most SMBs won’t get there, but directionally, every improvement matters.

IndustryTypical CCCBest-in-Class CCC
Software / SaaS0–15 daysNegative (subscription prepay)
Professional Services30–50 days<20 days
Retail30–60 days<25 days
Manufacturing60–90 days<45 days
Construction60–120 days<60 days

Build CCC into your financial dashboard as a monthly KPI. Track it alongside DSO, DIO, and DPO so you can quickly see which lever is moving in the wrong direction before it becomes a cash crisis.

Working Capital Financing Tools

Even with excellent working capital management, seasonal businesses and high-growth companies often need external financing to bridge timing gaps. Here are the main tools, compared:

ToolBest ForCost RangeKey Consideration
Revolving Credit LineGeneral working capital bufferPrime + 1–3%Requires strong banking relationship, covenants
Invoice FactoringImmediate cash on receivables1.5–5% of invoice valueFast but expensive; client notification required
Invoice DiscountingConfidential receivables financing2–4% annualizedCheaper than factoring, you maintain collections
Supply Chain FinanceExtending payables with supplier consentFunded by buyer’s credit ratingWin-win: supplier gets paid fast, buyer extends DPO
Inventory FinanceProduct businesses with large stock needs8–15% annualizedAsset-secured; good for seasonal builds

The goal of working capital optimization is to minimize your reliance on these tools—but when you do use them, use them strategically. A well-structured revolving credit line costs far less than repeated late-payment penalties or missed growth opportunities. A fractional CFO can help you access the right facility at the right rate. Learn more about how investor-ready financials make it easier to secure favorable working capital financing.

Working Capital Optimization Checklist

  • ☐ Calculate current DSO, DIO, DPO, and CCC
  • ☐ Benchmark against industry averages
  • ☐ Move to automated invoicing with embedded payment links
  • ☐ Require 25–50% deposits on large projects
  • ☐ Implement 7/14/30-day AR follow-up sequences
  • ☐ Offer early payment discounts on key accounts
  • ☐ Run ABC analysis on inventory; reduce C-item safety stock
  • ☐ Build 3–6 month demand forecasts by SKU
  • ☐ Liquidate all inventory with no movement in 90+ days
  • ☐ Review top 10 suppliers for term extension opportunities
  • ☐ Establish twice-weekly AP payment batching
  • ☐ Add CCC to monthly management reporting
  • ☐ Review working capital financing options if CCC > 60 days
  • ☐ Present working capital metrics in board reporting

Take Action on Working Capital Today

Working capital optimization isn’t a one-time project—it’s an ongoing discipline that compounds over time. The businesses that get this right build a self-funding growth machine: faster collections, leaner inventories, and stretched payables fund growth without requiring external capital at every turn.

If you’re not sure where to start, or your CCC is stubbornly above benchmark despite your best efforts, a fractional CFO can diagnose the specific friction points in your working capital cycle and build a 90-day action plan to fix them.

Book a free consultation

FAQ

What is working capital optimization?

Working capital optimization is the process of managing your current assets (receivables, inventory, cash) and current liabilities (payables) to maximize the efficiency of your operating cash cycle. The goal is to minimize the time between spending cash on operations and collecting cash from customers—reducing your need for external financing and improving liquidity.

How do I calculate my Cash Conversion Cycle?

CCC = Days Sales Outstanding (DSO) + Days Inventory Outstanding (DIO) − Days Payable Outstanding (DPO). DSO measures how quickly you collect from customers; DIO measures how long inventory sits before sale; DPO measures how long you take to pay suppliers. A lower or negative CCC means your business generates cash faster than it consumes it.

What is a good working capital ratio?

A current ratio (current assets ÷ current liabilities) of 1.5–2.0 is generally considered healthy for most SMBs. Below 1.2 signals potential liquidity stress; above 2.5 may indicate excessive idle assets. However, the ratio must be interpreted in context—a SaaS business with negative deferred revenue working capital can be perfectly healthy despite a low ratio.

How can I free up cash without taking on debt?

The most effective no-debt levers are: (1) collecting receivables faster through better invoicing and follow-up; (2) reducing inventory to lean levels through demand forecasting; (3) extending payables to the full terms negotiated with suppliers. Together, these three levers can often free up 30–60 days of operating expenses in cash without a single dollar of new borrowing.

When should I hire a CFO to help with working capital?

If your CCC is above industry benchmark and self-directed efforts haven’t moved the needle, or if you’re growing rapidly and need to build working capital systems that scale, a fractional CFO is usually the most cost-effective option. They’ll diagnose the specific levers in your business, implement the right processes, and often pay for themselves many times over through cash freed up and financing costs avoided.

Share this:

Unlock profitability with industry-specific financial analysis

Industry-Specific Margin Benchmarks

IndustryGross Margin / Key Metric
SaaS / Software70-85% gross margin (Bessemer)
Professional services40-60% gross margin, 60-75% utilization target
Restaurants60-70% gross margin, 3-9% net margin
Retail (specialty)30-50% gross margin, 2-6% net margin
Manufacturing25-45% gross margin, 5-10% net margin
Construction15-30% gross margin, 3-8% net margin
Distribution / Wholesale15-30% gross margin, 2-5% net margin
Healthcare services40-60% gross margin, 8-15% net margin

Most business owners run their finances using generic rules of thumb, comparing their margins to national averages or whatever benchmark shows up first in a Google search. That approach is not just imprecise; it can actively mislead you. A 20% gross margin looks like a red flag in SaaS but signals decent health in grocery retail. Industry-specific benchmarks are the only reliable foundation for meaningful financial decisions. This guide walks you through the frameworks, key ratios, and practical applications that SMB owners need to stop guessing and start improving profitability with real precision.

Table of Contents

Key Takeaways

PointDetails
Industry context is crucialComparing your business only to peer benchmarks unlocks real financial insight and avoids costly mistakes.
Use sector-specific KPIsGross margin, current ratio, DSO, and other key metrics should always be measured against industry benchmarks.
Outsourced CFOs add valueThey deliver holistic analysis, dashboards, and strategy tailored to your industry for a fraction of the full-time cost.
Dashboards enable actionKPI dashboards provide real-time clarity, helping you spot trends and improve profitability before issues escalate.
Turn analysis into resultsApply industry-specific insights to pricing, cost controls, and receivables to drive meaningful profit growth.

Why industry context matters in financial analysis

When you apply a ratio without sector context, you are essentially using a thermometer to measure wind speed. The tool is real, but the reading is meaningless. Key ratios like gross margin or current ratio mean fundamentally different things depending on your industry’s cost structure, payment cycles, and capital intensity.

Take gross margin as a straightforward example. A SaaS company delivering software to thousands of customers with minimal incremental cost can realistically achieve 70 to 80% gross margins. A retail clothing store managing physical inventory, returns, and storage costs might celebrate a 45% gross margin. If the clothing store owner benchmarks against SaaS peers, they will feel perpetually behind on a race they were never running.

The current ratio, which measures short-term assets against short-term liabilities, also tells a different story by sector. For most manufacturers, a current ratio above 1.5 signals solid liquidity. For grocery chains that collect cash before paying suppliers, ratios below 1.0 are perfectly normal and healthy. Context is everything.

“A 30% net margin is extraordinary in professional services but a warning signal in distribution, where margins of 3 to 6% are the standard operating range.”

Here is why peer benchmarks matter more than static targets:

  • Realistic goal-setting: Peer data shows what is actually achievable in your market conditions, not what a textbook considers ideal.
  • Investor and lender expectations: Banks and private equity firms evaluate you against sector norms. Exceeding or falling below those norms triggers scrutiny.
  • Trend spotting: A ratio moving away from your sector’s average over several quarters is an early warning system, even if the absolute number still looks acceptable.
  • Negotiating power: Understanding where you sit in your competitive landscape strengthens your position in pricing, supplier negotiations, and financing discussions.

To get the most out of financial metrics for SMBs, you need to pair every ratio with its industry-specific green zone and track movement over time, not just a single snapshot.

Pro Tip: Never benchmark yourself against a company in a different business model, even within the same broad industry. A franchise restaurant and a fine-dining independent operate on completely different economic structures.

Core financial metrics and how to benchmark them

Understanding which ratios to prioritize saves you from drowning in spreadsheet noise. Below are the six metrics that drive the most strategic decisions for SMBs, along with what healthy looks like by sector.

“SME net profit ranges 5 to 15%, SaaS gross margin hits 75%, retail sits at 28%, and cafes land between 60 and 70%, proving that context is everything.”

IndustryGross MarginNet MarginCurrent RatioDSO (days)Debt-to-Equity
SaaS / Tech70 to 80%10 to 25%1.5 to 3.030 to 45Low (0.3 to 0.8)
Retail25 to 50%2 to 6%1.2 to 2.05 to 15Moderate
Cafes / Food60 to 70%3 to 9%0.8 to 1.5N/A (cash)Moderate to High
Manufacturing20 to 40%4 to 10%1.5 to 2.540 to 60Higher accepted
Professional Services40 to 70%10 to 20%1.5 to 2.530 to 50Low

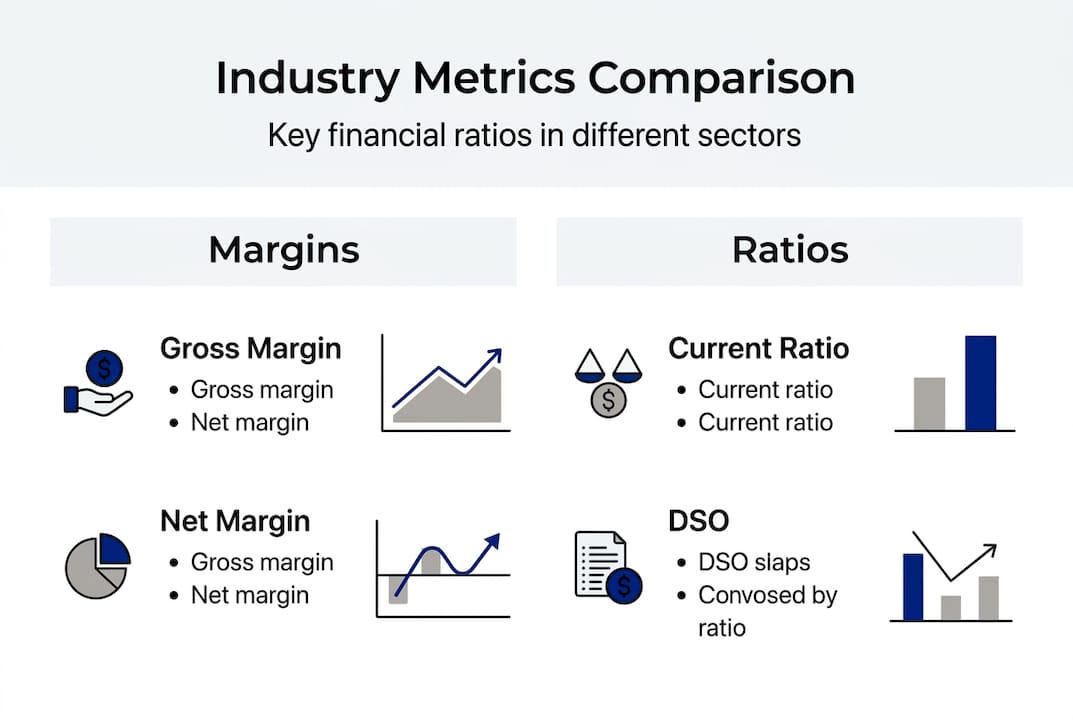
Infographic comparing core financial metrics

According to the 2026 small business revenue report, industry benchmarks continue to shift year over year, making it critical to refresh your reference points annually rather than relying on data from three years ago.

Here is a quick reference for when each metric takes priority:

  • Gross Profit Margin: Always top priority when evaluating pricing strategy or product mix decisions.
  • Net Profit Margin: Critical for owner distributions, investor reporting, and assessing overall business sustainability.
  • Current Ratio: Front and center when managing cash flow or approaching a line of credit renewal.
  • Debt-to-Equity: Key when planning capital investments or seeking growth financing.
  • DSO (Days Sales Outstanding): Essential for any business extending credit terms, measured as DSO under 40 to 60 days for most sectors.
  • DIO (Days Inventory Outstanding): A top lever for manufacturers and retailers managing working capital.

For businesses serious about tracking key KPIs consistently, building a monthly dashboard that flags deviations from sector norms is far more effective than reviewing static reports quarterly.

How outsourced CFOs tailor analysis to your industry

Knowing what to measure is one thing. Knowing how to interpret it, model it, and act on it is where most SMB owners hit a wall. That is exactly the gap an outsourced CFO fills without the $200,000-plus annual salary of a full-time hire.

Outsourced CFO creating scenario plan

Outsourced CFO methodologies include financial modeling, scenario planning, 13-week cash flow forecasting, and KPI dashboard visualization, all customized to your industry’s specific drivers. A SaaS CFO focuses on monthly recurring revenue, churn rate, and customer acquisition cost payback. A manufacturing CFO prioritizes throughput, overhead absorption, and inventory turns. The tools are similar; the calibration is completely different.

FeatureOutsourced CFOFull-time CFO
Monthly cost$3,000 to $25,000$200,000+ per year
Engagement flexibilityProject or ongoingFixed employment
Industry specializationSelector-based expertiseGeneral background
ScalabilityScales with business needsFixed capacity
Onboarding speedWeeksMonths

The cost comparison alone makes outsourced CFO services attractive, but the real value is in the methodology. Here is how a skilled outsourced CFO typically approaches industry-specific analysis:

  1. Audit current reporting: Identify gaps between what you are tracking and what your sector actually requires for meaningful decisions.
  2. Build an industry-calibrated model: Develop financial models using your sector’s cost structure, revenue drivers, and working capital patterns.
  3. Set sector-appropriate KPI targets: Define what ‘good’ looks like for your specific business, not the industry average alone.
  4. Implement real-time dashboards: Replace monthly static reports with live data tools that surface issues as they emerge.
  5. Run scenario and sensitivity analysis: Test how changes in pricing, volume, or costs affect profitability under your industry’s actual constraints.

If you want to see how this process works in practice, the custom financial modeling processes that drive real SMB growth are worth reviewing. For businesses focused on the bottom line, management for SME profitability covers how ongoing financial oversight compounds gains over time.

Pro Tip: Customizing your analysis framework to your industry reduces the risk of acting on a metric that looks alarming but is actually normal for your sector, saving both time and costly decisions.

Turning industry analysis into profits: Real-world applications

Frameworks and ratios only matter if they change how you operate. Here is what applying industry-specific analysis actually looks like at the business level.

Consider a retail SMB struggling with cash flow despite decent sales. By benchmarking their Days Inventory Outstanding against sector norms, they discovered they were holding 90 days of stock when the industry average was 45 days. Cutting excess inventory freed up working capital equivalent to three months of operating expenses. That cash went directly into marketing, generating a measurable revenue lift.

A B2B SaaS firm saw their DSO creeping toward 75 days, well above the sector target of 30 to 45. By analyzing which customer segments paid slowest, they restructured billing terms and added automated payment reminders. Collections improved by 40% within two quarters, reducing reliance on their credit line and cutting interest costs.

Here are the core profit levers by industry that analytics can expose:

  • SaaS / Tech: Reduce churn, optimize pricing tiers, and shorten collections cycles.
  • Retail: Align inventory to DIO benchmarks, improve supplier payment terms, and analyze product-level margins.
  • Food and beverage: Control food cost percentages, manage labor scheduling, and monitor table turn rates.
  • Manufacturing: Improve throughput, reduce scrap rates, and optimize overhead absorption.
  • Professional services: Bill more hours, reduce unbilled work in progress, and manage project profitability by client.

Tracking the right metrics consistently is what makes these levers accessible. SMB average revenue sits around $672,000 annually, but IT-sector businesses average $185,000 per month, a gap explained almost entirely by industry-specific economics and how effectively owners leverage financial data.

For businesses ready to move from awareness to execution, mastering financial KPIs is where that translation happens. You can also reference small business earnings data for current sector-level context to validate your own targets.

Pro Tip: Use a KPI dashboard updated at least weekly to catch trends early. A DSO that climbs 10 days over two months is far easier to reverse than one that has drifted for an entire year.

The uncomfortable truth about financial benchmarks

Here is what most articles about benchmarks will not tell you: the average benchmark is the least useful number in the dataset. Aiming for the industry average means aiming to be mediocre by definition. The businesses we see actually improving profitability are not chasing averages. They are identifying which specific metrics their sector’s top performers prioritize and closing the gap on those alone.

The second mistake is treating benchmarks as static. Markets shift. A gross margin that was competitive in 2022 might be genuinely weak today. Cross-industry margin comparisons are unreliable, but so are outdated same-industry benchmarks. You need current data paired with current trend analysis, not a number from a report three years old.

Spreadsheets also create a false sense of precision. A number is not an insight. Context, direction, and causation are insights. Business intelligence tools and expert guidance surface what raw data cannot: why a ratio is moving and what to do next. Exploring the benefits of SME CFO services shows how structured oversight turns numbers into decisions that actually shift outcomes.

Next steps: Get actionable industry-specific insights

Understanding your financial position relative to your sector is the starting point, but sustaining improvement requires ongoing analysis, not a one-time checkup. If the frameworks in this guide clarified what you should be measuring, the next step is building the systems to measure it consistently.

https://johngalt-finance.com

John Galt Finance helps SMBs implement exactly this kind of structured, industry-calibrated financial oversight. From business financial planning to a detailed cash flow forecasting guide and custom financial modeling solutions, the platform is built for business owners who want CFO-level insight without the full-time overhead. Book a diagnostic session to see exactly where your numbers stand against your sector’s benchmarks.

Frequently asked questions

What are the most important financial ratios for my industry?

Gross profit margin, net profit margin, and current ratio are essential starting points, but the target values vary significantly by sector. Industry-specific ratios like a 75% gross margin for SaaS versus 28% for retail illustrate why sector benchmarks must anchor your interpretation.

How can I tell if my margins are healthy?

Compare your margins directly to recent data from businesses in your same sector, not generic business rules. Empirical benchmarks confirm that SaaS gross margins average 75% and cafes land between 60 and 70%, so your reference point must match your business model.

What does an outsourced CFO do differently from my accountant?

Your accountant records and reports what happened. An outsourced CFO uses modeling, scenario planning, forecasting, and KPI dashboards to guide what should happen next, with strategies built around your specific industry’s economics.

How much do outsourced CFO services cost for SMEs?

Outsourced CFO fees typically run from $3,000 to $25,000 per month depending on scope and complexity. That is a significant difference from the $200,000-plus annual cost of a full-time hire, making it accessible for most growth-stage SMBs.

Why isn’t comparing my business to other industries reliable?

Every industry operates on different cost structures, payment cycles, and capital requirements, so a ratio that signals health in one sector can indicate serious risk in another. Avoid cross-industry comparisons and always anchor your analysis in peer-level, sector-matched benchmarks.

FAQ

Why do industry benchmarks matter for SMBs?

Generic financial advice fails because cost structures vary dramatically. A 25% gross margin is excellent in distribution and a disaster in SaaS. Without industry context, you can’t tell whether you’re winning or losing.

Where can I find reliable industry benchmarks?

RMA Annual Statement Studies (gold standard, paid), BizMiner (paid), IBISWorld (paid), and your trade association’s annual benchmarking report. Avoid free benchmarks aggregating data across all revenue tiers; they’re skewed by large companies and useless for SMBs.

What if my margins are below industry benchmark?

Run a three-step diagnostic: (1) pricing audit (are you under-pricing vs competitors?), (2) cost analysis (which COGS lines are above benchmark?), (3) customer mix (are low-margin customers dragging average down?). See our profit margin analysis framework.

How often should I rebenchmark?

Annually for industry medians, quarterly for your own trend. Industries shift; the 2020-2023 cost inflation reset benchmarks across most sectors. Anchoring to a 2019 benchmark in 2026 is a real risk.

What financial metrics matter most by industry?

SaaS: ARR, NRR, CAC payback. Services: utilization, billing rate, project margin. Retail: same-store sales, inventory turns, gross margin %. Manufacturing: OEE, gross margin, working capital days. Pick 5-7 KPIs specific to your model; generic KPIs miss what matters. See our SaaS financial metrics guide for SaaS depth.

Share this:

CFO-Led Financial Analysis: Smarter SME Decisions

CFO-Level Analysis Cadence & Outputs

Analysis TypeCadenceOutputDecision Driven
Cash flow forecast (13-week)WeeklyRolling liquidity viewHire freeze, debt draw, AR push
P&L variance vs. budgetMonthlyVariance commentaryOpEx cuts, re-forecast
Unit economics reviewMonthlyCAC, LTV, payback by segmentChannel mix, pricing
Pricing & margin analysisQuarterlyMargin by SKU/customerPrice changes, SKU rationalization
Scenario planningQuarterlyBest/base/downside modelHeadcount, capex commitments
Working capital reviewMonthlyDSO/DPO/DIO trendsCollections push, supplier terms
Cohort & retention analysisQuarterlyRevenue retention by cohortProduct investment, churn fixes

Most business owners treat their monthly profit-and-loss statement like a rearview mirror. It shows where you’ve been, but tells you almost nothing about where you’re headed. CFO-led financial analysis flips that model entirely. Instead of waiting for quarterly reports to reveal problems that already cost you money, it puts forward-looking, strategy-driven insights at the center of every major decision. For SMEs competing in fast-moving markets, this shift from reactive to proactive financial management isn’t a luxury. It’s the difference between growing deliberately and guessing your way forward.

Table of Contents

Key Takeaways

PointDetails
CFO-led analysis essentialsIt focuses on real-time, actionable insights so you can make better business decisions at speed.
Unique SME valueSmall and medium businesses benefit from proactive, scenario-driven financial analysis, not just periodic reports.
Balance speed and rigorQuality insights require efficient but disciplined analysis—avoid shortcuts that could hide financial risks.
Tools and frameworks matterUsing CFO-level frameworks and modern tools enables agility and more accurate forecasting.

What is CFO-led analysis?

CFO-led analysis is the practice of applying senior financial leadership to interpret business data in ways that directly inform strategy. It goes well beyond preparing financial statements or checking compliance boxes. A CFO frames financial data around the questions that actually matter to your business: Where is margin eroding? Which clients or products drain cash? What does the next 90 days look like if revenue slows by 20%?

Here’s what makes CFO-led analysis distinct from standard financial review:

  • Forward-looking by design. Instead of explaining what happened last quarter, it models what’s likely to happen next.
  • Customized to your strategy. Analysis is built around your specific growth goals, cost structure, and risk tolerance, not a generic template.
  • Grounded in scenario modeling. CFOs run multiple “what if” scenarios so you can make decisions with full visibility into the range of outcomes.
  • Tied to real-time metrics. Rather than waiting for month-end close, CFO-led analysis tracks live KPIs that signal problems early.

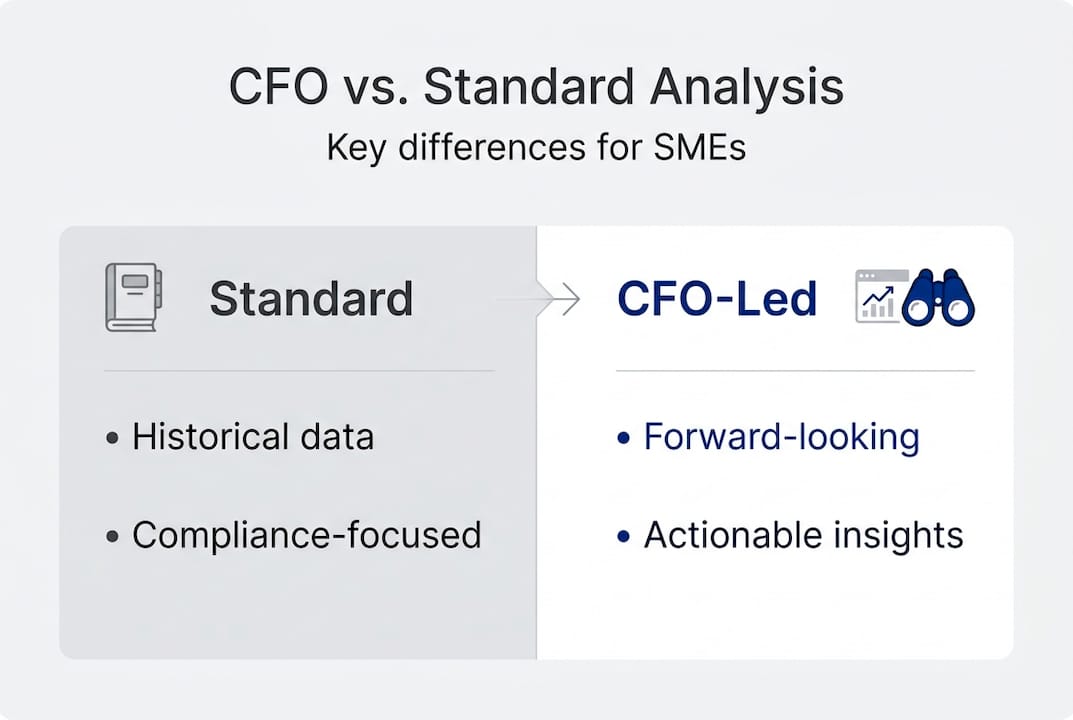
Standard financial analysis typically focuses on historical data, compliance reporting, and accurate bookkeeping. It answers, “What happened?” CFO-led analysis answers, “What should we do next and why?”

For SMEs, this distinction is critical. Research shows that CFOs influence accounting conservatism, shaping how quickly bad news surfaces in financial reports. That means the quality of your financial insight is directly tied to how your CFO structures and interprets the analysis, not just the numbers themselves.

Infographic comparing standard and CFO-led analysis

If you’ve noticed that your current financials feel disconnected from the real pressures in your business, it may be time to review the signs your business needs a CFO. And if you’re weighing whether a full-time hire is necessary, the value of CFO services for SMEs makes a strong case for flexible, outsourced options.

Pro Tip: Define your analysis scope around specific decision points, not just financial periods. Instead of asking “How did Q2 go?”, ask “What’s driving the margin gap in our top product line, and what are our options?”

The CFO skill set: What expertise drives analysis?

Not all financial professionals deliver the same level of insight. The gap between a bookkeeper, a controller, and a CFO isn’t just seniority. It’s a fundamentally different way of engaging with financial data.

Bookkeeper and CFO working in shared office

CFOs combine technical accounting knowledge with strategic forecasting, stakeholder communication, and scenario-building skills. They’re trained to balance speed against depth. Move too fast, and analysis quality suffers. Move too slow, and decisions get made without the right information. Research confirms that powerful CFOs influence the efficiency and quality trade-off in financial analysis, which is why who leads your analysis matters as much as the process itself.

AreaAccountant/ControllerCFO
Primary focusAccuracy and complianceStrategy and growth
Reporting styleBackward-lookingForward-looking
Key deliverableFinancial statementsForecasts, scenarios, KPIs
Decision supportHistorical summariesAction-ready recommendations
Risk managementFlags past issuesModels future risks

Strategic decisions a CFO-led analysis directly supports include:

  • Pricing strategy based on real margin analysis across products or services
  • Investment timing tied to cash flow cycles and projected returns
  • Cost management by identifying underperforming cost centers
  • Hiring decisions grounded in revenue-per-employee and capacity modeling
  • Fundraising readiness based on clean financial models and clear growth story

Understanding these bookkeeper vs CFO differences helps clarify why upgrading your financial leadership changes the quality of every business decision downstream. Pairing that leadership with consistent tracking of key financial metrics for SMEs creates a feedback loop that keeps strategy grounded in reality.

Pro Tip: When you meet with your financial team, don’t just ask for numbers. Ask, “What action should we take based on this data?” If they can’t answer that, your analysis process needs upgrading.

How CFO-led analysis improves business decision-making

The real value of CFO-level insight shows up when your business faces a fork in the road. Should you expand to a new market? Cut a product line? Take on debt to fund growth? Here are five concrete ways CFO-led analysis makes those calls sharper.

  1. Cash flow optimization. A CFO maps the timing of inflows and outflows to prevent cash gaps before they happen, not after payroll is at risk.
  2. Risk identification. By stress-testing your financials against adverse scenarios, CFO-led analysis spots vulnerabilities that look fine on a standard P&L.
  3. Scenario planning. You get three versions of the future (base, upside, downside) so decisions are never made on a single assumption.
  4. Investment timing. CFOs align capital spending with projected cash availability and revenue cycles, preventing overextension.
  5. Rapid response to market shifts. When conditions change fast, real-time tracking means you can adjust pricing, spending, or staffing before damage compounds.

“Balancing efficiency and analysis quality is crucial to avoid impaired decision-making in rapidly shifting business environments.”

This balance matters especially when liquidity tightens. Monthly reviews are fine during stable periods, but they’re dangerously slow during a cash crunch. Connecting your financial data to a financial dashboard lets you track these signals continuously rather than waiting for month-end surprises. For SMEs working to protect margins while scaling, pairing CFO insight with disciplined SME profitability management creates a compounding advantage.

Pro Tip: During any period of cash flow stress, review your cash flow statement daily. A single large receivable delay can cascade into payroll risk within days if you’re not tracking it.

CFO-led analysis in action: Frameworks, tools, and SME use cases

CFO analysis isn’t abstract. It runs on specific frameworks and tools that translate raw financial data into clear guidance.

The two cash flow methods compared:

MethodApproachBest use case
Indirect methodStarts from net income, adjusts for non-cash itemsAnnual planning, investor reporting
Direct methodTracks actual cash inflows and outflowsTight liquidity, daily or weekly monitoring

Research on CFO power and conditional conservatism shows that flexible, real-world analysis often requires shifting between these methods depending on business conditions. When cash is tight, the direct method gives you the granular, transaction-level visibility you need.

Core frameworks CFOs apply include:

  • Scenario modeling: Build three financial futures (optimistic, base, pessimistic) and map your decisions to each.
  • Variance analysis: Compare actual results to budget and forecast, then explain the gaps with specific business causes.
  • Rolling forecasts: Replace static annual budgets with forecasts that update monthly, keeping your plan current.
  • Key metric tracking: Focus on 5 to 8 metrics that directly predict business health: gross margin, burn rate, days sales outstanding, and similar.

Tech tools that support CFO-level analysis in SME environments include ERP integrations like NetSuite or QuickBooks Online, cash flow platforms like Float or Pulse, and business intelligence dashboards such as Fathom or Spotlight Reporting.

A practical example: an SME with 60-day receivables and 30-day payables will experience a chronic cash gap. A CFO using the direct method and a rolling forecast can model that gap precisely, then recommend invoice financing, adjusted payment terms, or a credit facility before the business hits a wall. A complete cash flow forecasting guide walks through exactly this kind of scenario. For project-based businesses in particular, cash flow for project-based businesses offers industry-specific strategies that map directly to CFO-level planning.

The overlooked power and risk of CFO-led analysis

Here’s what most articles on CFO analysis won’t tell you: more financial sophistication can actually introduce new blind spots if you’re not careful.

When CFOs are empowered and well-aligned with business goals, they drive agile, forward-looking analysis that genuinely accelerates growth. They cut through noise, prioritize the right metrics, and give leadership the confidence to act. That’s the upside most people talk about.

But there’s a tension worth naming. Research suggests that powerful CFOs may reduce accounting conservatism to present results more favorably, which can delay recognition of financial trouble. In practice, this shows up as over-optimistic forecasts, slow acknowledgment of a declining product line, or deferred write-downs that make the balance sheet look healthier than it is.

The lesson isn’t to distrust your CFO. It’s to build a structure where financial rigor and strategic agility coexist. Establish regular three-way reviews between the CEO, CFO, and board or advisory group. Require that bad news surfaces as fast as good news. Reward early warnings, not just polished forecasts. The SMEs that get the most out of CFO-led analysis are those that treat it as a discipline, not just a service.

Supercharge your SME with CFO-level expertise

CFO-led analysis gives you something rare: the ability to see your business clearly and act before problems become crises. It replaces gut-feel decisions with structured, data-backed strategy.

https://johngalt-finance.com

At John Galt Finance, we bring that level of insight directly to SMEs that aren’t ready for a full-time CFO but can’t afford to operate without one. Our custom financial modeling process is built around your specific business, not a template. We offer ongoing KPI tracking, cash flow forecasting solutions, and hands-on CFO support tailored for businesses in your revenue range. Explore our essential financial models or reach out to start with a business health check today.

Frequently asked questions

How is CFO-led analysis different from regular financial analysis?

CFO-led analysis is proactive and forward-looking by design, using forecasting and scenario planning tied to your business goals, whereas standard financial analysis focuses on historical reporting and compliance.

When should an SME consider shifting to high-frequency financial tracking?

If your business is experiencing cash flow stress or rapid change, shift to weekly or even daily cash tracking for the real-time visibility needed to respond before problems escalate.

Does CFO-led analysis apply only to large companies?

No. SMEs gain strategic and operational value from CFO-level insight just as much as large firms, particularly when it comes to cash flow control, smarter planning, and identifying growth opportunities.

What are the risks of relying solely on CFO-led analysis?

Excessive CFO influence can delay recognizing bad news, so pairing CFO analysis with independent reviews and board-level checks keeps financial reporting honest and timely.

FAQ

What’s the difference between bookkeeping reports and CFO-led analysis?

Bookkeeping reports show you what already happened (P&L, balance sheet, AR aging). CFO-led analysis explains why it happened, what it predicts, and what to do about it. A P&L says “gross margin dropped 3 points.” A CFO analysis says “gross margin dropped because customer mix shifted toward Segment C, which has 12-point lower margin. Recommend price adjustment by July 1 or de-emphasize the channel.”

Which financial analysis matters most for SMBs?

In order of impact for $1M-$20M businesses: (1) 13-week cash flow forecast, (2) unit economics by customer/channel, (3) pricing and margin analysis, (4) working capital cycle, (5) cohort retention (for recurring revenue businesses). These five drive 80% of executable decisions. Everything else is supporting context.

How do I make sure financial analysis actually drives decisions?

Tie every analysis to a specific decision and owner. Don’t produce a margin report unless someone is empowered to change pricing or kill SKUs. Don’t run a cash flow forecast unless someone can pull levers (collect AR, delay AP, draw credit). Reports without owners become wallpaper. Best practice: every monthly finance pack ends with a “Decisions Needed” page listing 3-5 items.

What KPIs should I see on my dashboard daily?

For most SMBs: (1) cash balance and 30-day forward forecast, (2) MTD revenue vs. monthly target, (3) gross margin run rate, (4) AR over 60 days, (5) one or two operating KPIs specific to your model (e.g., MRR for SaaS, ad ROAS for e-commerce, billable utilization for agencies). Five numbers, one screen, updated by 8am.

How long does it take to build CFO-level analysis from scratch?

With a fractional CFO and a competent bookkeeper, you can have a clean monthly close, 13-week cash flow, and basic KPI dashboard within 30-45 days. Unit economics, cohort analysis, and pricing models typically add another 30-60 days. Full strategic finance stack (close + forecast + scenarios + cohort + pricing + board pack) is usually a 90-120 day build for a business at $2-10M revenue.

Share this:

Cash flow management: 60% of SMBs struggle in 2026

SMB Cash Flow Management Benchmarks (2026)

MetricBenchmark
SMBs struggling with cash flow (2026)~60% (US Bank, NFIB surveys)
SMBs that fail from cash flow issues82% (US Bank study)
Median SMB cash buffer days27 days (JPMorgan Chase Institute)
Recommended cash reserve3-6 months opex
Median B2B DSO (US, 2026)40-50 days
13-week forecast accuracy target+/- 10% by week 4
High-yield business savings yield (2026)4.0-5.0% APY
SMBs using AR automation (2026)~45% (up from 25% in 2021)

Six out of ten small businesses experienced cash flow issues in the last 12 months alone. That number should stop you cold. Most owners blame slow sales or rising costs, but the real culprit is often invisible: a broken cash flow cycle that quietly erodes your ability to pay people, grow, and survive. This guide cuts through the noise and gives you practical, CFO-level strategies to take control of your cash flow, spot problems before they become emergencies, and build the financial resilience that separates stable businesses from those constantly scrambling.

Table of Contents

Key Takeaways

PointDetails
Cash flow determines survivalEffective cash flow management keeps your business afloat during tough times and fuels growth during good times.
Forecasting is essentialUsing proven tools and real-time data is the foundation for avoiding costly surprises and making smart decisions.
Proactive planning winsSetting aside reserves and using the right tactics beats scrambling for funding during a crisis.
Adopt a CFO mindsetViewing cash flow as a strategic asset separates thriving companies from those constantly putting out fires.

Why cash flow management matters: The unseen risks revealed

Cash flow is not the same as profit. You can post a strong revenue month and still find yourself unable to make payroll. That disconnect trips up business owners constantly, and the consequences are severe. Poor cash flow management is the leading reason businesses fail, not lack of customers, not bad products. Money coming in at the wrong time relative to money going out is enough to sink a healthy company.

The scary part? Most owners do not recognize the warning signs until the crisis has already started. You might be tracking key business financial metrics like revenue and gross margin while completely ignoring your operating cash cycle. By the time you notice the shortfall, your options are limited and expensive.

“Cash flow problems are not a sign of failure. They are a sign that your systems are not keeping pace with your growth.”

Here is what typically causes the breakdown:

  • Late customer payments that push receivables past 45 or even 60 days
  • Poor forecasting that leaves you surprised by large, predictable expenses
  • Failure to segment funds, mixing operational cash with reserves or tax obligations
  • Reactive borrowing, taking on high-cost debt only when things get desperate
  • Rapid growth that increases costs faster than collections catch up

Understanding when to consider a CFO is one of the smartest moves you can make when these patterns show up. The risk of inaction is not just a bad quarter. It is missed growth opportunities, damaged supplier relationships, and the stress of last-minute crisis financing at the worst possible rates.

Key strategies for effective cash flow management

Once you understand the risks, the next step is building a system that gives you visibility and control. Three proven methodologies stand out: rolling forecasts, cash flow method selection, and cycle optimization.

13-week rolling cash flow forecasts are the gold standard for small businesses. This approach tracks every expected inflow and outflow across the next 13 weeks, updated every week. It gives you an early warning system so you can act before a shortfall hits, not after. You can explore detailed forecasting techniques to build one that fits your business model.

Bookkeeper updating 13-week cash forecast

Here is a quick comparison of the two primary forecasting methods:

MethodBest forKey advantage
Direct methodShort-term, operational viewTracks actual cash movement week by week
Indirect methodLong-term, strategic planningStarts from net income and adjusts for non-cash items

Most SMBs benefit from using both. The direct method for weekly operations, the indirect method for strategic planning and investor discussions.

Beyond forecasting, two metrics deserve your close attention:

  1. Days Sales Outstanding (DSO): How long it takes to collect payment after a sale. Lower is better. If your DSO is creeping past 45 days, your improving accounts receivable process needs attention immediately.
  2. Cash Conversion Cycle (CCC): The total time from spending cash on inventory or services to collecting cash from customers. A shorter CCC means healthier cash flow.

Finally, segment your cash. Do not keep everything in one account. Separate your operational cash, your tax reserves, and your contingency funds. This single habit prevents the all-too-common mistake of spending money that was already spoken for.

Pro Tip: Key methodologies like 13-week rolling forecasts and DSO optimization are not just for large companies. SMBs that adopt these practices outperform peers on cash stability, often by a significant margin. Ask your accountant or custom financial modeling partner to help you set these up properly from the start.

Building resilience: Cash reserves, tech, and proactive tools

Strategies get you organized. Resilience keeps you standing when things go sideways. The difference between a business that weathers a downturn and one that folds is often one thing: preparation before the storm.

Start with reserves. Build 3 to 6 months of operating expenses in liquid reserves, segmented from your working capital. This is not a luxury for large corporations. It is a survival baseline for any SMB with seasonal revenue, major clients, or payment terms longer than 30 days.

Here is a benchmark table to help you assess your current position:

Reserve levelWhat it meansRisk exposure
Less than 1 monthDanger zoneVery high
1 to 2 monthsMinimal bufferHigh
3 to 6 monthsHealthy baselineModerate
6+ monthsStrong resilienceLow

Technology is your second line of defense. Modern accounting platforms and AI-based tools have made real-time cash visibility accessible to businesses of all sizes. Tools like QuickBooks and Float connect to your bank accounts, categorize transactions automatically, and flag anomalies before they become problems. AI-powered forecasting can even model multiple scenarios simultaneously, so you can see the cash impact of winning or losing a major contract.

Key technology practices to implement now:

  • Connect your accounting software to live bank feeds for daily updates
  • Use scenario planning features to stress-test your cash position
  • Set automated alerts for low balance thresholds
  • Benchmark your DSO and CCC against industry peers regularly

Building a credit line before you need it is equally important. Strategic finance for resilience means establishing lender relationships when your financials are strong, not when you are desperate. Crisis borrowing is expensive and puts you at a negotiating disadvantage.

Pro Tip: Review your profitability management tips alongside your cash flow data. A business can be profitable but cash-poor, and vice versa. Looking at both together gives you the clearest picture of financial health.

Turning insight into action: Practical CFO steps for small business owners

Knowing what to do and actually doing it are two different things. Here are the specific actions that move the needle.

  1. Hold a weekly cash review. Block 30 minutes every Monday to review your 13-week forecast. Update it with actual figures and flag any gaps in the next four weeks.
  2. Schedule a monthly working capital meeting. Review accounts receivable aging, accounts payable deadlines, and your reserve balance. Make this non-negotiable.
  3. Run scenario tests quarterly. Ask: what happens if our biggest client delays payment by 30 days? What if we lose a major contract? Model the cash impact before it happens.
  4. Build lender relationships now. Apply for a business line of credit when your cash position is healthy. Use it strategically, not as an emergency lifeline.
  5. Bring in expert oversight. Real-world cash flow transformation rarely happens without a skilled financial partner. An outsourced CFO provides ongoing oversight without the full-time cost.

Proactive measures like established reserves and pre-arranged credit lines consistently outperform reactive crisis financing in both cost and outcome. The businesses that stay calm during downturns are not lucky. They built the systems and relationships in advance.

Additional habits that compound over time:

  • Send invoices immediately upon delivery of goods or services
  • Offer small early payment discounts to accelerate collections
  • Negotiate longer payment terms with suppliers while keeping customer terms tight
  • Review your pricing annually to ensure margins cover cash cycle gaps

Pro Tip: Do not wait for a crisis to get serious about cash flow. The businesses that thrive long-term treat cash management as a weekly discipline, not a quarterly fire drill.

The hard truth most business owners miss about cash flow

Here is the uncomfortable reality we see again and again: most “fixes” businesses apply to cash flow problems are not actually fixes. Pushing customers to pay faster and delaying vendor payments buys you days, not stability. These are band-aids on a systems problem.

The businesses that maintain genuine cash stability share one trait: they invested in systems and relationships before the crisis hit. They built forecasting into their weekly rhythm. They established credit lines when they did not need them. They hired cash flow forecasting wisdom partners who knew what questions to ask.

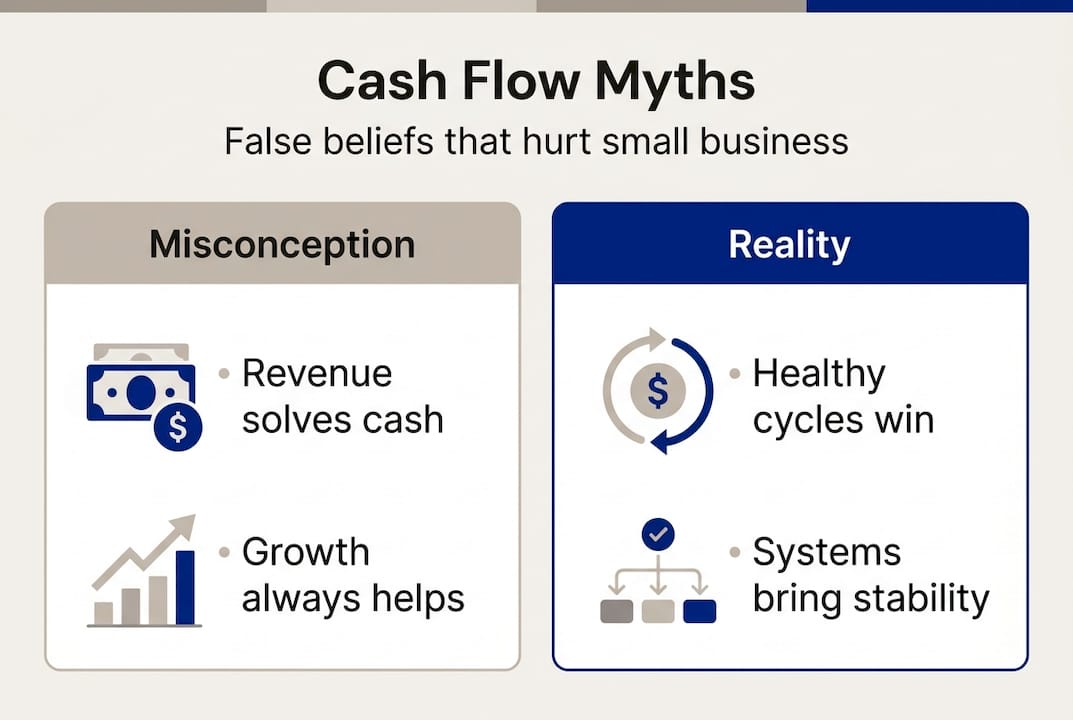
The most dangerous misconception in small business finance is that revenue growth solves cash problems. It often makes them worse. Scaling a broken cash cycle just scales the risk. True financial stability means your cash conversion cycle is tight, your reserves are funded, and your forecast is updated every single week, whether business is booming or slow.

Infographic refuting cash flow misconceptions

Prioritizing healthy cash cycles over vanity revenue metrics is not conservative thinking. It is what separates the businesses still operating in year five from those that closed in year two.

Unlock expert CFO solutions for smarter cash flow management

You now have the framework. But knowing what to do and having the capacity to execute it consistently are two different challenges for a busy business owner.

https://johngalt-finance.com

At John Galt Finance, we work with SMBs just like yours to build detailed cash flow forecasting systems, model the scenarios that keep you up at night, and provide ongoing CFO-level oversight without the overhead of a full-time hire. Whether you need custom financial modeling solutions or simply want a clear picture of where you stand, our team is ready to help. Start with a financial health check for your business and see exactly where your cash flow stands today.

Frequently asked questions

What are the biggest signs of poor cash flow management?

Warning signs include frequently scrambling to cover payroll, delaying vendor payments, and relying on a credit line to pay routine bills. These cash flow disruptions are common but entirely preventable with the right systems in place.

How much cash reserve should my business have?

Most financial experts recommend 3 to 6 months of operating expenses held in liquid reserves, segmented separately from your day-to-day working capital.

What tools and technology help with cash flow management?

AI-powered tools and accounting platforms like QuickBooks and Float provide real-time cash tracking, automated alerts, and scenario-based forecasting that dramatically improve accuracy and decision speed.

How often should I update my cash flow forecast?

Forecast weekly during uncertainty and at a minimum monthly when business conditions are stable. The 13-week rolling model works best when updated every Monday with actual data.

FAQ

Why are 60% of SMBs struggling with cash flow in 2026?

Three drivers: (1) higher interest rates have raised cost of working capital debt, (2) post-pandemic AR cycles remain stretched, (3) inflation has compressed margins faster than pricing has caught up. The solution isn’t to wait it out; it’s to tighten the cash conversion cycle.

What’s the first thing to do if cash is tight?

Build a 13-week direct cash forecast this week. You can’t fix what you can’t see. Then prioritize three actions: (1) call AR over 30 days personally, (2) negotiate net-45 terms with top 5 suppliers, (3) defer any non-essential capex. See our 13-week forecasting guide.

How much cash should an SMB hold in 2026?

3-6 months of operating expenses, parked in high-yield business savings earning 4-5% APY. If you’re seasonal or customer-concentrated, aim for 6-12 months. Below 1 month of cash is a crisis waiting to happen.

Should I take on debt to manage cash flow?

A working capital line of credit (LOC) is standard hygiene; arrange one before you need it. Avoid short-term high-cost products (merchant cash advances, factoring at >20% APR) unless it’s a true emergency. See our SMB funding options guide.

What tools help with cash flow management?

For forecasting: Excel template (free), Float, Pulse, or LiveFlow ($50-300/month). For AR automation: bill.com, Chaser, Upflow. For sweep-to-savings: most major banks now offer auto-sweep at 4-5% APY. Adopting any one of these typically pays back within 90 days.

Share this:

Board Reporting for SMBs: What to Include and Why It Matters

Most small and mid-size business owners dread board meetings. Not because of the discussions — but because they’re never quite sure what to put in front of the board. Board reporting for SMBs is one of those disciplines that separates companies that scale from those that stall. Done right, it builds trust, accelerates decisions, and keeps leadership accountable to a shared plan.

Table of Contents

Key Takeaways

TopicWhat You Need to Know
PurposeBoard reports align leadership, surface risks, and drive decisions — not just information dumps
Core sectionsFinancial summary, KPIs, strategic updates, risks, and asks from the board
FrequencyMonthly for early-stage or fast-growth businesses; quarterly for stable companies
Length5–10 pages max; board members are time-poor — conciseness is a feature
Biggest mistakeReporting what happened without explaining what it means and what happens next

Why Board Reporting Matters for SMBs

Many small business owners treat board reporting as a formality — something done to satisfy investors or advisors. That’s a missed opportunity. Board reporting for SMBs is one of the most powerful tools a leadership team has to enforce discipline, maintain strategic focus, and build accountability.

Here’s what strong board reporting actually does:

  • Forces clarity: Preparing a board report requires you to synthesize what’s actually happening in the business — not just feel it.
  • Builds investor confidence: Investors don’t just fund ideas. They fund teams they trust. Consistent, clear reporting builds that trust.
  • Surfaces problems early: Structured reporting cycles catch declining trends before they become crises.
  • Aligns leadership: When every department head contributes to the board report, it creates shared ownership of results.

Companies that invest in strong board reporting processes consistently outperform those that don’t — not because reporting itself drives revenue, but because the discipline behind it does. A fractional CFO often owns this process end-to-end, ensuring that board reporting becomes a strategic asset rather than an administrative burden.

What Every SMB Board Report Must Include

There is no one-size-fits-all board report, but there is a universal framework that works across industries and growth stages. Every effective board report for SMBs has five core sections:

1. Executive Summary

Start with a one-page summary: what happened since the last meeting, where the company stands today, and the two or three decisions you need from the board. This section should stand alone — a board member who reads nothing else should know the current state of the business.

2. Financial Highlights

This is the heart of any board report. Cover revenue, gross margin, EBITDA or operating profit, cash position, and burn rate (if applicable). Always compare actuals to your budget and to the same period last year. A single-page financial dashboard — like the kind described in our guide to building a financial dashboard for your business — can communicate all of this clearly without overwhelming the reader.

3. KPIs and Operational Metrics

Select 5–8 metrics that are most important to your business model. For a SaaS business, that might be MRR growth, churn, and CAC payback. For a services firm, it might be utilization rate, pipeline value, and client NPS. Present these with a trend — not just the current number.

4. Strategic Priorities Update

Report against the strategic initiatives the business committed to for the quarter or year. Use a simple RAG status (Red/Amber/Green) for each initiative. If something is red, explain what you’re doing about it. This is where you demonstrate leadership, not just management.

5. Risks, Issues, and Board Asks

Be explicit about the risks on your radar. Boards hate surprises. A risk you’ve identified and are managing inspires confidence; a risk that surfaces without warning destroys it. End with a clear list of what you need from the board — introductions, decisions, approvals, or advice.

The Financial Section: Numbers That Tell a Story

Most founders under-invest in the financial section of their board reports. They either dump raw data without context, or they present only the good news. Neither approach builds credibility.

Revenue and Growth

Show revenue by segment if possible — product line, geography, or customer type. Show month-over-month and year-over-year trends. If growth has slowed, explain why and what you’re doing about it. Context is everything.

Gross Margin

Gross margin tells your board how efficiently you’re delivering your product or service. A declining gross margin is often an early warning sign of pricing pressure, cost creep, or a product mix shift. Track it carefully and explain any movement beyond 2–3 percentage points.

Cash and Runway

Cash is always a board-level concern. Show your current cash balance, your monthly burn rate (if relevant), and your projected runway. If you’re within six months of needing additional capital, your board needs to know now — not at the next meeting. See our post on how to prepare your financials for fundraising for a deeper dive on what investors look for in financial packages.

Actuals vs. Budget

The most powerful financial discipline you can build into SMB board reporting is variance analysis. Show actuals vs. budget for the key lines. Explain variances over 10% — whether favorable or unfavorable. This signals to your board that you have a handle on your numbers, not just your intentions.

Sample Financial Summary Table

MetricBudgetActualVarianceCommentary
Revenue$850K$812K-4.5%One deal pushed to Q3
Gross Margin68%65%-3ppHigher contractor costs in March
Operating Profit$95K$78K-18%Tied to margin pressure above
Cash Balance$420K$398K-$22KWithin acceptable range

Operational Metrics and KPIs

Financial results tell you what happened. Operational KPIs tell you why — and what’s coming. The best boards look at leading indicators alongside lagging financial results.

Choosing the Right KPIs

Not every metric belongs in a board report. Apply a simple test: is this metric directly linked to the company’s strategic goals? Does it predict future financial performance? Can the board take action based on it? If yes to all three, include it. If not, leave it for internal management reporting.

Business TypeKey KPIs to Report
SaaS / SubscriptionMRR, ARR, Churn Rate, CAC, LTV, Net Revenue Retention
Professional ServicesBillable Utilization, Pipeline Value, Win Rate, Revenue per Employee
E-commerceConversion Rate, AOV, Customer Repeat Rate, ROAS, Gross Margin by SKU
Manufacturing / DistributionInventory Turns, Gross Margin by Product, On-Time Delivery, Backlog

For a full breakdown of which SaaS metrics matter most, see our post on SaaS financial metrics every founder must track.

Presenting KPIs Effectively

Always show the trend, not just the number. A churn rate of 3% means nothing in isolation — is it up from 1.5% three months ago, or down from 5%? Direction matters as much as the absolute value. Use a simple three-column layout (prior period / current / target) to make trends immediately visible without requiring a full data analyst to interpret.

Common Board Reporting Mistakes (and How to Fix Them)

After working with dozens of SMBs on their board reporting processes, these are the errors we see most often:

Mistake 1: The Data Dump

Presenting 40 slides of financial tables without a narrative is the fastest way to lose your board’s attention. Every number needs context. “Revenue is up 12% — here’s why and what drives the next 12%” is infinitely more valuable than “Revenue: $1.2M.” The narrative is the value; the numbers are the evidence.

Mistake 2: Only Reporting Good News

Founders sometimes soften bad news or bury it in footnotes. Boards see through this immediately — and it destroys trust. If something isn’t working, say so directly and explain your plan. A board that understands your challenges can help you solve them. One that’s kept in the dark cannot.

Mistake 3: No Clear Ask

Board members are there to help. If you leave every meeting without specific asks — introductions to potential customers, advice on a strategic decision, or approval for a capital allocation — you’re leaving value on the table. Every board report should end with a clear section titled “What We Need From the Board.”

Mistake 4: Inconsistent Format

Switching formats between meetings makes it impossible for board members to spot trends. Agree on a template early and stick to it. Consistency creates institutional memory — your board members will quickly learn where to look for the numbers that matter most to them.

Mistake 5: Late Delivery

Board materials sent the night before the meeting rarely get read. Aim to distribute your board report 48–72 hours in advance. This gives directors time to prepare thoughtful questions and arrive ready to contribute — not just catch up on what happened last quarter.

Frequency, Format, and Delivery

How Often Should You Report?

For most SMBs, the right reporting cadence depends on the pace of change in the business:

  • Monthly: Startups, high-growth businesses, or companies in turnaround. Monthly reporting creates faster feedback loops when the pace of change is high and decisions need to be made quickly.
  • Quarterly: Stable, profitable SMBs with slower-moving business models. Quarterly meetings allow for more strategic discussion with less operational noise.
  • Between meetings: Send a short monthly email update (one page) between formal quarterly board meetings. This keeps directors informed without requiring a full meeting.

Format: What Works Best

Keep it short. Five to ten pages is the right length for most SMB board reports. Use a combination of:

  • Narrative text for the executive summary and strategic sections
  • Charts and graphs for financial trends
  • Tables for KPI comparisons and budget variances
  • RAG status indicators for strategic initiative tracking

Avoid overly designed decks. Clear, consistent formatting beats beautiful slides every time. PDF is usually the preferred delivery format — it’s device-agnostic and doesn’t require special software to open.

Distribution and Governance

Send board materials through a secure channel. Many SMBs use a shared board folder with restricted access. Include materials from key department heads alongside the CEO report — a CFO financial package, a head of sales pipeline report — so the board gets a multi-dimensional view of performance.

Board Report Checklist

Before sending your next board report, run through this checklist to ensure nothing critical is missing:

SectionIncluded?Notes
Executive summary (1 page)Current state + specific board asks
Revenue vs. budget vs. prior yearWith variance commentary
Gross margin trendBy segment if possible
Cash position and runwayMonthly burn clearly stated
5–8 KPIs with trendsPrior period comparison included
Strategic initiative status (RAG)Red items include mitigation plan
Risks and issues logNew risks flagged vs. ongoing
Specific board asksNamed, specific, and actionable
Distributed 48h+ before meetingNot the night before

Strong board reporting doesn’t happen by accident. It requires a finance lead who can synthesize the business’s performance into a coherent narrative and present it in a way that drives action. If your business doesn’t have that capacity in-house, a fractional CFO can own the entire board reporting process for a fraction of the cost of a full-time hire.

For companies preparing for a fundraise, strong board reporting is also a key component of investor due diligence preparation — demonstrating that your business is run with professional rigor. Investors at every stage want to see that you already operate with board-level discipline before they write a check.

Ready to Build Board-Ready Financials?

Board reporting is only as good as the financial infrastructure behind it. If your numbers aren’t clean, your reporting won’t be either — and no amount of formatting will fix that. At John Galt Finance, we help SMBs build the financial systems, dashboards, and reporting processes that boards and investors expect.

Book a free consultation to talk through your board reporting needs and get a tailored roadmap for your business.

Frequently Asked Questions

What is the difference between a board report and a management report?

A management report is operational — designed for internal teams to manage day-to-day performance. A board report is strategic — designed for the board of directors to oversee the business, make governance decisions, and hold leadership accountable. Board reports are shorter, higher-level, and focused on the most important metrics and strategic issues rather than operational detail.

How long should an SMB board report be?

Five to ten pages is optimal for most small and mid-size businesses. Board members are time-poor executives and investors. A report that can be read in 20 minutes before a meeting is almost always better than a 40-slide deck that takes an hour to absorb. Quality of insight matters far more than quantity of data in effective SMB board reporting.

Does an SMB need a formal board to do board reporting?

Not necessarily. Even if your business doesn’t have a formal board of directors, the discipline of board reporting is valuable. Many owner-led SMBs create an advisory group — a mix of investors, mentors, and key stakeholders — and report to them quarterly. The reporting process itself creates accountability and strategic focus regardless of formal governance structure.

What financial metrics must always appear in a board report?

At minimum: revenue (vs. budget and prior year), gross margin, operating profit or EBITDA, cash balance, and runway (if the business is burning cash). These five metrics give a complete picture of financial health. Layer on 3–5 operational KPIs specific to your business model. Avoid reporting everything — a focused report on the metrics that matter is always more valuable than a comprehensive data dump.

How do I handle bad news in a board report?

Report it directly, in the executive summary, not buried at the end. State the issue clearly, explain what caused it, describe what you’re doing about it, and say what you need from the board. Boards consistently report that transparent communication of bad news — with a clear plan — builds more confidence than hiding problems until they become crises. Your board is there to help, but only if you give them the information they need to do so.

Share this:

Why analyze financial position: unlock stability & growth

Financial Position Analysis Benchmarks

MetricBenchmark
Current ratio (healthy SMB)1.5-3.0
Quick ratio (healthy)>1.0
Debt-to-equity ratio (healthy)<2.0
Working capital target (% of revenue)15-25%
Return on assets (top quartile SMB)>10%
Return on equity (top quartile)>15%
Interest coverage ratio (healthy)>3.0
Equity multiplier (healthy)<3.0

Cash flow management is the single biggest challenge for 60% of SMBs, and poor financial management remains the top reason small and medium-sized businesses fail. Yet most owners only look at their numbers when something goes wrong. That reactive approach is exactly what keeps good businesses stuck or, worse, sends them under. This guide breaks down what financial position actually means, why analyzing it regularly is one of the highest-leverage habits you can build, and how to put practical tools to work so your business can grow from a place of clarity, not guesswork.

Table of Contents

Key Takeaways

PointDetails
Early warning systemAnalyzing financial position catches problems before they become crises.
Better strategic decisionsClear financial insights enable smarter investments, hiring, and pricing.
Improved funding oddsStrong analysis and ratios build lender and investor confidence.
Practical tools availableSMBs can use Excel, QuickBooks, or fractional CFOs for effective financial reviews.

What is your financial position, really?

Now that you know how high the stakes are, let’s clarify what “financial position” actually means for your business.

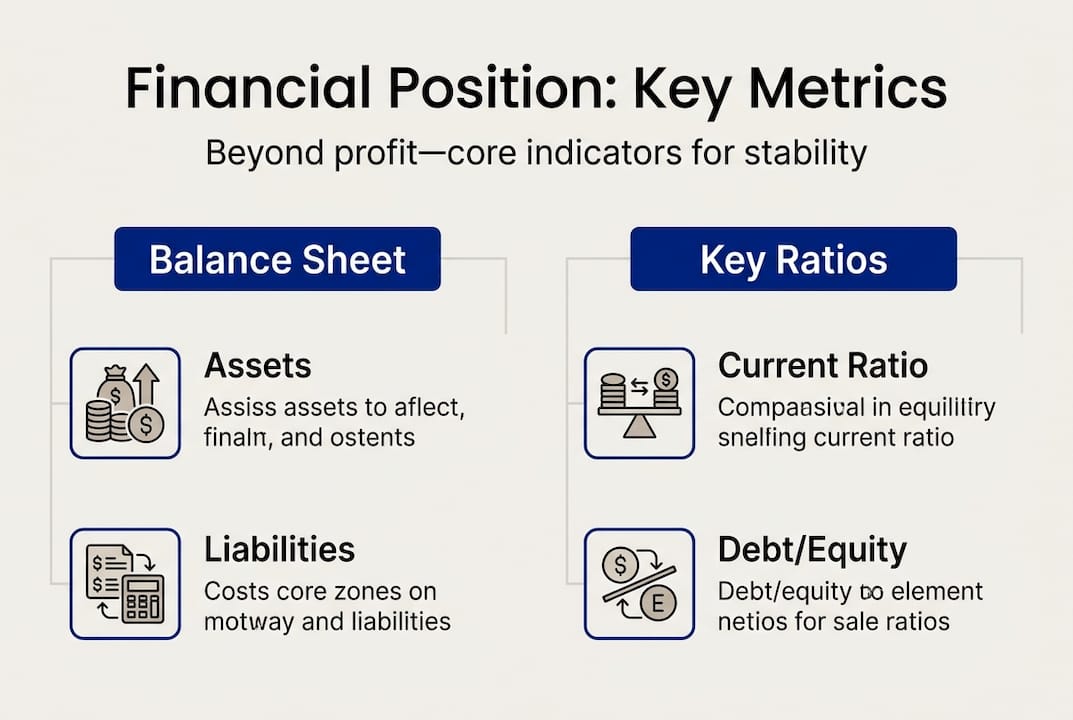
Most owners think of their finances in terms of profit. Did we make money this month? That’s a useful question, but it only tells part of the story. Your financial position is a full snapshot of everything your business owns, owes, and has built up over time. It’s captured in your balance sheet and reflects three core components:

  • Assets: Everything your business owns or is owed. Cash, receivables, inventory, equipment, and property.
  • Liabilities: Everything your business owes. Loans, accounts payable, tax obligations, and accrued expenses.
  • Equity: The residual value left for owners after liabilities are subtracted from assets. Think of it as your financial stake in the business.

Here’s where a common misconception trips people up. A business can show strong profits while sitting on a dangerously weak financial position. How? Imagine you’re generating revenue but most of it is tied up in unpaid invoices or slow-moving inventory. Your income statement looks fine. Your balance sheet tells a different story.

The metrics that reveal your true financial position go beyond profit. Working capital (current assets minus current liabilities) shows whether you can cover short-term obligations. Your debt-to-equity ratio signals how much of the business is financed by creditors versus owners. And your asset base determines your capacity to weather downturns or fund growth.

Infographic summarizing financial position key metrics

Another myth worth busting: being cash-rich in the short term does not mean you’re financially healthy long-term. A business sitting on cash but carrying growing liabilities and stagnant assets is quietly moving toward a cliff. Regular financial analysis surfaces exactly these warning signs, like when liabilities are outpacing asset growth, before they become a crisis.

For owners focused on improving SME profitability, understanding your financial position is the foundation everything else builds on. Profit matters, but stability is what lets you actually use that profit to grow.

Why analyzing financial position matters for your business

Once you understand what financial position truly reflects, here’s why thoughtful analysis is a non-negotiable for any growth-minded owner.

Think of your financial position as the vital signs of your business. Doctors don’t wait for patients to collapse before taking readings. They track trends over time, spot anomalies early, and intervene before small problems become serious ones. The same logic applies here.

“Financial analysis enables informed decision-making across pricing, investment, and hiring, and helps build the kind of lender confidence that comes from transparent, strong financial ratios.” — SumUp Financial Analysis Guide

Here’s what regular analysis actually unlocks for your business:

  1. Early problem detection. You see liquidity gaps and debt buildups weeks or months before they threaten operations.
  2. Smarter pricing decisions. Knowing your real cost structure means you price to sustain margins, not just to win work.
  3. Confident hiring and investment. You know whether you can actually afford to expand, rather than finding out the hard way.
  4. Lender and investor trust. Clean records and strong ratios make funding conversations far easier and more favorable.
  5. Strategic planning traction. You can set realistic goals when you know where you’re starting from.

The OECD’s 2025 SME financing data confirms that poor financial management is the primary reason SMEs fail. That’s not just an academic observation. It’s a pattern repeated across industries and geographies, and it’s almost always preventable.

Pro Tip: Set a fixed date each month to review your balance sheet alongside your income statement. Treating it like a standing appointment, rather than a task you get to when things are slow, is what separates businesses that catch problems early from those that don’t.

For a deeper look at how expert support changes the game, explore the benefits of SME CFO services and what they make possible in practice.

Risks of neglecting financial position analysis

Knowing the upside of analysis is powerful, but understanding the risks of neglect can be a wake-up call.

Skipping regular financial position reviews isn’t a neutral decision. It’s a slow-building risk. Here’s what typically happens when owners fly blind:

  • Solvency surprises: A business can appear operational for months while quietly becoming insolvent. By the time the warning signs are obvious, options are limited.
  • Missed financing windows: Lenders look at your ratios. If your debt-to-equity is out of balance or your working capital is thin, you won’t qualify for the credit you need, precisely when you need it most.
  • Reactive debt spirals: Without visibility, owners often resort to expensive short-term borrowing to patch cash flow gaps, compounding the problem.
  • Legal exposure: Tax obligations, covenant breaches, and overdue payables can escalate quickly when there’s no one watching the numbers closely.
  • Denied credit lines: A scenario we see often involves a business where asset growth quietly lags behind liability growth for 12 to 18 months. Nobody noticed. Then the bank review comes, ratios fail, and the credit line is pulled at exactly the wrong moment.

Consider this: OECD 2025 data shows that SME lending declined from 2023 to 2025 in many markets, with higher interest rates making financing more restrictive. In this environment, errors in financial management are harder and more expensive to fix. There’s less margin for oversight.

Small business owner at kitchen table with invoices

The cost of reactive financial management isn’t just stress. It’s real money, lost opportunities, and in some cases, the business itself. The key steps for financial management exist precisely to keep you ahead of these scenarios. And if you’ve ever wondered what unlocking financial clarity would do for your business, the answer is: it removes these risks from your table entirely.

How to analyze your financial position: Practical tools and steps

To shift from concern to action, here’s how you can start analyzing your financial position with tools and steps suitable for SMBs.

You don’t need a team of accountants to get this right. You need a clear process and the right tools for your stage of business. Here’s where to start:

Step 1: Pull your core financial statements. Your balance sheet, income statement, and cash flow statement. These three together give you the full picture.

Step 2: Calculate your key ratios. Focus on current ratio (current assets divided by current liabilities), debt-to-equity, and gross margin. These are your vital signs.

Step 3: Compare against benchmarks. Internal trend comparison is useful, but benchmarking against industry peers reveals whether your position is genuinely strong or just stable by your own low bar.

Step 4: Spot trends over time. A single snapshot is limited. Three to six months of data starts showing patterns. Twelve months reveals the real shape of your business.

ToolBest forCostExpertise required
Excel / Google SheetsCustom models, full controlLowMedium
QuickBooksAutomated tracking, reportingMediumLow
Fractional CFOStrategy, interpretation, benchmarkingVariableNone (they bring it)

Monthly and quarterly reviews with consistent benchmarks are what enable genuinely proactive management. Tools like QuickBooks and Excel handle the mechanics well. But for SMBs without a full-time finance lead, a fractional CFO bridges the expertise gap by translating raw numbers into decisions.

Pro Tip: Don’t just track ratios in isolation. Pair each ratio with a simple question: “Is this trending better or worse than three months ago?” Trends matter more than point-in-time snapshots.

For owners ready to go deeper, explore financial metrics for SMBs, the different financial model types available to you, and strategic finance best practices that translate analysis into growth.

The uncomfortable truth most business owners miss about financial analysis

Conventional wisdom treats financial analysis as something you do when raising money, applying for a loan, or when the numbers look worrying. That framing is exactly backward.

The businesses we’ve seen navigate downturns, scale successfully, and secure favorable financing on short notice all share one trait: they analyze obsessively before anything urgent appears. They’re not reacting to their financials. They’re reading patterns early enough to actually respond.

Here’s what most checklists won’t tell you. The value of financial analysis isn’t in the individual review. It’s in the accumulated pattern recognition that builds over months. Each month you look at your position, you get marginally smarter about your business. After a year, you can see a problem forming three months before it becomes a problem. That is an enormous operational advantage.

Hiring experts or embedding clear processes doesn’t just save you in a crisis. It pays off exponentially in better decisions made continuously. Understanding what fractional CFOs do in practice makes this concrete: they don’t wait for red flags. They build the systems that prevent red flags from forming in the first place.

Next step: Unlock business clarity with expert financial guidance

If you’re ready to move from understanding to implementation, specialized support can help.

Analyzing your financial position is one thing. Knowing what to do with what you find is where most business owners get stuck. John Galt Finance helps SMBs turn raw financial data into clear, actionable strategy through fractional CFO support, tailored diagnostics, and precise financial modeling.

https://johngalt-finance.com

Whether you’re building your first real financial model through our custom financial modeling process, running a Financial Health Check to see exactly where you stand today, or getting serious about cash flow forecasting, the right guidance pays for itself fast. Don’t wait for warning signs to act. The best time to analyze your financial position is before anything looks wrong.

Frequently asked questions

What is the most important reason to analyze financial position?

The most important reason is to catch problems early, before they escalate. Regular financial analysis lets you see warning signs like liabilities outpacing assets long before a crisis hits.

How often should a business analyze its financial position?

Monthly or quarterly reviews are the recommended rhythm for most SMBs. Consistent review intervals are what build the pattern recognition that drives proactive management.

What tools are best for small businesses to analyze financial position?

Excel, QuickBooks, and a fractional CFO are the most practical options. QuickBooks and Excel handle ratio tracking well, while a fractional CFO adds the strategic interpretation layer most small businesses need.

What’s the difference between financial position and profit?

Profit measures earnings over a specific period, while financial position covers your total assets, liabilities, and equity. A business can be profitable and still have a weak or deteriorating financial position.

FAQ

What is financial position analysis?

It’s a structured review of your balance sheet, liquidity, solvency, and leverage to assess financial health. Unlike P&L analysis (which shows profitability), position analysis shows resilience: can you survive shocks?

How often should I review my financial position?

Quarterly at minimum, monthly if you have debt covenants or are in a high-risk industry. Annual is too infrequent; major position shifts (over-leverage, deteriorating liquidity) can compound in 90 days.

What’s the most important position ratio for SMBs?

Current ratio (current assets / current liabilities). Below 1.0, you can’t cover short-term obligations. Above 3.0, you’re carrying inefficient working capital. Target 1.5-3.0. See our working capital optimization guide for tactics.

How does financial position affect lending and valuation?

Banks set loan covenants on position ratios (current ratio, debt service coverage, debt-to-equity). Investors and acquirers discount valuation 10-30% for weak position metrics. A clean balance sheet is collateral for cheaper capital. See our business valuation guide.

What do I do if my financial position is weakening?

Three-step playbook: (1) freeze non-essential capex and discretionary spend, (2) accelerate AR collections and renegotiate AP terms, (3) raise emergency capital (LOC, owner injection) before position breaks debt covenants. Acting at 90 days early is the difference between rescue and restructuring.

Share this:

Investor Readiness: How to Prepare Your Financials for Fundraising

Investor readiness isn’t just about having a compelling pitch deck — it’s about having financials so clean, credible, and well-organized that investors can’t find a reason to say no. Whether you’re raising your first round or preparing for Series B, the state of your financial records will make or break the deal. This guide walks you through exactly what investor readiness means, what documents you need, and how to prepare your financials before you ever walk into a fundraising conversation.

Table of Contents

What Is Investor Readiness?

Investor readiness is the state in which your business can withstand rigorous financial scrutiny — and come out stronger. It means your books are accurate, your metrics tell a compelling growth story, and your forecasts are grounded in real assumptions rather than wishful thinking.

Most founders assume investor readiness is about the business model or the market size. In reality, investors spend 40-60% of due diligence reviewing financials. According to data from CB Insights, financial misrepresentation or disorganized records are among the top reasons deals fall apart at the term sheet stage.

A business can have a great product and still fail to raise capital simply because the financial story isn’t told clearly. Investor readiness closes that gap.

The Three Pillars of Investor Readiness

PillarWhat It MeansWhy It Matters
Financial AccuracyClean, reconciled books with no gaps or errorsBuilds trust; errors signal operational risk
Financial StoryMetrics and trends that demonstrate growth and efficiencyInvestors need to see a credible path to returns
Financial TransparencyOrganized data room with all documents readily accessibleSpeeds up due diligence; reduces investor anxiety

Key Takeaways

#Takeaway
1Investor readiness starts with clean, GAAP-compliant financials — not your pitch deck
2You need at least 3 years of historical financials (or all years of operation if younger)
3A 3-statement financial model with realistic assumptions is non-negotiable for Series A+
4Investors will scrutinize your unit economics — LTV, CAC, payback period, and churn
5A well-organized data room reduces deal friction by 30-40% and speeds up close timelines

Core Financial Documents Investors Expect

Before your first investor meeting, you need a complete financial package ready. Sending disorganized spreadsheets mid-diligence signals that your operations are equally disorganized. Here’s what every investor-ready business needs:

1. Historical Financial Statements (3 Years)

Investors want to see a P&L (Income Statement), Balance Sheet, and Cash Flow Statement for each of the past 3 years — or since inception if you’re younger. These should be prepared on an accrual basis, not cash basis, unless you have a compelling reason otherwise.

Common issues that raise red flags:

  • Revenue recognized before it’s earned (aggressive accounting)
  • Personal expenses mixed with business expenses
  • Inconsistent treatment of deferred revenue
  • Negative working capital trends with no explanation

2. Financial Model (3-Year Forecast)

A 3-statement financial model projecting income, balance sheet, and cash flows for the next 3-5 years is essential for any institutional raise. This model should include:

  • Revenue buildup by segment or product line
  • Headcount plan with corresponding salary costs
  • Customer acquisition assumptions tied to marketing spend
  • Clear working capital assumptions
  • Use of proceeds from the raise

A credible financial model isn’t about predicting the future perfectly — it’s about showing you understand your business drivers. Investors will stress-test assumptions, and you need to defend every number.

3. Cap Table

Your capitalization table shows who owns what — founders, previous investors, employees with options, advisors, and any convertible notes outstanding. Investors need a clean cap table to understand dilution and ownership post-round.

Red flags in cap tables:

  • Uncapped SAFEs or convertible notes with no clear conversion mechanics
  • Founder shares without vesting schedules
  • Multiple share classes with complex preferences
  • Missing ESOP pool (investors typically require 10-15% reserved)

4. Monthly MRR / Revenue Bridge

If you’re a recurring revenue business, investors want a monthly revenue waterfall showing new ARR, expansion, contraction, and churn. This is the single most scrutinized document for SaaS fundraising. For product businesses, a monthly revenue bridge by channel or SKU serves the same purpose.

5. Customer Cohort Analysis

Cohort analysis shows retention and expansion behavior over time. Investors use this to validate whether your LTV assumptions in the financial model are realistic. Strong net dollar retention (above 110%) can dramatically improve your valuation multiple.

Common Financial Mistakes That Kill Deals

Even well-run businesses make mistakes when preparing for fundraising. These are the most common — and most damaging — financial errors that derail investor readiness.

Mistake 1: Cash Basis Books for a Scaling Business

Cash basis accounting is fine for a small lifestyle business, but it’s inadequate for investor scrutiny. Accrual accounting matches revenue and expenses to when they’re earned or incurred, giving investors a cleaner picture of unit economics and margins. Switching from cash to accrual mid-fundraise is a deal-killer.

Mistake 2: No Separation of Owner Compensation

Founders often pay themselves inconsistently or mix personal expenses into the business. Investors normalize financials by adding back above-market founder compensation and removing personal expenses — but if the books are too messy to normalize, they’ll walk. Clean up owner compensation before starting conversations.

Mistake 3: Inflated Revenue Recognition

Recognizing annual contracts as upfront revenue, counting non-recurring revenue as recurring, or booking revenue before product delivery are all red flags that will surface in diligence. Investors work with auditors who specifically look for revenue recognition irregularities.

Mistake 4: No Variance Analysis

When investors see a forecast, they immediately want to know: how have you performed against prior forecasts? If you’ve never tracked actuals vs. budget, you have no forecasting credibility. Maintain a monthly actuals vs. budget comparison for at least the prior 12 months before entering fundraising.

Mistake 5: Missing or Incomplete Contracts

Revenue on a P&L without supporting contracts is unauditable. Investors expect a contracts folder with executed agreements for all major customers. Missing contracts signal either that revenue isn’t real or that you’re operating without proper legal infrastructure — both are disqualifying.

Financial Metrics That Matter Most to Investors

Investor readiness goes beyond clean books — you need to know your numbers cold and understand what each metric signals about your business health.

For SaaS and Subscription Businesses

MetricWhat Investors Look ForBenchmark (Series A)
ARR Growth RateYoY growth momentum100%+ (T2D3 rule)
Net Revenue RetentionExpansion vs. churn in existing base110%+
CAC Payback PeriodHow fast you recover customer acquisition cost<18 months
Gross MarginUnit economics at scale70%+
Rule of 40Growth rate + profit margin ≥ 4040+

For a deeper dive on SaaS-specific metrics, see our guide to SaaS Financial Metrics: 12 KPIs Every Founder Must Track.

For Product and Service Businesses

MetricWhat Investors Look ForWhy It Matters
Gross Margin by SegmentMargin profile and scalabilityShows where real profit lives
EBITDA MarginOperating leverage over timeProxy for cash generation at scale
Customer ConcentrationTop 5 customers as % of revenue>30% is a risk flag
Revenue per EmployeeProductivity and operational leverageSignals hiring efficiency

Keep track of these daily with the right tools — our article on Financial Dashboard: What Every Business Owner Needs to See Daily shows how to set this up.

Building Your Financial Data Room

A data room is a secure, organized repository of all the documents an investor needs to complete due diligence. A well-structured data room signals professionalism and dramatically reduces back-and-forth during the deal process.

Recommended Data Room Structure

01_Company_Overview/
   - Executive Summary
   - Pitch Deck
   - Company Fact Sheet

02_Financials/
   - Historical P&L (3 years)
   - Balance Sheet (3 years)
   - Cash Flow Statements (3 years)
   - Monthly Revenue Detail
   - Financial Model (3-5 year forecast)
   - Budget vs. Actuals (LTM)

03_Legal/
   - Certificate of Incorporation
   - Cap Table
   - Shareholder Agreements
   - IP Assignments
   - Option Pool / ESOP Details

04_Customers/
   - Top 10 Customer Contracts
   - Customer Cohort Analysis
   - Churn Analysis

05_Operations/
   - Org Chart
   - Key Employee Agreements
   - Vendor Contracts

06_Market/
   - Market Research
   - Competitive Landscape

Use platforms like Carta, Notion, or Google Drive with controlled access. Grant view-only permissions to investors until term sheet execution. Track which documents investors are spending time in — this tells you what they’re focused on.

How Long to Build a Data Room

Most founders underestimate this. If you’re starting from scratch, expect 4-8 weeks to assemble a complete data room. If you have a fractional CFO helping, that timeline compresses to 2-3 weeks. See our guide on what a fractional CFO actually does — investor readiness preparation is one of their core functions.

Investor Readiness Timeline: 90-Day Action Plan

Investor readiness isn’t built in a week. Here’s a practical 90-day plan to get your financials fundraising-ready.

Days 1-30: Clean the Foundation

  • Reconcile all bank accounts and credit cards
  • Switch to accrual accounting if still on cash basis
  • Separate personal from business expenses
  • Normalize owner compensation to market rate
  • Close any open months in your accounting software
  • Run a due diligence readiness audit to identify gaps

Days 31-60: Build the Story

  • Prepare 3-year historical financial statements
  • Build or refine your 3-5 year financial model
  • Calculate unit economics: CAC, LTV, payback period
  • Prepare cohort analysis and revenue waterfall
  • Identify and document key assumptions
  • Prepare actuals vs. budget reconciliation (LTM)

Days 61-90: Organize and Test

  • Build data room structure and upload all documents
  • Update cap table and verify with legal counsel
  • Compile all executed customer contracts
  • Run a mock Q&A session with your CFO or advisor
  • Stress-test financial model assumptions (bear / base / bull scenarios)
  • Get external review from a third party (accountant, fractional CFO)

For ongoing financial health monitoring beyond the raise, our guide on strategic finance best practices covers the systems you need post-funding.

Investor Readiness Checklist

Financial Documents

  • ☐ P&L, Balance Sheet, Cash Flow — 3 years historical
  • ☐ Month-by-month revenue detail (LTM minimum)
  • ☐ 3-5 year financial model with 3 scenarios
  • ☐ Budget vs. actuals (last 12 months)
  • ☐ MRR / ARR waterfall (SaaS businesses)
  • ☐ Customer cohort analysis

Legal & Corporate

  • ☐ Clean cap table (Carta or Pulley preferred)
  • ☐ All convertible notes and SAFEs documented
  • ☐ IP assignments from founders and employees
  • ☐ Corporate governance documents current

Operations

  • ☐ Top 10 customer contracts executed and filed
  • ☐ Key employee agreements with non-competes
  • ☐ Vendor contracts with material terms
  • ☐ Any pending litigation disclosed

Metrics Ready to Defend

  • ☐ Revenue growth rate (MoM and YoY)
  • ☐ Gross margin by product / segment
  • ☐ CAC, LTV, LTV:CAC ratio
  • ☐ Net revenue retention
  • ☐ Burn rate and runway
  • ☐ Rule of 40 score

Ready to Prepare Your Financials for Fundraising?

Investor readiness is a process, not a one-time task. The businesses that raise capital efficiently are those that maintain financial discipline long before they need external funding. If your books need cleaning, your model needs building, or your data room needs organizing, the time to start is now — not when an investor calls.

Book a free consultation with our fractional CFO team. We’ve helped founders across SaaS, e-commerce, and professional services get investor-ready in 30-90 days — without the cost of a full-time hire.

FAQ

How long does it take to become investor ready?

Most businesses need 60-90 days to achieve true investor readiness if starting from a moderate baseline. If your books are clean and you already have a financial model, the timeline compresses to 30-45 days. If you’re starting from cash basis with inconsistent records, plan for 90-120 days.

Do I need audited financials to raise venture capital?

Not for most early-stage raises (Pre-Seed, Seed, Series A). Reviewed financials or management-prepared statements with strong documentation are typically sufficient. Series B and beyond often require audited statements, especially if you’re targeting institutional investors or have plans for an IPO.

What’s the most common reason investors pass due to financials?

The most common reasons are: (1) inability to reconcile reported numbers with underlying data, (2) revenue recognition irregularities that inflate ARR, and (3) unclear or missing cap table that creates legal uncertainty. All three are preventable with proper preparation.

Should I hire a CFO or financial advisor for fundraising?

A fractional CFO is the most cost-effective solution for most SMBs and startups. They provide the financial expertise needed for investor readiness — model building, data room management, due diligence support — without the cost of a full-time hire ($200K+/year). Most fractional CFOs can prepare a business for fundraising in 30-60 days.

What burn rate and runway do investors expect?

Most investors want to see at least 18-24 months of runway post-raise. If you’re raising $2M and burning $100K/month, that’s 20 months — acceptable. If you’re burning $200K/month with $500K in the bank, investors will question whether you’ll survive the fundraising process itself. Come to the table with at least 6 months of current runway before starting conversations.

Share this:

Financial scenario planning: grow smarter in 2026

Financial Scenario Planning Benchmarks

MetricBenchmark
Standard scenario setBase, downside (-20%), upside (+20%)
Stress test for customer concentrationLoss of top 1-3 customers
Stress test for AR slowdownDSO +30 days for 90 days
Refresh frequency (scenarios)Quarterly minimum
Time to build first scenario model2-4 weeks
SMBs that model downside scenarios~30% (NFIB survey)
Cost of scenario planning (DIY in Excel)20-40 hours initial build
Cash reserve target (worst-case scenario)3+ months opex after stress test

Most business owners assume that a solid financial forecast is enough to navigate uncertainty. It isn’t. A single forecast tells you one story about the future, but the future rarely follows a script. SMEs using scenario planning show measurably higher resilience and growth rates compared to those relying on forecasts alone. This guide will show you exactly what financial scenario planning is, why it’s different from forecasting and budgeting, and how you can use it right now to make smarter, faster decisions for your business.

Table of Contents

Key Takeaways

PointDetails
More than forecastingFinancial scenario planning explores multiple futures, giving SMBs an edge over relying on single forecasts.
Boosts resilienceBusinesses with scenario planning adapt faster and perform better during market volatility.
Three focused scenariosStick to best, base, and worst case scenarios for clear, actionable decision-making.
Triggers drive decisionsLink plans to specific events (like a sales drop) so you know exactly when to act.
Ongoing updates requiredKeep your scenarios fresh by revisiting them every quarter or after major changes.

What is financial scenario planning?

Financial scenario planning means building financial models for at least three different versions of your future. Not one future. Three. You map out what happens if things go well, what happens if they go sideways, and what happens if they go badly. Then you decide in advance what you’d do in each case.

This is fundamentally different from financial planning basics, which typically involves setting goals and creating a single path to reach them. Scenario planning accepts uncertainty as a given and prepares you to respond to it, rather than being blindsided by it.

Here’s what makes scenario planning so powerful for small and medium businesses: it forces you to think through your assumptions before they’re tested by reality. When a supply chain disruption hits, or a key client walks away, you aren’t scrambling to figure out what to do. You already have a plan.

Scenario planning explores multiple hypothetical futures, unlike forecasting which predicts one likely outcome.” — ICAEW Financial Modelling Guidance

Forecasting says: “Based on current trends, we expect $500,000 in revenue next quarter.” Scenario planning says: “If revenue hits $500,000, here’s our plan. If it drops to $350,000, here’s what we cut. If it jumps to $700,000, here’s how we scale.”

Scenario planning is also distinct from custom modeling for business, which is the technical tool you use to build the models themselves. Think of scenario planning as the strategy and financial modeling as the execution.

Here’s what good scenario planning helps you do:

  • Answer ‘what if’ questions before they become real problems (e.g., What if our top client cancels?)
  • Stress-test your business model under different economic conditions
  • Align your leadership team on agreed responses before a crisis hits
  • Identify the early warning signs that tell you which scenario is actually unfolding
  • Plan for growth opportunities with confidence (e.g., What if we expand to a new market?)
  • Protect cash flow by mapping how different outcomes affect your bank balance

This isn’t a tool reserved for Fortune 500 strategy departments. It’s one of the highest-leverage things a small business owner can do.

Small business owner working on scenario plan

Scenario planning vs. forecasting and budgeting

Once you know what scenario planning is, the next step is understanding how it works alongside your other financial tools. Most business owners use forecasting and budgeting regularly. Scenario planning doesn’t replace them. It makes them far more useful.

ToolPrimary purposeTime horizonFlexibilityBusiness use case
Scenario planningExplore multiple futuresLong-term (1-5 years)HighStrategic decisions, risk planning
ForecastingPredict one likely outcomeShort to medium-termMediumOperational planning, investor reporting
BudgetingSet fixed financial targetsAnnualLowExpense control, performance tracking

Scenario planning is strategic. Forecasting is operational. Budgeting is about control. Each one answers a different question. Scenario planning asks “what could happen?” Forecasting asks “what will probably happen?” Budgeting asks “what are we allowed to spend?”

A real-world example makes this clear. Tetra Pak, the packaging giant, famously reduced its planning cycles and improved decision speed by integrating scenario planning alongside its standard forecasting processes. The key insight was that scenario planning complements forecasting and budgeting rather than replacing them. Businesses that use all three tools together respond faster to market shifts and make more confident investment calls.

For SMBs, the practical implication is simple. Your budget tells you where your money is going. Your forecast tells you where the business is headed. Your scenarios tell you what to do if the heading changes.

Pro Tip: Never rely on only one of these tools in isolation. A budget without scenarios is a fixed target in a moving market. Scenarios without a forecast give you no operational baseline. Use all three, and they will reinforce each other.

If you’re still unclear on how forecasting and budgeting interact, the breakdown in budgeting vs forecasting is a practical starting point before layering in scenario planning.

Why scenario planning matters for small and medium businesses

Here’s a number that should get your attention. SMB average monthly earnings were $83,600 in October 2025, down 21% month over month. A 21% revenue swing in a single month. For a business with tight margins and a lean team, that’s not a dip. That’s a crisis, unless you planned for it.

Planning approachResponse to 20% revenue dropTypical outcome
No formal planningReactive scrambling, delayed decisionsCash shortfall, missed payroll
Forecast onlyRecognized the gap, no pre-built responseSlow to act, partial recovery
Scenario planning adoptedActivated pre-planned cost controlsStabilized within 30-60 days

The table above reflects a pattern we see repeatedly. The businesses that survive sudden market shifts aren’t always the biggest or the most well-funded. They’re the ones that thought through the “what ifs” before those scenarios became real.

Following proven steps for SME profitability matters, but scenario planning gives those steps a safety net. It answers what you do when your profitability strategy encounters an unexpected roadblock.

Here are four real-world risks that scenario planning directly addresses for SMBs:

  1. Supply chain disruption: A key supplier raises prices by 30% or goes under entirely. Your scenario plan already maps out your backup suppliers and the margin impact.
  2. Market demand shift: Customer demand drops fast because of economic pressure or a competitor entering your market. Your downside scenario tells you exactly what costs to trim and when.
  3. Cash crunch: Revenue is fine but timing is off. Invoices come in late and bills come in early. SMB risk mitigation through scenario planning flags these timing risks before they become emergencies.
  4. Expansion risk: You’re considering hiring, opening a new location, or entering a new market. Scenario planning stress-tests the investment across multiple demand levels so you know your break-even point.

Scenario planning doesn’t eliminate risk. It ensures that risk never catches you completely off guard.

Infographic comparing forecasting and scenario planning

How to conduct effective financial scenario planning

Knowing why scenario planning matters is one thing. Doing it well is another. Here’s a practical process you can apply to your own business, regardless of your size or industry.

Step-by-step process:

  1. Define your planning goals. What decisions are you trying to support? Hiring? Expansion? Surviving a slow quarter? Your scenarios should connect directly to the decisions you’re actually facing.
  2. Select three scenarios. Build a base case (most likely outcome), a best case (things go well), and a worst case (things go badly). Expert guidance consistently recommends limiting to three. More than three and the exercise becomes unmanageable.
  3. Build your financial models. Map out revenue, costs, cash flow, and margins under each scenario. Use your actual business numbers as the foundation. This is where a cash flow forecasting tool becomes essential.
  4. Assign decision triggers. For each scenario, define the specific indicator that tells you it’s unfolding. Example: if monthly revenue falls 10% below baseline for two consecutive months, activate cost reduction plan B.
  5. Review and update regularly. Set a calendar reminder. At minimum, revisit your scenarios every quarter and after any major market event.

Common pitfalls to avoid:

  • Building too many scenarios and losing focus on any single one
  • Treating the base case as guaranteed and ignoring the other two
  • Forgetting to model cash flow timing, not just revenue and profit
  • Building scenarios once and never updating them as your business changes
  • Keeping scenarios confined to the finance team instead of sharing them with your leadership group

Pro Tip: Make each scenario a narrative, not just a spreadsheet. Write two or three sentences describing what’s happening in the market and in your business under each scenario. This makes the model far more actionable when you’re under pressure and need to act fast. A financial health checkup is a smart first step before you build your scenarios, so you’re starting with accurate baseline data.

A CFO’s perspective: What most scenario planning guides miss

Most guides treat scenario planning as a modeling exercise. Build three spreadsheets, label them best, base, and worst, and you’re done. That misses the point entirely.

The biggest reason scenario planning fails in small businesses isn’t a lack of data or a bad model. It’s that the scenarios get built once and never touched again. They become a document in a folder, not a living tool that shapes how you run your business week to week.

What actually works is treating scenario planning as an ongoing conversation with your numbers. The best business owners we work with revisit their scenarios whenever something shifts, a key contract, a market signal, a hiring decision. They involve their leadership teams so that everyone understands the triggers and the agreed responses. There are no surprises when the plan needs to activate.

Another thing most guides skip: the psychological component. When you’ve already decided what to do if revenue drops 15%, you can make that call fast and without panic. That speed is worth more than any spreadsheet sophistication.

If your scenarios feel disconnected from how you actually run the business, it may be time to look at the signs your business needs a CFO for outside perspective. A fractional CFO can help you build scenarios that are genuinely actionable, not just theoretically complete.

Get expert help with your scenario planning

Scenario planning delivers real results when it’s built on solid data and updated consistently. For many SMB owners, the challenge isn’t understanding the concept. It’s finding the time and expertise to do it well.

https://johngalt-finance.com

At John Galt Finance, we help small and medium businesses build custom scenario models grounded in their actual financials. Whether you need a one-time model or ongoing CFO support, we bring the strategic depth that makes planning actionable. Start with our business planning guide to build a strong foundation, use the cash flow toolkit to sharpen your cash projections, and explore our custom modeling process to see how we tailor models to your business. Reach out for a consultation and turn your scenario planning from a spreadsheet into a strategic advantage.

Frequently asked questions

What are the three main scenarios I should plan for?

Plan for a best case, base case, and worst case scenario. Sticking to three keeps the process manageable and ensures each scenario gets the attention it deserves.

How often should I update my financial scenarios?

Review your scenarios at least quarterly and after any significant business or market event. Not updating scenarios is one of the most common and costly mistakes SMB owners make.

Is financial scenario planning only for large companies?

Not at all. SMEs using scenario planning consistently show higher resilience and better growth outcomes, making it one of the highest-value practices for small and medium businesses.

How does scenario planning relate to cash flow?

Each scenario you model will show a different cash flow outcome, revealing potential shortfalls before they arrive. Ignoring cash flow in your scenarios is a critical mistake that leaves you vulnerable to timing crunches even when revenue looks healthy.

FAQ

What scenarios should I always model?

Five essentials: (1) base case (most likely), (2) downside (-20% revenue), (3) upside (+20% revenue), (4) loss of largest customer, (5) AR slowdown of 30 days for 90 days. Together they capture the main risks any SMB faces.

How is scenario planning different from forecasting?

Forecasting is your best estimate of the future. Scenario planning is multiple plausible futures with action plans for each. Forecasting answers “what will happen?”; scenarios answer “what will we do if X happens?”. Mature finance functions do both.

How often should I refresh scenarios?

Quarterly at minimum, plus any time you have a major external shock (recession warning, supply chain disruption, regulatory change). Outdated scenarios can be worse than no scenarios; they create false confidence.

What’s the right tool for scenario planning?

For SMBs under $10M revenue, Excel with scenario manager is sufficient. Between $10M-$50M, tools like Jirav, Vena, or Cube speed up iteration and reduce error. Avoid enterprise tools (Anaplan, Hyperion) until $50M+; the setup cost exceeds the value.

How do I get my team to actually act on scenarios?

Tie each scenario to specific triggers and actions. Example: “If two consecutive months are 10% below plan, freeze hiring and cut marketing 30%.” Pre-committed decisions get executed; abstract scenarios get filed and forgotten.

Share this:

Financial Dashboard: What Every Business Owner Needs to See Daily

A financial dashboard business owners actually use every morning is the difference between running a company and being run by one. When you open your laptop at 8 a.m., you should know within sixty seconds whether your business is on track — not after thirty minutes of digging through spreadsheets. This guide covers exactly what belongs on that dashboard, why each metric matters, and how to build the daily financial visibility habit that separates growing companies from stagnant ones.

Table of Contents

Why Every Business Owner Needs a Daily Financial Dashboard

Most business owners know their revenue target. Far fewer know their current cash position, which invoices are overdue, or whether last week’s gross margin was above or below their break-even threshold. This information gap is costly. Studies consistently show that cash flow problems — not lack of revenue — are the leading cause of small business failure.

A well-designed financial dashboard business owners can check in under five minutes eliminates that gap. It surfaces the numbers that require action today, flags the trends that signal problems next month, and gives you the confidence to make fast decisions without waiting for your accountant’s monthly report.

Think of it as the cockpit instrument panel for your business. You don’t need to understand every gauge, but you absolutely need to know when a warning light is on.

Key Takeaways

MetricWhy It MattersIdeal Frequency
Cash balance & runwaySurvival indicator — how long you can operateDaily
Revenue vs. targetPace indicator — are you on track for the month?Daily
Accounts receivable agingCash risk — overdue invoices that need follow-upDaily
Gross margin %Profitability health — are you earning on each sale?Weekly
Burn rate / OpExCost control — spending relative to revenueWeekly
Key industry KPIBusiness-specific signal (e.g., CAC, project margin)Weekly

1. Cash Position and Cash Runway

Cash is oxygen. Your dashboard should show your current bank balance every single morning — pulled automatically from your accounting software or bank feed, not manually updated. One number, always current.

Cash Runway

Cash runway answers: “At our current burn rate, how many months can we operate without new revenue?” The formula is simple:

Cash Runway = Current Cash Balance ÷ Monthly Cash Burn

A runway of less than three months is a red alert. Six months gives you options. Twelve months gives you leverage.

What Triggers Action

Set a threshold on your dashboard — say, $150,000 minimum cash balance. The moment the balance drops below it, a red indicator fires and you know to prioritize collections, delay non-critical spending, or accelerate a sales push. No monthly report needed; the dashboard tells you today.

2. Daily and Weekly Revenue Metrics

Revenue on a financial dashboard business owners find useful is not just the running monthly total. It’s revenue paced against target. If you’re twelve days into a thirty-day month and you’ve hit 28% of your monthly goal, you’re behind — and you need to know that on day twelve, not day thirty-one.

Metrics to Display

MetricFormulaSignal
Revenue to date (MTD)Sum of invoiced/collected this monthAbsolute progress
Revenue pace %MTD Revenue ÷ (Monthly Target × Days Elapsed / Total Days)Are you ahead or behind?
New deals closed (week)Count of new contracts signedPipeline health
Average deal sizeMTD Revenue ÷ Deals ClosedMix shift — upsell / downsell trend

Real Example

A consulting firm with a $120,000 monthly target is on day 15. MTD revenue is $42,000. Target pace for day 15 is $60,000. Revenue pace is 70% — they are significantly behind. The dashboard shows this immediately. The owner can spend the afternoon on sales calls rather than discovering the shortfall on day 28.

For SaaS businesses, revenue tracking works slightly differently — learn more about the 12 SaaS financial metrics every founder must track.

3. Accounts Receivable and Payables Aging

Unpaid invoices are not revenue. They are promises. Your dashboard should show the aging breakdown of what’s owed to you — and what you owe — so you can take action before a cash gap opens.

AR Aging Buckets

  • Current (0–30 days): Normal, no action needed
  • 30–60 days overdue: Send a polite reminder today
  • 60–90 days overdue: Call the client — escalate immediately
  • 90+ days overdue: Consider collections; provision for bad debt

Dashboard View

Display total AR by bucket as a horizontal bar or simple table. The dashboard should highlight any invoice over sixty days in red. Color-coding turns this from a report into an action list.

On the payables side, knowing your upcoming obligations helps you plan outflows. If you have $40,000 in vendor invoices due in the next seven days and your cash balance is $55,000, you have a very different decision framework than if that balance is $200,000.

4. Burn Rate and Operating Expenses

Burn rate is how much cash your business consumes each month after revenue. For profitable businesses, a better frame is operating expense ratio: OpEx as a percentage of revenue. Either way, the financial dashboard business owners need shows this trend over the past three to six months.

Gross vs. Net Burn

  • Gross burn: Total monthly expenses (payroll, rent, software, vendors)
  • Net burn: Gross burn minus revenue collected

Net burn is the number that matters for runway. Profitable businesses have negative net burn — they’re generating cash. Pre-revenue startups track gross burn to know their actual monthly cost of existence.

Expense Trend Line

A three-month rolling average of expenses, shown as a simple line chart, immediately reveals expense creep. If your OpEx is growing 4% per month while revenue is flat, you have a problem developing in slow motion — exactly the kind of thing a daily dashboard catches early. Our guide to cost reduction strategies that don’t kill growth covers what to cut when you spot this pattern.

5. Gross Margin and Contribution Margin

Gross margin tells you how much profit you keep from each dollar of revenue after direct costs. It belongs on every financial dashboard because it’s the most sensitive early signal of pricing or cost structure problems.

The Formula

Gross Margin % = (Revenue – Cost of Goods Sold) ÷ Revenue × 100

A manufacturing business might target 35–45% gross margin. A SaaS company might target 70–85%. A services firm often runs 50–65%. Know your industry benchmark and make your gross margin a permanent fixture on your dashboard.

Contribution Margin for Multi-Product Businesses

If you sell multiple products or services, contribution margin by line tells you which offerings are pulling weight. A service line with a 20% contribution margin when your blended target is 55% is either a candidate for repricing or discontinuation. This analysis is part of the broader essential financial metrics every SMB should track.

6. KPI Watchlist: Industry-Specific Metrics

Beyond the universal metrics above, your financial dashboard business should include two or three KPIs specific to your industry. These are the leading indicators that predict your financial results before they show up in revenue or cash.

IndustryKey Dashboard KPIWhy It Matters
E-commerceROAS, Cart abandonment rateMarketing efficiency and conversion
SaaS / SubscriptionMRR, Churn rate, CACGrowth quality and unit economics
Professional servicesUtilization rate, Realization rateBillable capacity and pricing discipline
ConstructionProject margin by job, % complete billedCash flow and job profitability
RetailInventory turnover, Sell-through rateWorking capital efficiency
ManufacturingCapacity utilization, Scrap rateCost efficiency and waste

Understanding what drives your financial results — not just what the results are — is the hallmark of sophisticated financial management. A fractional CFO can help you identify the three or four KPIs that have the highest predictive value in your specific business model.

7. How to Build Your Financial Dashboard

You don’t need expensive software to build a functional financial dashboard. Here are the main options, from simple to sophisticated.

Option 1: Google Sheets or Excel (Free, Manual)

Best for businesses under $1M revenue with straightforward financials. Create a template with your key metrics, update it weekly, and share with your leadership team. It’s manual but forces you to engage with the numbers.

Option 2: Accounting Software Built-In Dashboard

QuickBooks Online, Xero, and FreshBooks all include dashboard views. These auto-update from your transaction data and cover cash, revenue, and P&L basics. Sufficient for most SMBs up to $5M revenue if configured correctly.

Option 3: BI Tools Connected to Your Systems

Tools like Google Looker Studio (free), Power BI, or Metabase connect to your accounting software, CRM, and operational systems to pull everything into one view. This is the right solution for businesses over $5M or with multiple data sources. Setup takes time but maintenance is minimal.

Option 4: CFO-Built Custom Dashboard

For businesses with complex financials or multiple entities, a custom-built dashboard — maintained by a fractional CFO — ensures the right metrics are tracked, calculated correctly, and reviewed in a regular cadence. This is how companies that grow to $10M+ typically operate. Read more about mastering financial KPIs for business growth.

Implementation Tips

  • Start with five metrics maximum. Complexity kills adoption.
  • Automate data pulls wherever possible — manual dashboards get skipped
  • Set thresholds and alerts, not just displays
  • Review the dashboard at the same time every day to build the habit
  • Add metrics only when you’ve demonstrated you act on the existing ones

Daily Dashboard Checklist

Use this checklist every morning. It should take under five minutes:

  • Cash balance: Above minimum threshold? If not, what’s the immediate action?
  • Revenue pace: Ahead of or behind monthly target? By how much?
  • AR aging: Any invoices crossed into 60+ days overdue today? Who needs a call?
  • Upcoming payables: Any large outflows due this week? Cash sufficient?
  • Key KPI: Is my leading indicator (utilization / churn / ROAS) inside the target range?
  • One action: Based on the above, what is the single most important financial action today?

The last item is the most important. A dashboard that generates data without generating action is just noise. Close every morning review with a specific action assigned to a specific person.

Work With a Fractional CFO to Build Yours

Building a financial dashboard that actually works for your business — connected to real data, tracking the right metrics, and calibrated to your industry — takes financial expertise and systems knowledge. Most business owners try three times and give up.

John Galt Finance builds custom financial dashboards for SMBs as part of our fractional CFO engagements. We handle the setup, connect your data sources, define your alert thresholds, and train you to use it in five minutes a day. Clients typically report better cash flow visibility within thirty days and faster, more confident decision-making within ninety.

Book a free consultation and let’s build the financial dashboard your business needs to grow.

Frequently Asked Questions

What is a financial dashboard for a business?

A financial dashboard is a single-screen summary of your most important financial metrics — cash balance, revenue, receivables, expenses, and key KPIs — updated regularly (ideally in real time) so you can assess business health at a glance. A good financial dashboard business setup surfaces actionable information, not just historical data.

How often should I check my financial dashboard?

Daily for the top-level metrics: cash position, revenue pace, and AR aging. Weekly for trend-based metrics: gross margin, burn rate, and industry-specific KPIs. Monthly for a full financial review. The daily check should take five minutes or less; if it takes longer, your dashboard has too much on it.

What software is best for a small business financial dashboard?

For businesses under $2M revenue, QuickBooks Online or Xero’s built-in dashboards are sufficient. From $2M–$10M, consider connecting your accounting software to Google Looker Studio or Power BI for custom views. Above $10M or with multiple entities, a fractional CFO-managed solution with dedicated BI tooling is the right investment.

What’s the most important metric on a financial dashboard?

Cash position and cash runway are the most critical survival metrics. Beyond that, the most important metric is the leading indicator specific to your business model — churn rate for SaaS, utilization for services, inventory turns for retail. Leading indicators predict future financial results; cash tells you where you stand right now.

Can I build a financial dashboard without a CFO?

Yes — start with a Google Sheets template tracking cash, revenue-to-target, and AR aging. Connect it to your accounting software’s export function and update weekly. This gives you 80% of the value for near-zero cost. As your business grows past $3–5M, the complexity of multi-source data, entity consolidations, and sophisticated KPI tracking makes a CFO-level resource genuinely worthwhile.

Share this:

Construction Finance: Cash Flow Management for Project-Based Business

Construction finance is the single biggest reason project-based businesses fail — not poor craftsmanship, not bad clients, but cash flow gaps that appear when invoices lag behind payroll. A contractor can land a $2M project, deploy a full crew, purchase materials on credit, and still find themselves unable to make payroll in week four because the draw schedule doesn’t match the spend curve. If you run a construction, renovation, engineering, or any project-based business, mastering construction finance is non-negotiable.

Table of Contents

Key Takeaways

TopicKey Insight
Cash flow timingSpend happens daily; income arrives in lumps — bridge that gap intentionally
Draw schedulesFront-load draws or negotiate mobilization payments to cover early project costs
WIP accountingPercent-complete method reveals true project profitability — don’t skip it
Working capitalTarget 10–15% of annual revenue as a liquid buffer for project-based businesses
Billing disciplineInvoice on time, every time — delayed invoices are free loans to your client
Job costingTrack costs per project, not just company-wide — you can’t manage what you don’t see

Why Construction Finance Differs from Other Industries

Most small business financial frameworks assume you sell a product or deliver an ongoing service with predictable monthly revenue. Construction finance operates on entirely different mechanics. Revenue is earned in phases, costs are front-loaded, and payment terms are heavily influenced by contract type, retainage clauses, and client bureaucracy.

The Three Core Challenges

Project-based businesses face three structural cash flow problems that don’t exist in the same way for a retail store or SaaS company:

  • Mobilization costs: You spend money before you’ve earned a dollar — materials, equipment rental, permits, and initial labor all hit before the first draw.
  • Retainage: Clients typically withhold 5–10% of every payment until project completion. On a $1M project, that’s $50,000–$100,000 locked up, sometimes for 12–18 months.
  • Change order lag: Scope changes happen constantly in construction, but the billing cycle doesn’t automatically adjust. Work gets done; payment follows weeks or months later.

The Cash Conversion Cycle in Construction

Where a retail business might have a cash conversion cycle of 30–45 days, a construction company often runs 60–120 days. You purchase materials, pay subcontractors and labor, submit an application for payment, wait for approval, and only then receive funds. Understanding and compressing this cycle is the core discipline of construction finance.

For a broader framework on improving cash flow across your business, see our guide on how to improve cash flow.

Draw Schedules: Structuring Cash Flow from Day One

A draw schedule defines when and how much you get paid as work progresses. Poorly negotiated draw schedules are the #1 avoidable cause of construction finance crises. Most contractors accept whatever the client or GC proposes without realizing they’re agreeing to fund the project themselves.

How to Negotiate a Better Draw Schedule

Before signing any contract, map your expected cost curve by week or month. Then negotiate a draw schedule that stays ahead of — or at least tracks — your cost curve. Specifically:

  • Mobilization payment: Request 10–15% upfront to cover materials procurement and site setup. This is standard and defensible.
  • Front-loaded milestones: Structure early milestones to capture more than their proportional share of contract value. If rough framing is 25% of the work, bill 30% at that milestone.
  • Frequent draw intervals: Monthly billing is standard; push for bi-weekly on large projects where your spend is accelerating.
  • Retainage caps and release triggers: Negotiate to reduce retainage from 10% to 5% after 50% project completion, with clear release language tied to inspection sign-off.

Case Study: Renegotiating a Draw Schedule

A mid-size general contractor with $8M in annual revenue was consistently running negative cash flow despite growing backlog. Analysis revealed their standard contract had 10% retainage and equal monthly draws, while their actual cost profile was heavily front-loaded (40% of costs in the first 30% of project duration). By renegotiating mobilization payments and front-loaded milestones on new contracts, they reduced average monthly cash shortfall from -$180K to +$45K within two project cycles.

WIP Accounting: Seeing the Real Picture

Work-in-Progress (WIP) accounting is the financial reporting standard specifically designed for project-based businesses. Without it, your income statement is meaningless — you’ll book revenue when you invoice and costs when you incur them, creating a distorted view of profitability.

Percentage-of-Completion Method

The percentage-of-completion method recognizes revenue and costs proportionally as work is completed, giving you a real-time view of project health. The formula is straightforward:

MetricFormulaExample
Percent completeCosts to date ÷ Total estimated costs$300K ÷ $1M = 30%
Revenue to recognizeContract value × Percent complete$1.5M × 30% = $450K
Gross profit to dateRevenue recognized − Costs to date$450K − $300K = $150K
Overbilling/(Underbilling)Billings to date − Revenue recognized$500K − $450K = $50K overbilled

Overbilling vs. Underbilling

Overbilling (billing more than you’ve earned) is a short-term cash flow boost but a liability — it means you owe work, not money. Underbilling (earning more than you’ve billed) is the opposite: you’ve done the work but haven’t captured the cash. Persistent underbilling is a cash flow drain and often signals a billing process breakdown. Review your WIP schedule monthly and address underbilling immediately.

Working Capital Management in Construction

Working capital — current assets minus current liabilities — is the financial cushion that keeps your business alive between cash inflows. In construction finance, working capital management is more complex than in most industries because your balance sheet is dominated by project-specific assets and liabilities.

Target Working Capital for Project-Based Businesses

A healthy target for construction and project-based businesses is 10–15% of annual revenue held in liquid working capital. For a $5M contractor, that means $500K–$750K in accessible cash or credit. This buffer absorbs:

  • Payment delays from slow-paying clients or contested change orders
  • Unexpected material price increases or project delays
  • Opportunity costs — having capital available to mobilize on a new project immediately

Managing Payables and Receivables in Parallel

Construction finance requires active management of both sides of the working capital equation. On the receivables side, submit applications for payment on time, follow up aggressively on approvals, and never let an invoice sit without a follow-up past 10 days. On the payables side, use your contract payment terms strategically — pay subs and suppliers on their terms, not early, to preserve your cash position. Explore essential financial metrics to track your working capital ratio alongside other business health indicators.

Billing Methods That Protect Your Cash Position

The billing method you choose has a direct impact on cash flow risk. Different contract structures shift financial risk differently between owner and contractor.

Contract Types and Their Cash Flow Implications

Contract TypeCash Flow RiskBest For
Fixed-price (lump sum)High — scope creep eats marginWell-defined, low-complexity projects
Cost-plusLow — costs reimbursed plus feeComplex or uncertain-scope projects
Guaranteed maximum price (GMP)Medium — capped but with savings sharingCommercial construction with trusted clients
Time and materials (T&M)Low — invoice as you goService, maintenance, or emergency work
Unit priceMedium — volume risk but predictable rateCivil, infrastructure, repetitive work types

AIA Billing (G702/G703)

For commercial projects, AIA billing documents (Application for Payment G702 and Continuation Sheet G703) are the industry standard. Using them correctly — with accurate stored materials, properly documented change orders, and timely submission — keeps your cash cycle predictable and provides legal protection in payment disputes.

Lien Rights as a Cash Flow Tool

Mechanics lien rights are one of the most powerful — and underused — tools in construction finance. Filing a preliminary notice (where required) preserves your right to place a lien on the property if you’re not paid. This makes clients and GCs take payment disputes seriously. Many payment delays resolve the moment a lien waiver is requested and you can point to a preliminary notice already on file.

Job Costing and Cost Control

You cannot manage construction finance without job-level cost visibility. Company-wide P&L tells you if the business is profitable. Job costing tells you why — and which projects are subsidizing which.

Setting Up Job Costing

Every cost in your business should be attributable to a job code: labor hours, materials, equipment, subcontractor invoices, even overhead allocated proportionally. Your accounting software (QuickBooks, Sage, Procore, or similar) should produce a job cost report that shows, for each active project:

  • Original budget by cost category
  • Actual costs to date
  • Estimated cost to complete (ETC)
  • Projected final cost vs. budget
  • Gross margin at completion

The “Job Cost Fade” Problem

Job cost fade — when a project’s estimated profit shrinks as work progresses — is endemic in construction. The causes are usually identifiable: underestimated labor hours, uncontrolled subcontractor overruns, or change orders that were performed but never billed. A monthly job cost review meeting with project managers, reviewing every active job against budget, is the single highest-ROI financial management activity for a construction business. This connects directly to cost reduction strategies that preserve margin without cutting quality.

Variance Analysis by Cost Category

When a job goes over budget, diagnose the category before reacting. Labor overruns and material overruns have completely different root causes and solutions. Labor overruns typically point to estimating errors or productivity problems; material overruns suggest procurement failures or scope growth. See our guide on financial management for SME profitability for a framework on variance analysis.

Financing Tools Every Contractor Should Know

Even well-managed construction businesses face periodic cash flow gaps. The key is having financing tools arranged before you need them — because by the time you’re desperate, your options narrow and your cost of capital rises.

Construction Line of Credit

A revolving line of credit secured by your receivables or business assets is the most flexible tool for managing short-term gaps. Draw on it when waiting for a draw approval; repay it as soon as payment arrives. Ideal line size is 15–20% of your annual revenue.

Invoice Factoring and Construction Factoring

Factoring sells your approved invoices to a third party at a discount (typically 1.5–3% for 30-day factoring) in exchange for immediate cash. Construction-specific factoring companies understand lien waivers, retainage, and AIA billing. It’s expensive on an annualized basis but highly effective for bridging large individual gaps without taking on long-term debt.

Equipment Financing and Leaseback

Own equipment outright? Sale-leaseback transactions convert illiquid equipment assets into cash while retaining operational use. For new equipment, financing or leasing preserves working capital compared to cash purchases.

SBA Loans for Contractors

SBA 7(a) loans offer up to $5M at competitive rates with longer repayment terms than conventional business loans. They require strong documentation but are particularly accessible for established contractors with 2+ years of financials. When preparing for any financing, use our due diligence checklist to organize your financial documentation.

Construction Finance Checklist

Use this checklist monthly to maintain healthy construction finance practices:

AreaAction ItemFrequency
Cash flowUpdate 13-week rolling cash flow forecastWeekly
BillingSubmit all applications for payment on schedulePer contract terms
WIPReview WIP schedule for overbilling/underbillingMonthly
Job costingReview all active jobs vs. budget with PMsMonthly
ReceivablesFollow up on any invoice unpaid past 10 daysWeekly
Change ordersEnsure all verbal change orders are documented and billedWeekly
RetainageTrack retainage balance and expected release datesMonthly
Working capitalCheck current ratio (target: 1.5x or higher)Monthly
Lien rightsConfirm preliminary notices filed on new projectsPer project start
FinancingReview line of credit utilization and availabilityMonthly

Ready to Fix Your Construction Finance?

Cash flow gaps in construction are manageable — but only if you have the right systems, reporting, and financial discipline in place. Many contractors are excellent at their trade but find themselves in financial trouble because the back-office hasn’t kept pace with project growth. A fractional CFO with construction finance experience can implement job costing, WIP reporting, draw schedule optimization, and cash flow forecasting in weeks, not months.

Book a free consultation to discuss how better construction finance management can stabilize your cash flow and unlock your next level of growth.

FAQ

What is construction finance?

Construction finance refers to the financial management practices specific to project-based construction businesses: cash flow management across project cycles, draw schedule negotiation, WIP accounting, job costing, retainage management, and the financing tools used to bridge gaps between project spend and client payments.

How do I fix cash flow problems in my construction business?

Start with these three actions: (1) Negotiate mobilization payments and front-loaded draw schedules on all new contracts. (2) Implement a 13-week rolling cash flow forecast so you see gaps 60–90 days before they hit. (3) Invoice on time, every time, and follow up on payments within 10 days of the due date. For deeper strategies, see our guide on how to improve cash flow.

What is a WIP schedule in construction accounting?

A WIP (Work-in-Progress) schedule is a financial report that shows the status of all active projects using the percentage-of-completion method. It identifies overbilling (where you’ve billed more than you’ve earned — a liability) and underbilling (where you’ve earned more than you’ve billed — a cash flow drain). Reviewing the WIP schedule monthly is essential for accurate financial reporting in construction.

How much working capital does a construction company need?

A healthy target is 10–15% of annual revenue in liquid working capital, plus an available line of credit equal to 15–20% of annual revenue. A $5M contractor should aim for $500K–$750K in liquid assets and a $750K–$1M credit line. The specific amount depends on project size, client payment terms, and retainage exposure.

What financing options are best for construction companies?

The most useful financing tools for contractors are: a revolving line of credit (for short-term gaps), construction-specific invoice factoring (for bridging large individual payment delays), equipment financing (to preserve working capital), and SBA 7(a) loans (for longer-term capital needs). Arrange these before you need them — lenders want to see stable financials, not desperation borrowing.

Share this: