4 - 2026 | John Galt

E-commerce Financial Planning: From Revenue to Real Profit

Most e-commerce founders celebrate when revenue grows — but ecommerce financial planning reveals a harder truth: more sales don’t automatically mean more profit. Without a structured financial framework, growing online stores routinely face cash shortfalls, inventory crises, and margin erosion that no amount of top-line growth can fix.

This guide walks you through a complete ecommerce financial planning system — from understanding your true unit economics to building cash flow models that survive peak seasons and supply chain disruptions.

Table of Contents

Key Takeaways

TopicWhat You Need to Know
Unit EconomicsCalculate CAC, LTV, and contribution margin before scaling ad spend
Cash FlowInventory purchases and ad platforms create 30–60 day cash gaps
Gross MarginHealthy e-commerce gross margins run 40–60%; below 30% is danger territory
ForecastingModel 3 scenarios (base, upside, downside) for every peak season
CAC PaybackAim for CAC payback under 6 months to preserve working capital

Why E-commerce Finance Is Different

Traditional retail finance models don’t map cleanly onto online stores. E-commerce businesses face a unique combination of challenges:

  • Inventory risk: You pay for goods weeks or months before you sell them, creating working capital strain.
  • Platform dependency: Ad costs on Meta and Google fluctuate daily, making CAC volatile and hard to forecast.
  • Returns complexity: Return rates of 15–30% are normal in e-commerce — and every return has hidden costs (restocking, shipping, damage write-offs).
  • Marketplace fees: Amazon, Etsy, and Shopify all take a cut that reduces your effective margin.
  • Seasonality concentration: Many e-commerce stores earn 30–50% of annual revenue in Q4 alone.

Effective ecommerce financial planning accounts for all of these dynamics — not just revenue and expenses.

Unit Economics: The Foundation of Profitable Growth

Before you scale anything, you need to understand your unit economics. These are the per-order and per-customer numbers that determine whether your business model is fundamentally sound.

Customer Acquisition Cost (CAC)

CAC = Total Marketing & Sales Spend ÷ Number of New Customers Acquired

Example: If you spend $20,000 on ads in March and acquire 400 new customers, your CAC is $50. The question is whether that $50 is justified by what each customer is worth to you over time.

Customer Lifetime Value (LTV)

LTV = Average Order Value × Purchase Frequency × Customer Lifespan × Gross Margin %

Example: A customer who buys twice per year at $80 average order value, stays for 2 years, and generates 45% gross margin has an LTV of $80 × 2 × 2 × 0.45 = $144.

LTV:CAC Ratio

RatioInterpretation
Below 1:1You’re losing money on every customer — stop scaling
1:1 to 2:1Marginal — only viable with very fast payback periods
3:1Healthy — standard benchmark for funded e-commerce brands
4:1+Strong — you have room to invest aggressively in growth

Contribution Margin per Order

Contribution margin = Revenue − Variable Costs (COGS + shipping + payment processing + returns)

This is the most important number in ecommerce financial planning. It tells you exactly how much each order contributes to covering your fixed costs. A business with $500K in revenue but negative contribution margin is running a machine that destroys cash with every transaction.

Cash Flow Management for Online Stores

Cash flow is where most e-commerce businesses hit the wall — not because they’re unprofitable, but because they’re growing. A scaling store needs to buy more inventory before it collects revenue from past sales. This creates a structural cash gap that surprises founders every time.

The Inventory Cash Gap

Here’s a typical scenario:

  • Day 0: Place inventory order, pay supplier (or put deposit down) — cash out
  • Day 30–45: Inventory arrives at warehouse
  • Day 45–75: Products sell and ship to customers
  • Day 75–90 (if marketplace): Platform pays out, cash in

That’s a 60–90 day cash cycle. Double your sales, and you double the cash you need to fund this cycle. See our full guide on how to improve cash flow for business owners for tactics to compress this gap.

13-Week Rolling Cash Flow Forecast

Every e-commerce operator should maintain a 13-week rolling cash forecast. This model tracks:

  • Expected revenue collections (net of returns)
  • Inventory purchase commitments
  • Ad spend obligations
  • Fixed operating expenses
  • Debt service (if applicable)

The output is a week-by-week cash balance that shows you exactly when you’ll hit a shortfall — with enough lead time to arrange financing, delay purchases, or accelerate collections.

Working Capital Levers

LeverHow It HelpsTypical Impact
Supplier payment termsDelay cash out by 30–60 daysHigh
Inventory turns optimizationReduce dead stock tying up cashMedium-High
Revenue-based financingAdvance against future salesMedium
Pre-ordersCollect cash before purchasing inventoryHigh (if viable)
Marketplace payout accelerationSome platforms offer early payoutsLow-Medium

COGS and Margin Structure

Gross margin is the heartbeat of your e-commerce P&L. Many founders calculate it incorrectly by omitting costs that belong in COGS.

True COGS for E-commerce

Full COGS should include:

  • Product cost (landed cost including import duties)
  • Inbound shipping from supplier
  • 3PL / warehouse storage and pick-and-pack fees
  • Outbound shipping to customer
  • Payment processing fees (typically 2–3%)
  • Returns and restocking costs
  • Packaging materials

When you include all of these, your gross margin will be 10–15 percentage points lower than what a naive calculation shows. This matters enormously for ecommerce financial planning — a business that thinks it has 50% gross margins but actually has 35% will run out of money building toward profitability targets that don’t exist.

Margin Benchmarks by Category

Product CategoryTypical Gross Margin
Fashion / Apparel45–65%
Beauty / Personal Care50–70%
Electronics10–25%
Home Goods30–50%
Food / Supplements40–60%
Sporting Goods30–50%

If your gross margins fall significantly below category benchmarks, conduct a full cost reduction analysis before scaling further. Scaling poor margins only accelerates losses.

Essential Financial KPIs for E-commerce

Effective ecommerce financial planning requires tracking the right numbers consistently. Here are the metrics that actually drive decisions:

Revenue Quality Metrics

  • Net Revenue (after returns and discounts) — never plan off gross revenue
  • Average Order Value (AOV) — track weekly to catch product mix shifts
  • Revenue per Customer — distinguishes transactional from loyal buyer bases

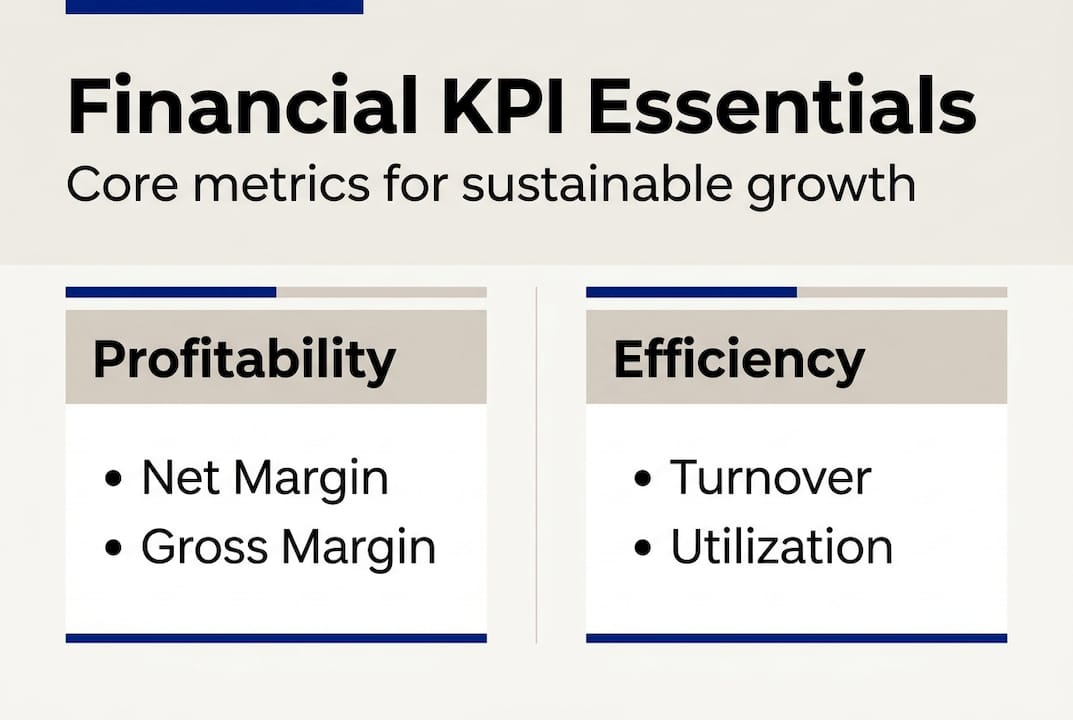
Profitability Metrics

  • Gross Margin % — target above 40% for DTC brands
  • Contribution Margin % — gross margin minus variable marketing costs
  • EBITDA Margin — operating profitability before non-cash items

Growth Efficiency Metrics

  • CAC Payback Period — months to recover customer acquisition cost
  • ROAS (Return on Ad Spend) — revenue per dollar of ad spend
  • MER (Marketing Efficiency Ratio) — total revenue ÷ total marketing spend

For a deeper dive into tracking these numbers, see our guide to mastering financial KPIs for business growth.

Inventory Metrics

  • Inventory Turnover — how many times you sell through your inventory per year
  • Days of Inventory On Hand (DOH) — inventory balance ÷ daily COGS
  • Sell-Through Rate — units sold ÷ units available, critical for seasonal products

Budgeting and Forecasting for Seasonal Businesses

E-commerce forecasting is harder than most business forecasting because demand is inherently lumpy — tied to promotions, seasons, platform algorithm changes, and macroeconomic sentiment. A single viral post or Google algorithm update can swing monthly revenue by 30%.

Building a Three-Scenario Forecast

For every planning period, model three scenarios:

  • Base case: Continuation of recent trends with modest seasonal adjustments
  • Upside case: Successful new product launches, improved ROAS, faster customer acquisition
  • Downside case: Ad cost spike, supplier delays, market softening

The downside case is not pessimism — it’s the scenario you need to survive. Your cash reserves, credit facilities, and operational flexibility should be sized to weather the downside case without existential threat to the business.

Seasonal Planning Framework

For businesses with strong Q4 seasonality (Black Friday, holiday), your annual planning should work backwards from peak season:

  1. Forecast Q4 revenue by category
  2. Calculate inventory requirements 60–90 days ahead (purchase by August–September)
  3. Determine cash needed for inventory purchase
  4. Model Q4 marketing spend and contribution margin
  5. Identify financing gap between cash available and cash needed
  6. Arrange financing in Q2–Q3, before peak season pressure hits

Understanding your break-even point for each season is essential — it tells you the minimum revenue needed to cover your seasonal fixed and variable cost commitments.

Scaling Profitably: When Growth Destroys Value

The most dangerous phase for an e-commerce business is rapid growth with underdeveloped financial systems. Here’s what typically goes wrong:

The Revenue Trap

A founder hits $1M in revenue and immediately reinvests everything into inventory and ads to hit $2M. At $2M, they reinvest again. At $3M, they realize they’ve never actually extracted profit from the business — and they’re now running a much larger, more complex operation on the same thin margins as when they started.

Profitable scaling requires setting explicit margin floors before growth investments. If your contribution margin falls below 20%, pause scaling and diagnose the cause before it compounds.

Case Study: The Margin Compression Spiral

An outdoor gear brand we worked with scaled from $800K to $2.4M in 18 months. Revenue tripled, but net profit went from $95K to $12K. The culprits:

  • Ad costs increased 40% as they competed in more competitive keywords
  • AOV dropped 15% as they added lower-margin product lines to drive volume
  • Returns jumped from 8% to 14% as product quality control suffered under volume
  • 3PL fees increased disproportionately as SKU count grew

Each of these was visible in the financial data — but no one was looking. A monthly review of core KPIs would have caught the compression early enough to course-correct.

How Fractional CFO Support Helps

Many e-commerce brands at $1M–$10M in revenue are too large to operate without financial oversight but too small to afford a full-time CFO. A fractional CFO brings institutional-grade ecommerce financial planning discipline — cash flow modeling, unit economics tracking, fundraising support — at a fraction of the cost.

E-commerce Financial Planning Checklist

  • ☐ Calculate true COGS including all fulfillment, payment, and return costs
  • ☐ Track gross margin monthly by product category
  • ☐ Build a 13-week rolling cash flow forecast and review it weekly
  • ☐ Calculate CAC and LTV by acquisition channel
  • ☐ Set a minimum contribution margin floor before scaling ad spend
  • ☐ Monitor inventory turnover and days-on-hand monthly
  • ☐ Build 3-scenario annual forecast including downside case
  • ☐ Model seasonal inventory cash requirements 90 days in advance
  • ☐ Track return rate by product line and flag anything above 15%
  • ☐ Review LTV:CAC ratio quarterly and set minimum acceptable threshold
  • ☐ Set explicit profit extraction targets — don’t let growth consume all cash

Ready to Build a Profitable E-commerce Business?

Sound ecommerce financial planning is the difference between a business that grows and one that grows profitably. If you’re running an online store between $500K and $20M in revenue and want to build financial systems that actually support your growth, we can help.

Book a free consultation with John Galt Finance and get a clear picture of your e-commerce unit economics, cash position, and path to sustainable profit.

FAQ

What is ecommerce financial planning?

Ecommerce financial planning is the process of building financial models, forecasts, and KPI frameworks specifically designed for online retail businesses. It covers unit economics (CAC, LTV, contribution margin), cash flow management (especially the inventory funding gap), P&L structuring, and seasonal forecasting — all calibrated to the unique dynamics of e-commerce operations.

What gross margin should an e-commerce business target?

Most DTC (direct-to-consumer) e-commerce brands should target gross margins of 40–60% after including all true variable costs: product cost, inbound shipping, fulfillment, outbound shipping, payment processing, and returns. Businesses below 30% gross margin typically struggle to achieve profitability because there isn’t enough margin to cover marketing, overhead, and growth investment.

How much cash reserve does an e-commerce business need?

A minimum of 8–12 weeks of operating expenses as cash reserve is a reasonable baseline. However, for seasonal businesses, you need to model the peak inventory purchase requirement separately and ensure you have access to that capital — either from reserves or a credit facility — before the buying season begins.

When does an e-commerce business need a CFO?

Most e-commerce businesses benefit from fractional CFO support once they cross $1M in annual revenue. At this stage, financial complexity — multiple SKUs, ad channels, supplier relationships, inventory management — exceeds what a bookkeeper or basic accounting software can effectively manage. A fractional CFO provides cash flow modeling, unit economics tracking, and fundraising support without a full-time salary commitment.

How should e-commerce businesses forecast for Black Friday?

Start your Black Friday forecast in Q2. Model expected revenue by product line, calculate inventory requirements 90 days in advance, determine the cash needed to fund those purchases, and identify your financing gap. Most founders who run into cash problems during peak season waited too long — they modeled revenue in August and realized they needed inventory cash in September, leaving almost no time to arrange financing.

Share this:

How to Improve Cash Flow: Expert Steps for Business Owners

Cash Flow Improvement Benchmarks

MetricBenchmark
Median DSO (B2B SMB, US)40-50 days
Best-in-class DSO25-35 days
Median DPO30-45 days
Cash freed per 10-day CCC improvement (at $5M revenue)~$137,000
SMBs that fail due to cash flow problems82% (US Bank study)
Early payment discount (typical)2/10 net 30 (2% off if paid in 10 days)
Effective annual rate of declining 2/10 net 30~36%
SMBs with a written cash policy~25%

Your revenue is growing, your sales team is crushing targets, and your product is flying off the shelf. Then your bank account runs dry. This scenario is more common than most owners want to admit, and it happens because revenue and cash flow are not the same thing. A profitable business can still fail when cash is tied up in unpaid invoices, slow-moving inventory, or poorly timed expenses. This article walks you through CFO-level strategies, from understanding your core metrics to using modern forecasting tools, so you can diagnose what’s draining your cash and take deliberate steps to fix it.

Table of Contents

Key Takeaways

PointDetails
Monitor key metricsTracking DSO, CCC, and Current Ratio monthly helps you spot cash flow trouble early.
Address bottlenecksIdentify and resolve obstacles like slow receivables and customer concentration to improve cash flow.
Build cash reservesMaintain 3-6 months of operating expenses to ensure you can weather downturns and growth periods.
Leverage technologyUse forecasting tools and automation for regular monitoring and faster response.
Think proactivelyStrategic habits—planning, reserve building, and scenario analysis—are crucial for sustainable cash flow.

Understand your cash flow fundamentals

Before you can fix a cash flow problem, you need to know what you’re measuring. Cash flow is simply the movement of money in and out of your business over a given period. Positive cash flow means more is coming in than going out. Negative cash flow means the opposite, and it can cripple operations even when your income statement looks healthy.

Here are the key metrics every business owner should track:

  • Cash flow from operations (CFO): Cash generated by your core business activities, excluding financing and investments.
  • Accounts Receivable (AR): Money your customers owe you. High AR means cash is sitting outside your business.
  • Accounts Payable (AP): Money you owe suppliers. Strategically managing AP helps you hold cash longer.
  • Days Sales Outstanding (DSO): How many days, on average, it takes to collect payment after a sale.
  • Cash Conversion Cycle (CCC): The total time from spending cash on operations to collecting it back from customers.
  • Current Ratio: Current assets divided by current liabilities. Indicates short-term financial health.

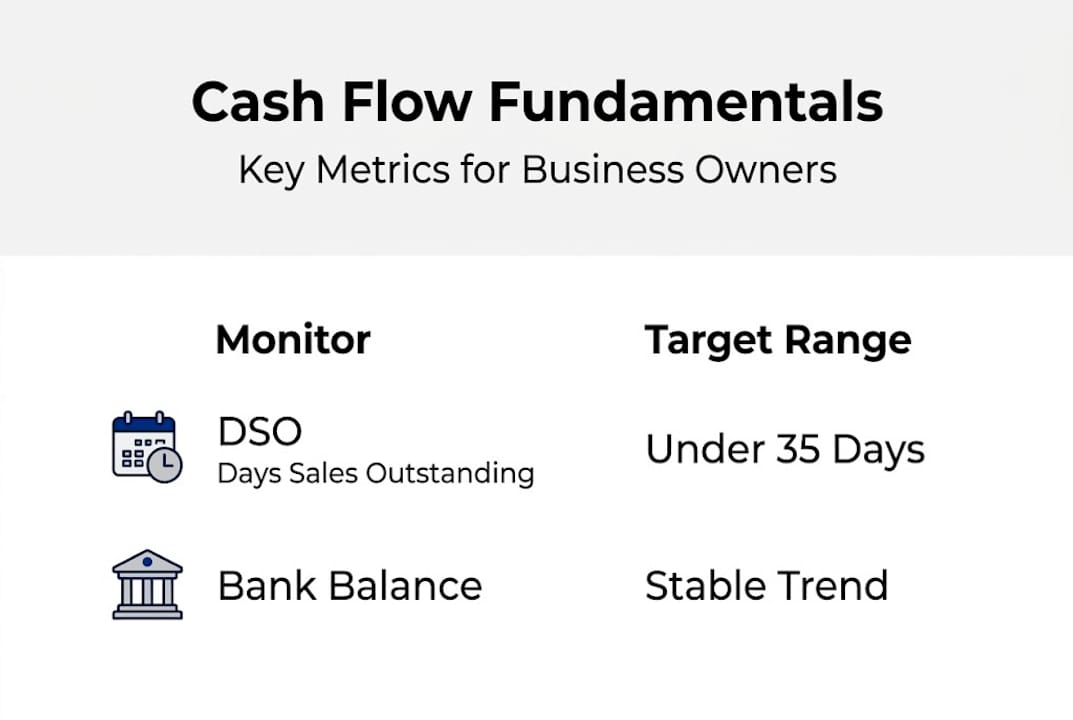
The table below shows target ranges for each metric:

MetricTarget RangeWhat It Signals
DSOUnder payment terms (e.g., under 35 for Net 30)Speed of collections
CCC30 to 45 days for service businessesOperational efficiency
Current Ratio1.5 to 2.0Liquidity health
Cash Reserve3 to 6 months of operating expensesBusiness resilience

Infographic on cash flow fundamentals for business

According to cash flow benchmarks, DSO under 35 days for Net 30 terms, a CCC between 30 and 45 days for service companies, and a Current Ratio between 1.5 and 2.0 are the targets you should be hitting. If your numbers fall short, something in your operations is leaking cash.

Bookkeeper reviewing accounts receivable report

Common pitfalls that skew these numbers include offering loose payment terms without follow-up, letting invoices age past 60 days, keeping too little reserve, and mixing personal and business expenses. Start tracking business KPIs monthly to catch early warning signs before they become emergencies.

Pro Tip: Schedule a monthly 30-minute cash flow review. Look at your AR aging report, your bank balance trend, and your upcoming AP obligations. This one habit can prevent most cash emergencies.

If you want to see how a real company went from stress to stability, this predictable cash flow case study shows exactly how the process works in practice.

Identify and address cash flow obstacles

With metrics in place, the next step is spotting and solving obstacles that drain cash. Most small and mid-size businesses face the same recurring culprits, even if the symptoms look different across industries.

The most common obstacles include:

  • Slow receivables: Customers paying late stretches your DSO and creates gaps between your obligations and income.
  • High fixed overhead: Rent, payroll, and subscriptions that don’t flex with revenue can crush cash during slow periods.
  • Seasonality: Predictable slow seasons become crises when you haven’t built reserves ahead of time.
  • Customer concentration: Relying heavily on one or two clients creates dangerous exposure. If one delays payment or leaves, your cash flow collapses.

Service businesses and manufacturers face different versions of these problems. This comparison illustrates the difference:

FactorService businessesManufacturing businesses
Primary cash riskSlow AR collectionsInventory carrying costs
Overhead flexibilityHigher (less physical assets)Lower (equipment, materials)
Seasonality exposureModerateHigh
Cash cycleShorterLonger

Research into cash flow risk patterns confirms that seasonal industries must build peak reserves and credit lines well in advance, service firms generally manage cash cycles more efficiently than manufacturers, and over-leverage combined with customer concentration are leading causes of business failure.

Practical remedies for these obstacles:

  • Renegotiate payment terms with suppliers to delay outflows.
  • Require deposits or milestone payments on large service contracts.
  • Diversify your client base to reduce dependency on any single customer.
  • Automate invoice reminders to reduce late payments without awkward follow-up calls.
  • Explore bridge financing options to cover gaps during slow seasons rather than waiting until you’re out of options.

For a deeper look at balancing inflows and outflows, the working capital management strategies guide walks through the practical steps. You can also review how to approach mitigating financial risks before they escalate.

Pro Tip: Set a cash reserve target before your busy season ends. Aim to have at least two months of operating expenses tucked away before your slow season starts.

Strategic actions to boost cash flow

Once obstacles are managed, put strategic actions in place for sustainable cash flow improvement. This is where you move from reactive firefighting to deliberate financial management.

Here are the steps to take in order:

  1. Tighten your AR process. Send invoices immediately after delivery. Set automated reminders at 7, 14, and 30 days past due. Consider small early-payment discounts (like 2% for payment within 10 days) to accelerate collections.
  2. Extend AP strategically. Pay on the last acceptable day, not the first. This keeps cash working for you longer without damaging supplier relationships.
  3. Automate invoicing and payment collection. Tools that auto-charge stored payment methods eliminate delays caused by manual follow-up.
  4. Restructure expensive debt. High-interest short-term loans drain cash fast. Refinancing into longer-term, lower-rate facilities reduces monthly obligations and frees up operating cash.
  5. Adjust your sales approach. Not every sale improves cash flow. Chasing low-margin, slow-paying clients can actually hurt your position.
  6. Run monthly scenario plans. Model best-case, base-case, and worst-case cash flows using your cash flow forecasting essentials to prepare decisions in advance.

“Sell selectively, build 3 to 6 months of reserves, and use lines of credit before a crisis, not during one.”

That quote captures the growth paradox many owners miss: chasing top-line revenue without managing cash timing creates the illusion of success while quietly building fragility. Knowing the right time for withdrawals is equally important as growing revenue.

Pro Tip: Apply for a revolving line of credit when your business is performing well. Banks approve credit based on health, not need. Waiting until you’re in a crunch often means you can’t qualify.

Forecasting, technology, and verification

To ensure lasting improvement, the right tools and verification practices make cash flow maintainable. Forecasting is not about predicting the future perfectly. It’s about reducing surprises and creating a decision-making framework you can act on.

Key benefits of cash flow forecasting include:

  • Early warning of shortfalls: A 13-week rolling forecast shows you exactly when cash will run low, giving you time to act.
  • Smarter timing decisions: You can schedule large purchases, hiring, or debt payments around your strongest cash periods.
  • Investor and lender confidence: Accurate, forward-looking cash flow models signal that you run a managed, professional operation.
  • Scenario flexibility: Model the impact of losing a major client or winning a large contract before it happens.

Here’s how leading forecasting tools compare:

ToolBest forKey features
FloatSmall service businessesBank feed sync, scenario modeling
FathomGrowing SMBsKPI dashboards, multi-currency
PulseFreelancers and small teamsSimple visual cash flow tracking
Excel/Google SheetsCustom modelsFully flexible, no subscription cost

The role of AI and automation in forecasting is growing fast. Strategic businesses are moving from reactive working capital loans to proactive term financing, and using AI tools to flag AR collection issues before they age. Reactive financing (borrowing when you’re already in trouble) tends to cost more and solve less.

Verification steps to keep your data honest:

  • Reconcile your bank statements to your cash flow forecast weekly.
  • Compare actual cash flows to projections monthly and note variances.
  • Review your AR aging report and follow up on anything over 30 days.
  • Track your key financial numbers consistently, not just when something feels wrong.

Pro Tip: Set automated alerts in your accounting software for when your cash balance drops below a defined threshold. This gives you a built-in early warning system without manual checking.

Rethinking cash flow: What most owners overlook

Here’s the uncomfortable reality: most business owners treat cash flow as a financial problem when it’s really a planning problem. The mechanics of AR and AP are simple. The discipline to act before a crisis is where most people fall short.

We see this pattern constantly at John Galt Finance. An owner focuses entirely on sales growth, assuming more revenue automatically means more cash. But growth consumes cash. Hiring, fulfillment, inventory, and delayed collections all accelerate during growth phases, often faster than payments arrive. This is why some of the most dangerous moments for a business happen right after a big win.

The owners who manage cash best share one trait: they plan for the downside while the business is doing well. They build reserves during strong quarters, run scenario plans quarterly, and review KPIs monthly rather than waiting for their accountant’s annual report. If you’re not sure whether your business needs this level of strategic support, reviewing when you need a CFO can clarify the decision quickly.

Reactive solutions, like borrowing during a crunch, are expensive and rarely fix the root cause. Strategic habits are what separate businesses that scale from those that stall.

Accelerate your cash flow: Find tailored solutions

Understanding cash flow strategy is one thing. Applying it to your specific business, industry, and growth stage is another.

https://johngalt-finance.com

John Galt Finance works with small and mid-size businesses to build real cash flow systems, not generic advice. Our cash flow forecasting guide gives you a practical framework to start forecasting today. If you want a broader financial strategy, the financial planning guide covers how to align cash management with long-term growth goals. And if you want to see what’s possible, this client case study shows how one business went from unpredictable cash to full financial control in 30 days. The right support makes the difference between managing a crisis and preventing one.

Frequently asked questions

What is the first step to improving cash flow?

Start by pulling your cash flow statement and checking your DSO against your terms. This single metric often reveals exactly where cash is getting stuck.

How much cash reserve should a business keep?

Most financial experts recommend 3 to 6 months of operating expenses as a reserve. Start building toward this target during strong revenue periods.

What tools can help with cash flow forecasting?

Software like Float, Fathom, and Pulse offer scenario planning and alerts. AI-powered forecasting tools are increasingly available for small businesses and reduce the manual work involved in tracking.

Should I prioritize paying debt or building reserves?

Balance both strategically. Pay down high-interest debt aggressively while routing a fixed percentage of revenue into reserves each month.

How can I avoid customer concentration issues?

Diversify your client base intentionally. Avoiding over-concentration means no single client should represent more than 20 to 25 percent of your total revenue.

FAQ

What’s the fastest way to improve cash flow?

Tighten receivables. Most SMBs find 30-60 days of cash by sending invoices same-day, requiring deposits on new work, automating dunning at days 7/14/21, and offering 2% early-pay discounts. See our AR management guide.

How do I balance paying suppliers and conserving cash?

Negotiate net-45 or net-60 terms with key suppliers, then pay on day 45/60. Never pay early unless you take an early-pay discount worth more than your cost of capital. The discount of 2/10 net 30 equals an annualized 36%; almost always worth taking.

Should I take a line of credit to manage cash flow?

Yes, before you need it. A revolving line of credit (LOC) of 10-20% of annual revenue is standard for SMBs. Apply when you’re profitable, not when you’re stressed; banks tighten just when you need them most. See our SMB funding options guide.

How do I forecast cash flow accurately?

Build a 13-week direct cash forecast: list every expected receipt and disbursement by week. Update weekly with actuals. Target +/- 10% accuracy by week 4. See our 13-week cash forecasting guide for the template.

When should I cut expenses to improve cash?

Only after exhausting AR tightening and AP extension. Cutting expenses takes 60-90 days to show in cash; receivables can move in 2 weeks. When you do cut, focus on discretionary opex first (marketing tests, software subscriptions, T&E), not headcount.

Share this:

Top 6 trustpilot.com Alternatives 2026

Online Review & Reputation Benchmarks

MetricBenchmark
Consumers who read reviews before purchase93% (BrightLocal 2024)
Minimum star rating to be considered4.0 of 5.0
Revenue lift per 1-star rating increase5-9% (Harvard Business School)
Trustpilot Business cost (Plus plan)$259/month billed annually
Response rate that signals trust to consumers>40% of negative reviews replied
Reviews needed to neutralize one 1-star~10 five-star reviews
Conversion lift from displaying reviews+270% on product pages (Spiegel Research)
Average review platforms an SMB should monitor3-5 (Google, industry-specific, niche)

Finding the perfect platform to manage customer reviews often feels like searching for a hidden gem. Many businesses and individuals want tools that offer trust and transparency while giving them better control over their online reputation. With so many options out there, each claiming to have something unique, the search can quickly become overwhelming. Discovering what sets certain platforms apart and how they handle feedback can make all the difference. Get ready to explore new possibilities as you look beyond the familiar names.

Table of Contents

John Galt Finance

Product Screenshot

At a Glance

John Galt Finance delivers outsourced CFO-level expertise for small and medium businesses that need strategic finance without hiring full time staff. It combines hands-on analysis, tailored financial models, and ongoing advisory to drive profitability and prepare companies for fundraising.

Core Features

John Galt Finance centers on Record Keeping, Financial Reporting (P&L, Cash Flow, Balance Sheet), Financial Planning and Analysis, and Strategic Finance services. The team builds customized financial models, runs cash flow forecasts, and provides product planning and pricing guidance that align with growth goals.

Pros

  • Customized outsourcing solutions for various industries: The service adapts methods and deliverables to sector specific needs rather than offering one-size-fits-all reports.
  • Experienced team of finance professionals: Clients work with senior analysts and strategists who handle modeling, diagnostics, and ongoing CFO support.
  • Wide range of services including financial modeling, planning, and strategy: From record keeping to M&A advice, the offering covers operational and strategic finance needs.
  • Flexible packages and one-off services tailored to client needs: You can engage for a single diagnostic, a project, or ongoing outsourced CFO support based on your budget and timeline.
  • Global clientele and remote service availability: The remote model supports entrepreneurs and established companies across time zones without adding full time payroll.

Who It’s For

This service targets small to medium sized businesses and startups with 5 to 50 employees and annual revenues between $500K and $20M. Founders and finance leaders who need scalable financial discipline, investor ready models, and hands-on strategy choose this option.

Unique Value Proposition

John Galt Finance stands out because it pairs customized financial models with ongoing advisory that directly links numbers to strategic decisions. Sophisticated buyers pick this service when they want a partner who will build investor grade forecasts, optimize pricing and resource allocation, and act as a fractional CFO during pivots or fundraises. The firm’s proven process from demo analysis to diagnostics and ongoing management produces measurable outcomes such as improved margins and successful funding rounds. Pricing by consultation is an intentional design choice to match scope to value rather than force a fixed plan that may not fit your business.

Real World Use Case

A startup engaged John Galt Finance to develop investor pitch models, tighten cost structure, and produce a two year cash flow forecast. The result was a clearer path to funding, a prioritized roadmap for hiring, and a repeatable model that supported a successful seed round.

Pricing

Pricing details are provided upon request via consultation and are not listed publicly. This model allows the team to scope engagements to your needs and present a cost that reflects the specific deliverables and timeline.

Website: https://johngalt-finance.com

Feefo

Product Screenshot

At a Glance

Feefo provides verified customer reviews and tools to gather, manage, and display feedback so businesses can improve products and reputation. It emphasizes authentic review collection and analytics to help brands convert visitors into customers.

Core Features

Feefo combines collection, management, and display tools with analytics to turn feedback into actionable insight. The platform centers on verified reviews and includes tools to respond and analyze customer sentiment.

  • Invite customers to leave reviews after purchase and interaction.
  • Collect both product and service reviews for richer feedback.
  • Display reviews on your website to boost conversion and trust.
  • Manage and respond to reviews from a central dashboard.
  • Analyze customer feedback with analytics tools and AI powered insights.
  • Showcase authentic reviews and use trust badges to reinforce credibility.
  • Syndicate reviews across channels for consistent social proof.

Pros

  • Verified and authentic reviews: Feefo emphasizes confirmed purchaser feedback which reduces fake reviews and raises trust with site visitors.
  • Comprehensive management tools: The dashboard lets you collect, display, and respond to reviews in one place for operational efficiency.
  • Analytics that inform decisions: The analytics and AI features help you identify recurring issues and product opportunities.
  • Marketing friendly display options: Review syndication and trust badges make it easier to use reviews in campaigns and on product pages.
  • Scales with business size: The platform supports small shops through larger enterprise accounts across sectors like retail and automotive.

Cons

  • Implementation time: The detailed feature set and integration options require time to implement and learn for staff and partners.
  • Limited public pricing transparency: Pricing information is only available through direct contact which makes initial budget planning harder.

Who It’s For

Feefo fits businesses that want to collect confirmed customer feedback and use it to improve sales and service. Small and medium sized retailers and service providers that rely on online reputation and conversion will get the most value.

Unique Value Proposition

Feefo stands out by combining verified review collection with analytics and syndication so you get trustworthy social proof plus data you can act on. This mix helps businesses improve reputation while informing product and service decisions.

Real World Use Case

A retailer sends review invitations after every sale, displays collected reviews on product pages, and responds to negative feedback to reduce returns. The retailer then analyzes review themes to prioritize product improvements and track service KPIs.

Pricing

Pricing details are available on request through Feefo contact channels. Businesses evaluate plans directly with Feefo to match required features and scale.

Website: https://www.feefo.com

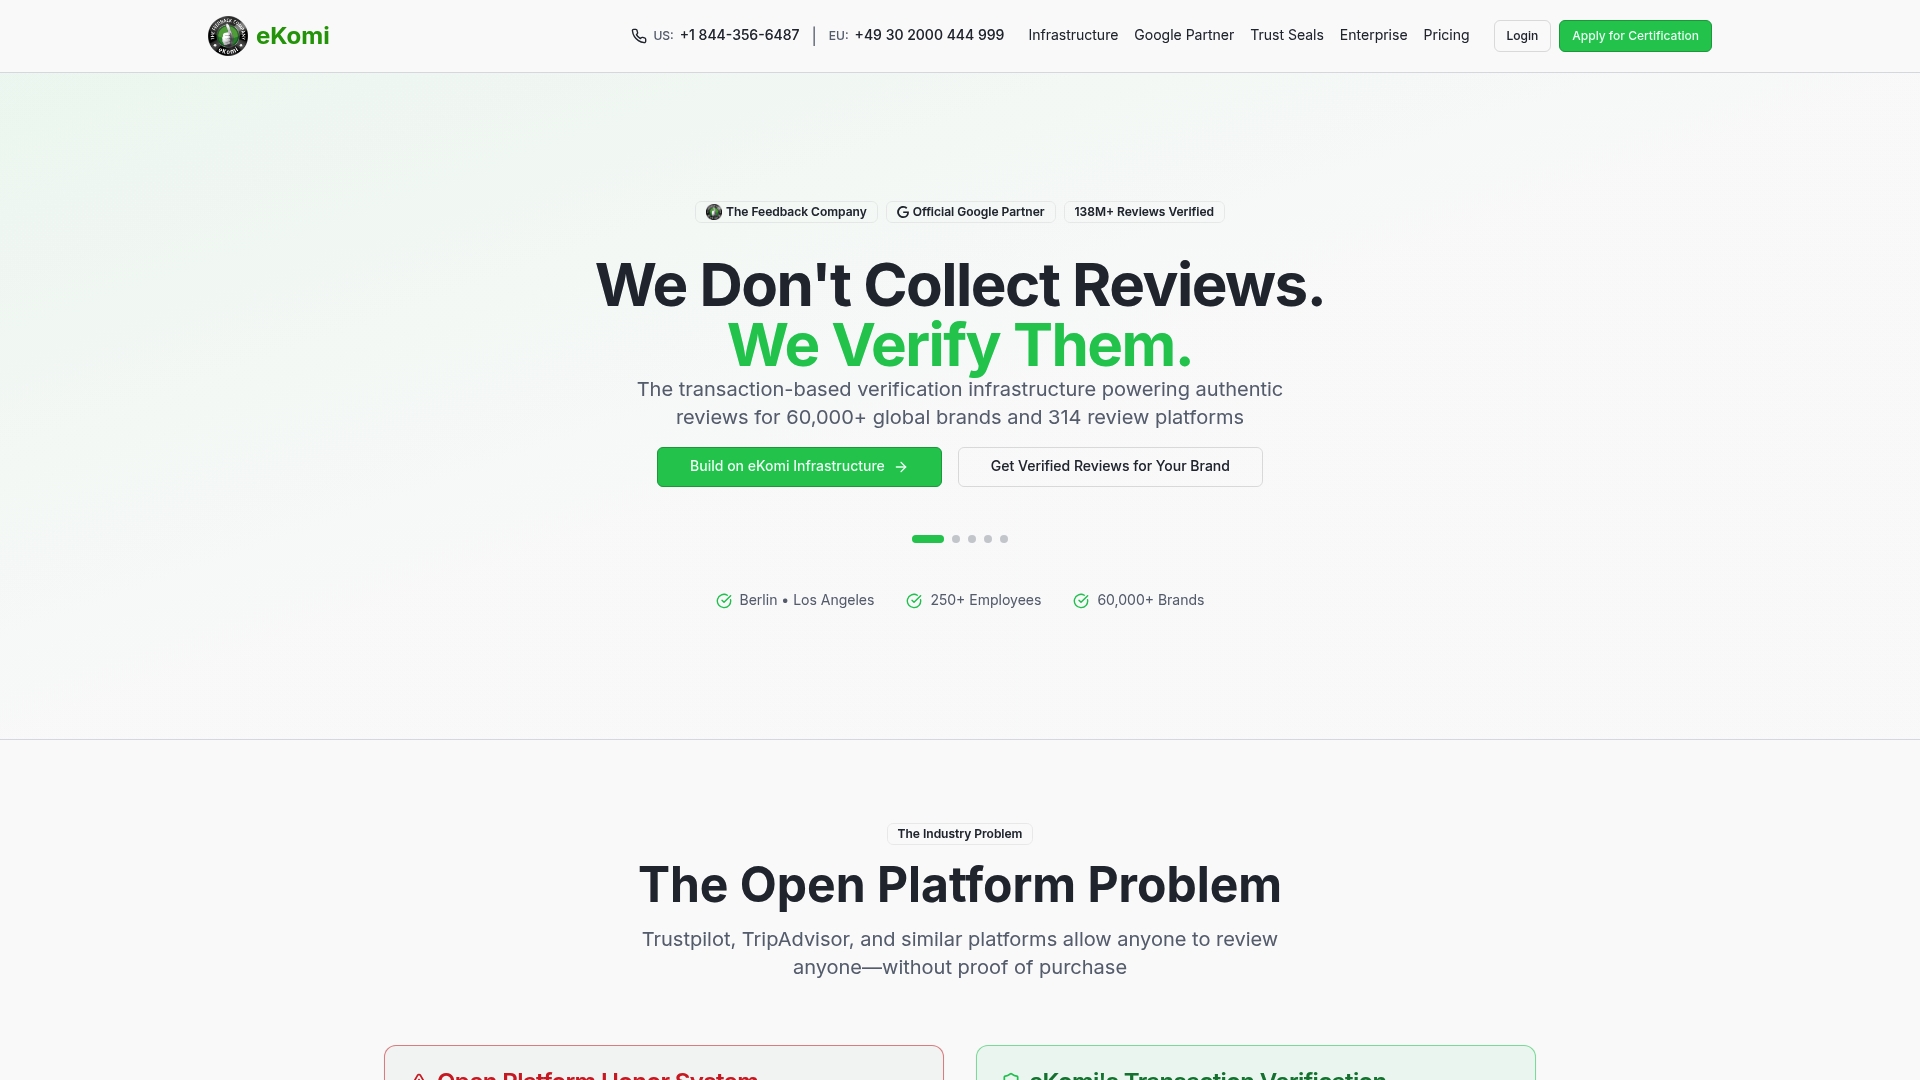
eKomi

Product Screenshot

At a Glance

eKomi delivers verified reviews backed by actual purchases and a transaction based verification infrastructure trusted by over 60,000 brands worldwide. It excels at turning authenticated customer feedback into visible trust signals across Google Search and advertising channels.

Core Features

eKomi centers on a transaction based review verification system that captures reviews only after purchase and links them to proof of transaction. The platform supports multi channel collection, multi format submissions, real time AI assisted moderation, and integration with major e commerce platforms and Google services.

Pros

  • Verified credibility: Reviews are tied to actual purchases which increases trust in ratings and reduces fake feedback for potential customers.
  • Multi channel reach: The platform collects reviews via email, SMS, social media, and in store which helps you capture feedback where customers already engage.
  • Multi format submissions: Customers can submit text, video, photo, or audio reviews which creates richer social proof for product pages and marketing.
  • Moderation blend: eKomi pairs human review with AI assisted moderation to help maintain review integrity while scaling throughput.
  • Global support footprint: A global infrastructure with local offices and support helps brands manage reputation across markets with regional understanding.

Cons

  • Pricing is custom and requires consultation which makes it hard to estimate total cost for small teams on a tight budget.
  • The focus on transaction based reviews limits open public review models and may reduce volume if you rely on non transaction feedback.
  • Enterprise level integrations can be complex and the setup effort may be extensive for smaller businesses without technical resources.

Who It’s For

Mid to large sized businesses and platforms that prioritize authentic, transaction verified customer reviews will get the most value from eKomi. Brands that want deep Google integration and multi channel distribution benefit the most from its capabilities.

Unique Value Proposition

eKomi’s unique value is its combination of transaction verification, Google partnership, and visible trust seals that appear in search and ads. That mix lets you convert verified feedback into measurable trust signals across shopping experiences.

Real World Use Case

A global retailer uses eKomi to collect verified reviews after each purchase, displays trust seals on product pages and in search results, and relies on those reviews to increase consumer confidence and lift conversion rates across regions.

Pricing

Pricing is custom and based on review volume and integration needs which means you will need a consultation to get a tailored quote and plan aligned with your traffic and platform complexity.

Website: https://www.ekomi.com

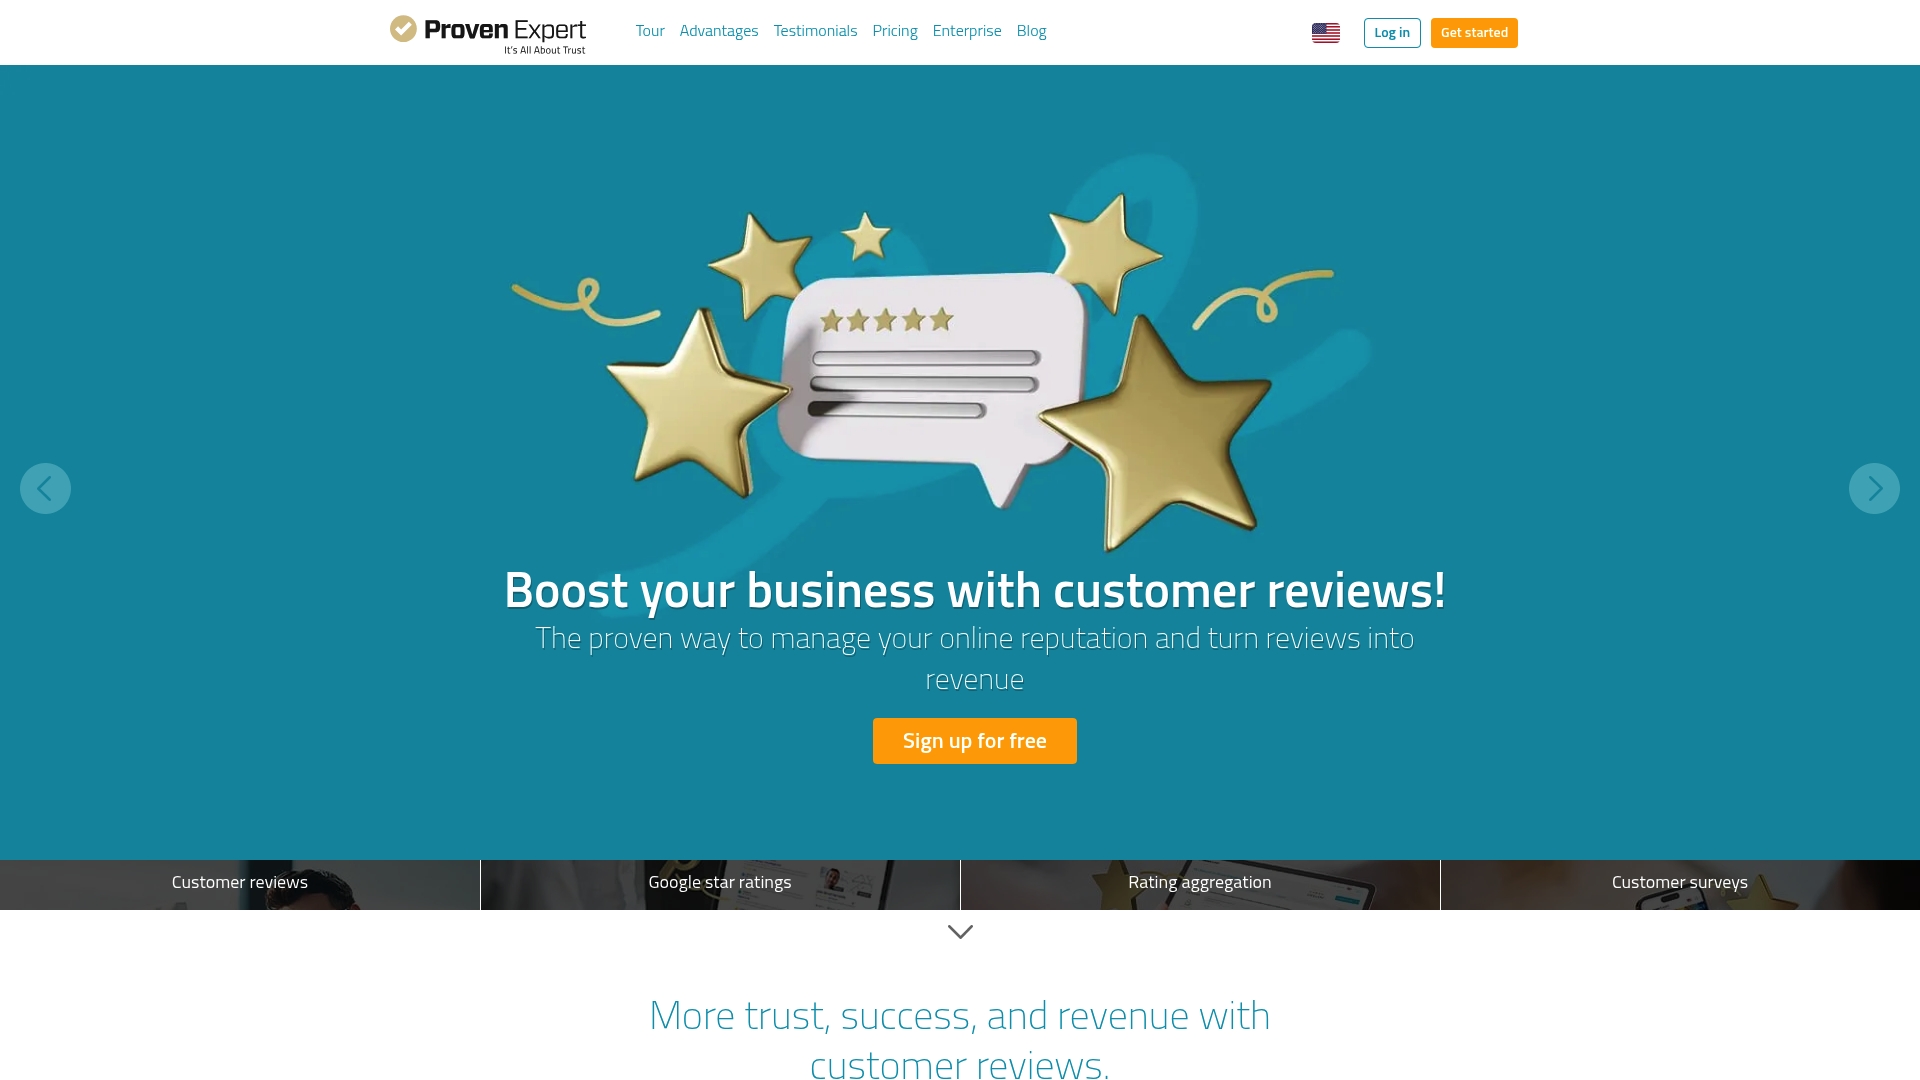
ProvenExpert

Product Screenshot

At a Glance

ProvenExpert helps businesses collect and showcase customer reviews to build trust and increase online visibility. It is strong at aggregating feedback and displaying review seals that make credibility visible to prospective customers.

Core Features

ProvenExpert offers customer review management and aggregation, review seals and rating display options, customer surveys and feedback collection, integration with Google star ratings and other review platforms, and real-time review notifications and monitoring. These capabilities let you gather feedback, publish ratings, and track mentions across channels.

Pros

  • User-friendly interface and easy onboarding: The platform presents a clean workflow that helps teams invite customers and publish reviews with minimal training.
  • Effective for online reputation enhancement: Displaying aggregated scores and seals helps visitors recognize credibility quickly and can improve conversion signals on your site.
  • Supports multi-platform review aggregation: It pulls ratings from several sources so you can view a consolidated reputation profile rather than checking multiple dashboards.
  • Customizable review and survey templates: You can tailor feedback requests to match your brand voice and the questions that matter for improving services.
  • Can help increase online visibility and customer trust: The combined effect of aggregation and visible ratings supports discoverability and trust building for small and medium sized businesses.

Cons

  • Pricing may be relatively high for some small businesses and could stretch tight marketing budgets.
  • The platform depends on customer participation for reviews which means results vary with client engagement and outreach effort.
  • The breadth of features may feel extensive for very small or sole proprietorships that prefer a simpler toolset.

Who It’s For

ProvenExpert serves businesses that want a centralized way to collect and present customer feedback. It fits small and medium sized service providers, local shops, consultancies, and professional firms that rely on referrals and online trust to win clients.

Unique Value Proposition

ProvenExpert stands out by turning scattered feedback into a single credibility asset you can display across touchpoints. Its combination of review aggregation, visible review seals, and survey tools makes reputation management practical for teams without a full time marketer.

Real World Use Case

A local service provider uses ProvenExpert to request reviews after each job, display positive ratings on their landing page, and monitor new feedback in real time. The result is clearer social proof that helps attract nearby customers searching for reliable, reviewed providers.

Pricing

Pricing is available upon inquiry and the platform offers a free trial option. Note that some small businesses report pricing as relatively high compared with simpler review tools.

Website: https://www.provenexpert.com

ConsumerAffairs

Product Screenshot

At a Glance

ConsumerAffairs aggregates verified consumer reviews and pairs them with expert-backed guides to help people compare providers across categories like auto, home, senior care, and finance. The platform emphasizes real user experiences while also publishing research and ratings to highlight top companies.

Core Features

ConsumerAffairs offers verified reviews, expert guides, top company ratings, tailored recommendations, and ongoing news and research reporting. These combined elements let users read firsthand experiences, consult expert context, and see ranked providers in a single place for faster decision making.

Pros

  • Authentic consumer feedback: Reviews are presented as firsthand accounts, which helps readers judge real experiences with products and services.
  • Comprehensive guides and resources: Expert-backed content summarizes key factors to consider when choosing a provider, saving time on research.
  • Assists in making informed purchase decisions: The mix of reviews and ratings gives a rounded view of a company’s strengths and weaknesses.
  • Connects consumers with top-rated companies: Ratings and recommendations help surface providers that consistently score well with reviewers.
  • Provides unbiased news and research: Reporting and research pieces add context beyond individual reviews to highlight broader trends.

Cons

  • Site may be paid by companies displayed on the site: Paid listings can create perceived conflicts between editorial content and commercial placement.
  • Not a government regulated agency: ConsumerAffairs is an independent platform and does not act as an official regulator or certification body.
  • Content is informational only and requires personal analysis: Readers must still verify details and apply their own judgment before committing to a purchase.

Who It’s For

ConsumerAffairs suits consumers and small business owners who want structured, experience-based input before hiring a service or buying a product. Business owners seeking financial or service providers can use it to cross-check vendor reputations and read detailed user reports prior to making a commitment.

Unique Value Proposition

The platform’s strength lies in combining verified user experiences with expert guidance and company ratings in one place. That combination shortens research time for decision makers and offers both anecdotal and analytical viewpoints to evaluate providers.

Real World Use Case

A homeowner researching home warranty providers can read verified reviews to learn common service issues, consult comparative ratings to see top companies, and use the expert guides to understand contract terms before choosing a provider.

Pricing

ConsumerAffairs is free to use for consumers, while companies may pay for visibility or verification services to enhance their presence on the site.

Website: https://www.consumeraffairs.com

SmartCustomer (formerly Sitejabber)

Product Screenshot

At a Glance

SmartCustomer gathers millions of customer reviews and pairs them with confidence assurance tools so buyers can check reputations before they buy. It is useful when you need a quick sentiment check on a vendor or website.

Takeaway: Use SmartCustomer to verify seller reliability before committing to a purchase.

Core Features

SmartCustomer lets users browse millions of reviews, write and share business reviews, and access a browser extension that shows live ratings while shopping. The site also groups businesses into clear categories and provides resources and recognition for consumer protection.

Action: Install the extension to see ratings while you shop online.

Pros

  • Large review database: The platform hosts an extensive collection of reviews from real customers which helps surface a broad range of experiences.
  • Helps buying decisions: Aggregated feedback and ratings give you relevant information to compare vendors quickly before purchasing.
  • Consumer protection recognition: The site highlights awards and recognition that signal trust for consumers and businesses.
  • Business resources available: Companies can access tools and resources to manage reputation and respond to customers proactively.
  • Browser extension convenience: The extension provides live ratings while you browse so you do not need to leave the store page to check reputation.

Cons

  • Reviews may sometimes be biased or unverified which reduces reliability when making high value decisions.
  • The platform provides limited information about its review moderation process which leaves questions about how fraudulent posts are handled.
  • Navigation could be overwhelming for new users which slows the process of finding focused, industry specific feedback.

Who It’s For

SmartCustomer fits consumers looking for trustworthy reviews and businesses that need basic reputation management tools. Small and medium sized business owners who track customer sentiment and respond to reviews will find practical value here.

Action: If your team needs a centralized place to monitor public feedback, SmartCustomer can act as an early warning system.

Unique Value Proposition

SmartCustomer combines a very large review archive with consumer protection recognition and a live browser extension so you get context and convenience at once. That mix makes it simple to check reputations while you shop or to monitor mentions of your business.

Real World Use Case

A shopper reads multiple reviews on SmartCustomer before buying electronics to verify product reliability and seller responsiveness. A business uses the platform to monitor reviews daily and respond to concerns to protect brand reputation and reduce churn.

Pricing

The service is free to use with optional resources and a browser extension available to users and businesses.

Website

Website: https://www.sitejabber.com

Business Tools Comparison

This table provides a comprehensive comparison of the mentioned tools, highlighting their features, pros, cons, and pricing models to aid businesses in selecting the most suitable service.

Tool NameCore FeaturesProsConsPricing
John Galt FinanceCFO outsourcing, financial analysis, customized modeling, strategic financial advisoryTailored solutions, experienced team, wide service range, flexible engagement options, global availabilityPricing details are not publicCustom by consultation
FeefoVerified reviews, feedback management, analytics, marketing display optionsVerifiable feedback, comprehensive tools, actionable analytics, user-friendly display, scalable solutionsImplementation requires time, pricing is on requestCustom by consultation
eKomiTransaction-verified reviews, Google integration, multi-format feedback options, AI moderationHighly verified feedback, multi-channel reach, diverse submission options, global supportCustom pricing, transaction-based review dependencyCustom quote based on needs
ProvenExpertReview aggregation, rating display, client surveys, Google star integrationUser-centric design, reputation support, multi-platform compatibility, customizable templatesPricing potentially high for small businessesPricing via inquiry, offers a trial
ConsumerAffairsVerified consumer reviews, expert guides, and tailored company recommendationsAuthentic feedback, expert-backed guides, helps informed decisions, connects to top-rated companiesOffers paid business listings, requires individual assessmentFree for consumers
SmartCustomerLarge review database, online shopping ratings, live browser extensionBroad feedback archive, purchasing confidence with ratings, assists in consumer protectionSome unverified reviews, navigation could be challengingFree for consumers

Discover Strategic Finance Solutions Beyond Review Platforms

Choosing the right customer review platform is essential to build trust, but managing your business’s financial health is equally critical for long-term success. The article “Top 6 trustpilot.com Alternatives 2026” highlights challenges like verifying authenticity and gaining actionable insights. Meanwhile, many businesses struggle with making confident financial decisions without expert support.

John Galt Finance offers more than just financial analysis. We provide customized financial models, expert forecasting, and fractional CFO services designed to empower small and medium businesses. This tailored approach addresses the pain points of profitability, fundraising preparation, and operational clarity with direct strategic guidance.

Take control of your financial future and elevate your growth strategy today. Visit John Galt Finance to explore how our flexible solutions can work for your business needs.

https://johngalt-finance.com

Ready to move from uncertainty to actionable financial insight Connect with our team now at John Galt Finance and start shaping a stronger financial foundation for your company.

Frequently Asked Questions

What are the top features to look for in alternatives to Trustpilot.com?

When searching for alternatives to Trustpilot.com, look for features such as verified reviews, easy integration, and robust analytics tools. These elements help businesses collect authentic feedback and leverage data for decision-making. Aim for platforms that offer a reliable method for gathering customer insights.

How can I ensure the reviews collected on an alternative platform are authentic?

To ensure authenticity, choose platforms that use verified review systems or confirm purchases before allowing feedback submission. Prioritize tools that emphasize customer verification, which can help reduce the presence of fake reviews and enhance credibility.

What kind of analytics should I expect from Trustpilot.com alternatives?

Alternatives to Trustpilot.com should provide insightful analytics regarding reviewer sentiment, trends in feedback, and areas for improvement. Look for features that allow you to track customer satisfaction scores over time and gain insights into common themes in the reviews, enabling better strategic decisions.

How can I effectively integrate an alternative review platform into my existing workflow?

To integrate an alternative review platform smoothly, start by identifying the key features that align with your business needs. Implement tools that offer easy connection options with your current systems, such as e-commerce platforms or CRM software, and train your team on how to utilize the new system effectively.

Is it possible to collect both product and service reviews using these alternatives?

Yes, many alternatives support the collection of both product and service reviews. Select platforms that allow businesses to customize review requests for various aspects of their offerings, ensuring a comprehensive view of customer feedback across all services and products.

How do I choose the right alternative for my business size and type?

When selecting the right alternative, consider the size of your business and your specific needs, such as volume of reviews and required features. Evaluate platforms that cater to your industry and scale, ensuring they offer solutions tailored to small businesses or larger enterprises based on your requirements.

FAQ

What’s the cheapest legitimate Trustpilot alternative for an SMB?

Google Business Profile is free and drives the highest local SEO impact. For paid alternatives, Reviews.io starts around $89/month and Yotpo offers a free tier for under 100 monthly orders. Most SMBs under $5M revenue don’t need a paid review platform; they need a process to ask every customer for a Google review.

How many reviews does my business need to convert visitors?

Conversion impact plateaus around 50 reviews with a 4.2+ average. Below 10 reviews, consumers discount the rating as unreliable. Aim for at least 25 reviews per location or product line within the first 6 months of launching a review-collection program.

Should I respond to negative reviews?

Yes, within 48 hours. Studies show 89% of consumers read business responses to reviews, and a professional reply to a 1-star review can recover 33% of would-be lost customers. Never argue facts publicly; acknowledge, apologize, and move the conversation offline.

How do review platforms impact my business valuation?

Online reputation is now a diligence item in M&A. A buyer will discount EBITDA multiples by 0.5-1.5x if your aggregate rating is below 4.0 across major platforms. See our guide on business valuation methods for how intangibles factor into multiples.

Is paying for a review platform a justifiable expense?

If your customer lifetime value is over $500 and reviews drive purchase decisions in your category (e-commerce, SaaS, professional services), a $100-300/month review tool typically pays back in under 90 days through conversion lift. For local service businesses, free Google Business Profile usually suffices.

Share this:

8 Key Signs Your Business Needs a CFO for Growth

Running a growing business is exciting until the financial complexity quietly outpaces your ability to manage it. Revenues climb, headcount expands, and suddenly the spreadsheet you built three years ago no longer tells you what you need to know. Most small and medium-sized business owners don’t realize they’ve crossed a critical threshold until a cash flow crisis hits or a major opportunity slips by. Knowing the signs your business needs a CFO before things go sideways is one of the most valuable moves you can make as a leader focused on sustainable growth.

Table of Contents

Key Takeaways

PointDetails
Recognize red flagsEarly cash flow issues and stalled profits often signal it’s time for CFO help.
Understand role differencesA CFO brings big-picture strategy far beyond bookkeeping and controller duties.
Explore flexible solutionsFractional CFOs offer strategic insights without the cost of a full-time hire.
Act before crises hitProactive CFO involvement can prevent costly mistakes and drive sustainable growth.

When does a business outgrow DIY finance?

Every business starts with basic bookkeeping. You track income, manage expenses, and maybe use accounting software to stay organized. That works well at early stages. But as your business grows, the financial decisions you face become more layered, more consequential, and harder to get right without specialized expertise.

The shift happens gradually. You notice you’re spending more time interpreting numbers than running the business. Your accountant can tell you what happened last quarter, but nobody on your team can tell you what’s likely to happen next quarter or why your margins keep shrinking despite higher sales. That gap between recording the past and planning the future is exactly where a CFO adds irreplaceable value.

Common triggers that signal you’ve outgrown basic finance include:

  • Revenue exceeding $1 million with no formal financial forecasting in place
  • Multiple revenue streams or entities that make consolidated reporting difficult
  • Hiring decisions being made without a clear view of labor cost impact
  • Investors or lenders asking questions your team can’t confidently answer
  • Month-end close taking weeks instead of days

As why SMEs need CFO services explains, when businesses outgrow bookkeeping and basic finance, strategic direction and advanced financial leadership are required. The difference between a bookkeeper vs CFO isn’t just seniority. It’s an entirely different function.

Pro Tip: If you find yourself making major financial decisions based on gut instinct rather than data-backed forecasts, that’s your clearest early warning sign.

The 8 crucial signs you need a CFO

Once you understand that DIY finance has limits, the next step is recognizing which specific signals are telling you it’s time to act. These aren’t minor inconveniences. They’re structural gaps that compound over time.

  1. Cash flow is unpredictable. You’re profitable on paper but constantly scrambling for cash. This disconnect between profit and liquidity is a classic CFO problem to solve.
  2. Revenue grows but profits don’t. Sales are up, but margins are flat or shrinking. Without deep financial management for profitability, the root cause stays hidden.
  3. Financial reports are late or fragmented. If your team can’t close the books within 10 business days, decision-making suffers across the board.
  4. You’re missing strategic opportunities. A potential acquisition, partnership, or market entry goes unexplored because you lack the analysis to evaluate it.
  5. The business is scaling rapidly or restructuring. New locations, product lines, or entity structures demand a financial architect, not just an accountant.
  6. Tax and compliance surprises keep happening. Unexpected tax bills or regulatory issues signal that your financial oversight has blind spots.
  7. Fundraising or financing feels impossible. Banks and investors want detailed models, projections, and scenario analysis. If you can’t produce them, you lose deals.
  8. Leadership is drowning in finance tasks. When executives spend hours on financial admin instead of strategy, the business pays a hidden opportunity cost.

As the full list of signs you need a CFO makes clear, financial performance stagnates, cash flow becomes unpredictable, or critical decisions lack reliable forecasts when CFO-level oversight is missing.

Pro Tip: Track how many hours per week you personally spend on financial tasks. If it’s more than five hours, you’re likely doing work a CFO or their systems should be handling.

Stressed owner multitasking finances at desk

Exploring CFO services for growth early means you address these signals before they become crises.

CFO vs. Bookkeeper vs. Controller: Who handles what?

One reason business owners delay getting CFO support is confusion about what each finance role actually does. Hiring the wrong level of help is expensive and frustrating. Here’s how the three core roles break down.

RolePrimary focusKey outputsStrategic value
BookkeeperDaily transactionsLedgers, payroll, bill paymentsLow
ControllerAccounting oversightFinancial statements, complianceMedium
CFOFinancial strategyForecasts, growth plans, investor relationsHigh

As the Bookkeeper vs CFO differences breakdown shows, bookkeepers focus on records, controllers on reporting, and CFOs on strategy. Each role is valuable, but they serve fundamentally different purposes.

A bookkeeper keeps your records clean and current. A controller makes sure your financial statements are accurate and compliant. A CFO asks the harder questions: Where is this business going? What risks are we not seeing? How do we fund the next phase of growth?

Key distinctions to keep in mind:

  • Bookkeepers work in the past, recording what already happened
  • Controllers work in the present, ensuring accuracy and compliance
  • CFOs work in the future, modeling scenarios and guiding decisions

Understanding fractional CFO duties helps clarify that even part-time CFO engagement delivers the forward-looking analysis your business needs. If you’re unsure where your gaps are, reviewing the finance leadership roles breakdown can help you map your current team against what you actually need.

Fractional CFOs and modern solutions for SMEs

Hiring a full-time CFO is a significant commitment. Base salaries for experienced CFOs often exceed $200,000 annually, which puts that option out of reach for most SMEs. That’s where fractional and outsourced CFO models change the equation entirely.

A fractional CFO works with your business on a part-time or project basis, providing the same strategic expertise at a fraction of the cost. They’re not a junior consultant. They’re typically seasoned finance executives who work across multiple clients simultaneously.

Common engagement models include:

  • Project-based: One-time engagements for fundraising prep, financial modeling, or restructuring
  • Monthly retainer: Ongoing strategic support, typically 10 to 30 hours per month
  • Outsourced CFO: A fully embedded virtual CFO function integrated with your team
OptionEstimated monthly costBest for
Full-time CFO$15,000 to $25,000+Companies over $20M revenue
Fractional CFO$2,000 to $8,000SMEs with $500K to $10M revenue
Outsourced CFO$1,500 to $5,000Early-stage or lean teams

As fractional CFOs for growing businesses demonstrates, fractional CFOs offer strategic guidance without the full-time salary burden. For most SMEs, this model delivers an exceptional return on investment.

Pro Tip: When evaluating a fractional CFO provider, ask for examples of financial models they’ve built and metrics they’ve moved for businesses similar to yours in size and industry.

Coupling fractional CFO support with strategic finance best practices gives your business a complete financial infrastructure without the overhead of a full internal finance team.

What business owners get wrong about hiring a CFO

Here’s the uncomfortable truth most articles won’t tell you: the biggest CFO mistake isn’t hiring the wrong person. It’s waiting too long to hire anyone at all.

Most owners assume CFO-level guidance is reserved for companies with 100 employees or $50 million in revenue. That assumption costs them years of compounding growth. The businesses that scale fastest are almost always the ones that introduced strategic financial leadership earlier than their peers thought necessary.

A fractional CFO guide isn’t just a cost-saving workaround. It’s a growth accelerator. When you have someone modeling your cash runway, stress-testing your pricing, and preparing your financials for investor scrutiny before you need funding, you make better decisions at every stage.

The ROI of early CFO engagement isn’t just financial. It’s the deals you don’t lose, the mistakes you don’t make, and the opportunities you actually pursue because you have the data to back them. Timing matters far more than budget.

How to access CFO expertise for your business

If the signals in this article sound familiar, you don’t need to wait for a crisis to take action. Strategic financial leadership is more accessible than ever for SMEs.

https://johngalt-finance.com

At John Galt Finance, we work with business owners who are ready to move beyond basic bookkeeping and into proactive, growth-focused financial management. Whether you need CFO services for your SME, a tailored custom financial modeling process to support your next funding round, or fully fractional CFO solutions built around your business stage, we have a model that fits. Start with a diagnostic conversation and find out exactly where your financial gaps are before they become expensive problems.

Frequently asked questions

What is the main difference between a CFO and a bookkeeper?

A bookkeeper manages day-to-day transactions, while a CFO provides strategic financial leadership and guides long-term growth. As the bookkeeper vs CFO comparison shows, bookkeepers focus on transaction recordkeeping while CFOs drive strategy.

How can a fractional CFO help my small business?

A fractional CFO offers high-level financial guidance when you need it, without the cost of a full-time executive. Fractional CFOs provide SME financial strategy on a flexible, scalable basis.

Can early CFO involvement help prevent major financial mistakes?

Yes. A CFO can identify risks, improve cash flow, and refine your strategy before problems escalate. Early financial leadership is key to avoiding costly SME mistakes.

What are affordable ways to access CFO-level expertise?

Fractional or outsourced CFO services make expert financial leadership accessible without hiring full-time. These flexible, cost-effective solutions are designed specifically for growing SMEs.

What signals should prompt a business owner to seek CFO input?

Common signals include cash flow uncertainty, missed growth opportunities, difficulty with financial statements, or complex scaling needs. Unpredictable cash flow and growth challenges are among the clearest indicators that CFO expertise is needed.

Share this:

Why SMEs Need CFO Services: Unlock Growth and Clarity

Key Facts & Benchmarks

MetricBenchmark
SMBs that fail due to cash flow problems82% (U.S. Bank study)
Fractional CFO monthly retainer range$2,000 – $10,000
Full-time CFO total comp (US)$200,000 – $450,000/year + equity
Typical fractional CFO commitment10 – 40 hours/month
Time to first ROI (margin/cash improvement)60 – 90 days
Revenue band where fractional CFO is optimal$500K – $20M ARR
SMBs that say lack of financial clarity hurts decisions61% (QuickBooks survey)

Most business owners assume CFO services are reserved for corporations with hundreds of employees and sprawling finance departments. That assumption is costing smaller businesses real money. The truth is, SMEs (small and medium-sized enterprises) are often the ones who benefit most from strategic financial leadership, precisely because the margin for error is so much smaller. Without someone steering the financial ship with clarity and foresight, growth stalls, cash flow tightens, and decisions get made on gut instinct instead of data. This article breaks down why CFO-level guidance isn’t a luxury for SMEs. It’s often the missing piece between where you are and where you want to be.

Table of Contents

Key Takeaways

PointDetails
CFOs drive SME growthStrategic financial leadership helps small businesses overcome barriers and seize opportunities.
Outsourced options save costsFractional CFO services provide high-level expertise without the full-time commitment.
Data powers smart decisionsWith CFO input, SMEs switch from gut feelings to robust, evidence-backed strategies.
Timing mattersEarly adoption of CFO services maximizes growth and prevents costly missteps.

Understanding the financial challenges SMEs face

Most SMEs don’t fail because of a bad product or a weak team. They fail because the financial infrastructure never caught up with the ambition. The gap between running a business and running it profitably is almost always a financial visibility problem.

Here’s what that looks like in practice. You’re generating revenue, but you’re not sure why profit margins keep shrinking. Your bank account looks fine one month and terrifying the next. You’re making hiring and expansion decisions based on what feels right rather than what the numbers actually support. Sound familiar?

The core financial challenges SMEs face tend to cluster around a few persistent pain points:

  • Limited access to real-time financial data, making it nearly impossible to spot trends before they become problems
  • Inconsistent cash flows that create working capital pressure and force reactive decision-making
  • No formal scenario planning, leaving businesses exposed when market conditions shift unexpectedly
  • Absence of structured KPIs (key performance indicators), so there’s no reliable way to measure whether the business is actually improving

These aren’t small inconveniences. They compound. A cash flow gap in Q1 becomes a missed hiring opportunity in Q2, which becomes a growth plateau by year-end. As noted in SME financial management research, SMEs lack advanced financial insights and planning tools, which constrains sustainable growth.

Financial ChallengeImpact on SMEWithout CFO Guidance
Cash flow gapsMissed payroll, delayed growthReactive borrowing
No forecastingSurprise shortfallsCrisis management
Weak KPI trackingNo performance benchmarksGut-based decisions
No scenario planningVulnerability to market shiftsUnprepared pivots

Tracking the right essential growth metrics is the first step toward financial clarity. And building a solid foundation often starts with custom financial modeling that reflects your actual business, not a generic template.

“The biggest financial risk for an SME isn’t a bad quarter. It’s not knowing a bad quarter is coming until it’s already arrived.”

Pro Tip: Financial blind spots rarely announce themselves. Build a monthly review cadence into your operations now, before complexity forces you to.

How CFO services solve SME financial roadblocks

Understanding the challenges naturally raises the question: what can a CFO actually do to change outcomes for SMEs? Quite a lot, it turns out, and the impact shows up faster than most owners expect.

A CFO doesn’t just look at your books. They build the systems, forecasts, and reporting structures that let you run your business with confidence instead of anxiety. Here’s how that plays out across the four biggest problem areas:

  1. Cash flow management and forecasting. A CFO maps your inflows and outflows across rolling 13-week windows, identifying gaps before they hit. CFOs provide advanced forecasting that helps SMEs anticipate cash shortfalls instead of reacting to them.
  2. KPI development and monitoring. Without the right metrics, you’re flying blind. A CFO defines which numbers actually matter for your business model and builds dashboards that surface them weekly.
  3. Financial modeling for decision support. Thinking about a new product line or a second location? A CFO builds models that stress-test those decisions against multiple scenarios before you commit capital.
  4. Operational process optimization. CFOs often find margin improvements hiding in plain sight: vendor contracts, billing cycles, inventory turnover, and pricing structures that quietly erode profitability.
ApproachWithout CFOWith CFO
Cash flow visibilityMonthly snapshotsRolling 13-week forecast
Decision-makingInstinct-basedModel-supported
KPI trackingAd hoc or noneStructured dashboards
Financial reportingReactiveProactive and forward-looking

Pro Tip: A good CFO doesn’t just prevent financial fire drills. They eliminate the conditions that cause them in the first place.

For SMEs serious about financial management for growth, the CFO function is what converts raw revenue into sustainable profit. Pairing strong SME cash flow forecasting with disciplined key financial metrics tracking creates a feedback loop that keeps the business on course.

SME owner reviewing financial reports workspace

Data-driven decisions: The CFO advantage

Now that you see how CFOs address barriers, let’s explore the competitive difference their input makes in real decisions. This is where the CFO function goes from useful to transformative.

Most SME owners are smart, experienced operators. But even the best operators make suboptimal decisions when they’re working from incomplete or delayed financial information. A CFO changes the information environment entirely.

Here’s what data-driven financial leadership actually looks like in practice:

  • Real-time dashboards that surface gross margin, burn rate, and revenue concentration at a glance
  • Scenario analysis that models the financial impact of major decisions before you make them
  • Variance reporting that flags when actuals deviate from plan and explains why
  • Rolling forecasts that update as conditions change, not just once a year during budget season

Consider a concrete example. An SME owner is weighing whether to open a second location. Without CFO support, that decision relies on optimism and rough math. With a CFO, it relies on a detailed model showing break-even timelines, working capital requirements, and the cash flow impact across three different revenue scenarios. The decision doesn’t just feel better. It is better.

Businesses with strong financial leadership are significantly more likely to achieve sustained profitability and growth. That’s not a coincidence. It’s the direct result of replacing guesswork with structure.

Statistic: Companies that implement CFO-level financial oversight report up to 2x faster revenue growth compared to peers operating without structured financial leadership.

Understanding the Bookkeeper vs CFO distinction is critical here. A bookkeeper records what happened. A CFO shapes what happens next. And if you’re unsure whether your business is ready, reviewing fractional CFO responsibilities can clarify exactly what that role delivers. A solid financial control process is what separates businesses that scale from businesses that stall. The fractional CFO guide at John Galt Finance walks through how this works for businesses at different growth stages.

Choosing and leveraging outsourced CFO services

If you’re ready to reap these benefits, here’s how to approach choosing and integrating CFO services efficiently. The good news is that you don’t need to hire a full-time executive to access this level of financial leadership.

Outsourced CFO services give SMEs affordable access to high-level finance talent, structured around your actual needs rather than a fixed salary commitment. Here’s a practical framework for making it work:

  1. Identify your trigger. The right time to bring in an outsourced CFO is typically when you’re experiencing rapid growth, increasing financial complexity, recurring cash flow stress, or preparing for fundraising.
  2. Evaluate provider fit. Look for a CFO partner with direct experience in your industry, a track record with businesses at your revenue stage, and flexibility in engagement structure.
  3. Define clear goals upfront. The relationship works best when you enter it with specific outcomes in mind: improve cash flow visibility, build a 12-month forecast, prepare investor-ready financials.
  4. Establish a reporting rhythm. Monthly financial reviews, weekly cash flow updates, and quarterly strategy sessions create the accountability structure that makes CFO guidance actionable.
  5. Communicate openly. A CFO can only work with the information you share. Transparency about challenges, goals, and constraints is what separates a productive engagement from a surface-level one.

A step-by-step financial planning approach helps frame what you want from the engagement before the first conversation. Pairing that with a clear understanding of financial planning for business at your stage ensures you’re asking the right questions from day one.

Pro Tip: Outsourced CFO services let you access senior financial expertise without the overhead of a full-time executive. For most SMEs, that flexibility is exactly what makes the model so powerful.

A CFO isn’t a luxury for SMEs—it’s a strategic multiplier

Here’s the conventional view: CFOs are for companies that have already made it. You build the business first, then you bring in the financial leadership to manage what you’ve built. It sounds logical. It’s also backwards.

The SMEs that grow fastest and most profitably are almost never the ones that waited until they were “big enough” for a CFO. They’re the ones that used financial leadership as the lever that got them to scale. Waiting until complexity forces your hand means you’ve already absorbed the costs of operating without strategic oversight, missed opportunities, inefficient capital allocation, and decisions made without the right data.

We’ve seen this pattern repeatedly. The businesses that engage signs you really need a CFO early don’t just avoid problems. They move faster, raise capital more successfully, and make fewer costly reversals. Strategic long-term planning isn’t something you add after growth. It’s what enables growth in the first place. The most expensive CFO is the one you didn’t hire when you needed one.

Connect with world-class CFO expertise for your SME

If this article has clarified one thing, it’s that strategic financial leadership isn’t something to defer until your business is larger. The businesses growing fastest right now are the ones that made financial clarity a priority early.

https://johngalt-finance.com

John Galt Finance specializes in outsourced and fractional CFO services built specifically for SMEs ready to grow with intention. Whether you’re navigating cash flow pressure, preparing for investment, or simply want to make better decisions with better data, we can help. Start by exploring does your SME need a CFO, then understand fractional CFO services to see how flexible, high-impact financial leadership fits your business. Ready to take the next step? Connect with John Galt Finance today.

Frequently asked questions

When should an SME consider hiring a CFO?

An SME should consider a CFO when experiencing rapid growth, increased financial complexity, or recurring cash flow issues. Growth transitions and complex reporting are clear signals that you need more financial expertise on your side.

What’s the difference between a CFO and a bookkeeper for SMEs?

A bookkeeper manages daily transactions, while a CFO offers strategic planning, forecasting, and high-level financial oversight. Bookkeepers and CFOs serve fundamentally different roles, and most growing SMEs eventually need both.

How can outsourced CFO services be affordable for small businesses?

Outsourced or fractional CFOs provide top-tier expertise on a project or part-time basis, lowering the cost compared to full-time hires. Fractional CFOs offer flexible solutions suited to SME budgets without sacrificing strategic depth.

Which financial metrics should SMEs track for better business decisions?

Key metrics include gross profit margin, cash flow, accounts receivable, and customer acquisition costs for informed decisions. Cash flow and profitability metrics are essential for business stability and long-term planning.

Can a CFO help with securing financing or investment?

Yes, CFOs prepare proper financial documentation and forecasts to support loan or investor applications. CFOs manage strategic planning and ensure your financials are investor-ready when the opportunity arises.

FAQ

At what revenue should an SMB hire a fractional CFO?

The sweet spot is $500K – $20M in annual revenue. Below $500K, a strong bookkeeper plus monthly advisory calls is usually enough. Above $20M, full-time CFO economics start to work. Most companies hire their first fractional CFO around $1.5-3M in revenue, when complexity outpaces what the owner can mentally hold.

Fractional CFO vs. full-time CFO — which is better?

A full-time CFO costs $200K-$450K/year fully loaded. A fractional CFO costs $24K-$120K/year for 10-40 hours/month. Until you have $15M+ in revenue or imminent fundraising/M&A, fractional CFOs deliver 80% of the strategic value at 15-30% of the cost. The transition to full-time usually happens when CFO bandwidth (not skill) becomes the bottleneck.

What does a fractional CFO actually do day-to-day?

Typical month: monthly close review, 13-week cash flow forecast update, KPI dashboard refresh, board/investor reporting, pricing or unit economics analysis, fundraising or banking conversations, and one to two strategic deep-dives (margin diagnosis, headcount planning, vendor negotiation). About 40% of time is recurring, 60% project-driven.

How fast does a fractional CFO pay for themselves?

Most engagements show ROI in 60-90 days. Typical first-quarter wins: 5-15% margin lift from pricing or cost analysis, 10-30 days of working capital freed via AR/AP discipline, or a refinanced credit facility worth tens of thousands annually. A $5K/month CFO usually delivers $30K-$100K in measurable improvement within the first year.

What’s the difference between a bookkeeper, controller, and CFO?

Bookkeeper records transactions (looking backward, days). Controller closes the books and ensures accuracy (looking backward, weeks). CFO turns financial data into forward-looking decisions about pricing, capital, growth, and exit (looking forward, quarters and years). You need all three functions; in an SMB the fractional CFO often supervises the bookkeeper and partial controller work.

Share this:

Unlock business growth by mastering financial KPIs

Financial KPI Benchmarks for SMBs

KPIBenchmark
Gross margin (B2B services)40-60%
EBITDA margin (mature SMB)10-20%
Revenue growth rate (top quartile SMB)20%+ annually
Customer acquisition cost (CAC) payback<12 months
LTV:CAC ratio>3:1
Net revenue retention (SaaS)>100% (best-in-class >120%)
Cash conversion cycle (manufacturer)<60 days
Revenue per FTE (services)$150,000-$300,000

Most business owners are either drowning in spreadsheets or flying blind with gut instinct alone. Neither works. The real problem is not a lack of data but tracking the wrong numbers or misreading what they mean. Financial KPIs (Key Performance Indicators) are not a corporate luxury reserved for Fortune 500 companies. They are the clearest signal system available to any SMB owner who wants to make faster, more confident decisions. This guide breaks down the KPIs that actually move the needle, translates the jargon into plain language, and shows you exactly how to apply them to your business today.

Table of Contents

Key Takeaways

PointDetails
Core KPI categoriesSMBs should focus on profitability, liquidity, efficiency, and growth when choosing KPIs.
Not all KPIs fitSelect and customize KPIs to suit your business stage and industry rather than copying generic lists.
Monitor regularlyReview your chosen KPIs consistently to spot trends quickly and course-correct before issues grow.
Understand the storyThe right KPIs answer very specific questions about your business health and momentum.
Expert help adds valueA fractional CFO or finance specialist can help you create and interpret powerful KPI dashboards.

What are financial KPIs and why do they matter?

A Key Performance Indicator is a measurable value that tells you how effectively your business is achieving its goals. In a financial context, KPIs are the numbers that reveal whether your business is healthy, stressed, growing, or quietly bleeding cash. They are not vanity metrics. They are diagnostic tools.

For small and medium-sized businesses, financial KPIs for SMBs are categorized into four core groups: profitability, liquidity, efficiency, and growth. Each category answers a distinct question about your business.

  • Profitability: Are you actually making money after all costs?
  • Liquidity: Can you cover your bills and survive a slow month?
  • Efficiency: Are your operations lean, or are you leaving cash on the table?
  • Growth: Is your business expanding, stalling, or contracting?

Think of these four categories as the dashboard of a car. You would not drive without checking your speed, fuel, and engine temperature. Running a business without these KPIs is exactly that.

“Owners who consistently track the right financial KPIs report making faster, more confident decisions, especially when facing growth inflection points or cash pressure.”

The power of KPIs is not just in measurement. It is in prioritization. When you know your numbers, you stop guessing and start steering. You can spot a problem three months before it becomes a crisis. You can identify which product line is quietly dragging down your margins. You can tell investors, lenders, or partners a clear financial story backed by data.

If you are not sure where to start, exploring essential financial metrics for SMB growth gives you a strong foundation. And if you are wondering whether your business has outgrown your current financial setup, reviewing when you need a CFO can help you recognize the signs early. The goal is not to track everything. It is to track what matters most for your specific business right now.

A well-chosen set of financial KPIs every owner should track becomes a repeatable system, not a one-time exercise.

Profitability KPIs: Measuring the bottom line

Profitability KPIs tell you whether your business model actually works. Revenue is not profit. Many SMBs with strong top-line numbers are quietly losing money once all costs are factored in. These three KPIs cut through the noise.

Manager analyzing profitability reports in conference room

Gross Profit Margin (GPM) measures how efficiently you produce your product or deliver your service. The formula: (Revenue minus Cost of Goods Sold) divided by Revenue. A healthy SMB target is 30 to 50 percent or higher, depending on your industry. A SaaS business might sit at 75 percent. A retail store might run at 35 percent. Neither is wrong. Context is everything.

Net Profit Margin goes deeper. It accounts for every expense: rent, salaries, taxes, interest, and overhead. This is your true bottom line. A business can have a 50 percent gross margin and a 3 percent net margin, which means operational costs are consuming most of the value created.

EBITDA (Earnings Before Interest, Taxes, Depreciation, and Amortization) strips out financing and accounting decisions to show raw operational profitability. It is especially useful when comparing your business to industry peers or preparing for a funding conversation.

MetricRetail benchmarkSaaS benchmarkProfessional services
Gross Profit Margin30 to 40%70 to 90%50 to 70%
Net Profit Margin2 to 6%10 to 20%15 to 25%
EBITDA Margin4 to 8%15 to 30%20 to 35%

Here is what each profitability KPI helps you answer:

  • GPM: Is my pricing and production model sustainable?
  • Net Profit Margin: Are my operating costs under control?
  • EBITDA: How does my operational performance compare to competitors?

Pro Tip: Watch the gap between your gross margin and net margin closely. A widening gap means costs are growing faster than revenue. That gap is where profit leaks hide, often in underpriced services, bloated overhead, or untracked expenses.

Your small business pricing strategy directly impacts GPM, so revisiting your pricing model is one of the fastest ways to improve profitability without cutting staff or reducing quality. Tracking these key financial KPIs consistently turns profitability from a quarterly surprise into a predictable outcome.

Liquidity KPIs: Can your business meet its financial obligations?

A profitable business can still fail. That sounds counterintuitive, but it happens regularly when a company cannot convert its assets into cash fast enough to pay its bills. Liquidity KPIs measure your ability to meet short-term obligations, and they are often the difference between surviving a slow quarter and closing your doors.

Current Ratio is the most widely used liquidity measure. The formula: Current Assets divided by Current Liabilities. A Current Ratio of 1.5 to 2 is considered healthy for most SMBs. Below 1 means you owe more in the short term than you have available, which is a serious warning sign.

Quick Ratio is a stricter version. It removes inventory from current assets before dividing by current liabilities. This matters because inventory is not always easy to convert to cash quickly, especially in manufacturing or retail.

RatioFormulaHealthy rangeWhat it signals
Current RatioCurrent Assets / Current Liabilities1.5 to 2.0Overall short-term health
Quick Ratio(Current Assets minus Inventory) / Current Liabilities1.0 to 1.5Stress-tested liquidity

Here is how to calculate and interpret your ratios:

  1. Pull your most recent balance sheet.
  2. Identify total current assets (cash, receivables, inventory).
  3. Identify total current liabilities (accounts payable, short-term debt).
  4. Divide assets by liabilities for Current Ratio.
  5. Subtract inventory from assets, then divide again for Quick Ratio.
  6. Compare your results to the benchmarks above and track changes monthly.

Pro Tip: If your business holds significant inventory, the Quick Ratio is your real stress test. A strong Current Ratio can mask a liquidity problem if most of your assets are tied up in slow-moving stock.

“For inventory-heavy businesses, a Current Ratio above 2 can still signal risk if inventory turnover is slow. Always read liquidity ratios alongside efficiency data for a complete picture.”

A regular financial health check helps you catch liquidity issues before they become emergencies. Monitoring liquidity metrics for SMBs alongside profitability gives you the full picture of your financial position.

Efficiency and growth KPIs: How well are you operating and scaling?

Profitability and liquidity tell you where you stand. Efficiency and growth KPIs tell you how fast you are moving and whether your operations support that speed. These metrics expose bottlenecks, slow payers, and hidden cash traps that net profit alone will never reveal.

Key efficiency and growth KPIs for SMBs include:

  • Inventory Turnover: How many times you sell and replace inventory in a period. Higher turnover means less cash tied up in stock. Low turnover signals overbuying or weak demand.
  • Accounts Receivable Turnover: How quickly customers pay you. A low ratio means cash is sitting in unpaid invoices instead of your bank account.
  • Cash Conversion Cycle (CCC): The number of days it takes to convert investments in inventory and receivables into actual cash. Shorter is better. Manufacturing firms often see a CCC of 60 to 90 days, while service businesses can achieve 15 to 30 days.
  • Revenue Growth Rate: The percentage increase in revenue over a set period. It signals business momentum, market fit, and scalability potential.

Stat callout: Manufacturing businesses average a Cash Conversion Cycle of 60 to 90 days, while service-based firms often achieve 15 to 30 days, reflecting how capital-intensive operations slow cash flow.

Efficiency KPIs are especially powerful because they reveal problems that profitability metrics hide. You might show a healthy net margin while carrying 90 days of unpaid invoices. That is a cash flow crisis waiting to happen. Improving managing receivables efficiency directly shortens your CCC and frees up working capital without any new revenue.

For businesses with complex inventory or payment cycles, working capital insights provide a deeper framework for optimization. If you run a software or subscription business, a dedicated SaaS KPIs guide will help you prioritize the metrics most relevant to your model.

The right efficiency KPIs depend on your business model. A product company prioritizes inventory turnover. A service firm focuses on receivables and utilization rates. Match the metric to the model.

Infographic comparing key financial KPI categories

Why the best KPI playbook is one you customize

Here is the uncomfortable truth most financial guides skip: there is no universal KPI list that works for every business. Generic KPI checklists are a starting point, not a strategy.

A pre-revenue startup should be obsessing over burn rate and runway, not Return on Invested Capital (ROIC). A mature, cash-generating business should be tracking ROIC, customer lifetime value, and margin trends, not burn rate. Applying the wrong KPIs to the wrong stage is like using a marathon training plan to prepare for a sprint. The effort is real but the result is off.

Tailoring KPIs to your stage and goals is what separates businesses that use data to grow from those that collect data and feel busy. We have seen SMBs track 20 KPIs religiously and still make poor decisions because none of those metrics connected to their actual constraints.

The businesses that win are the ones that ask: “What are the two or three numbers that, if they moved, would change everything about how we operate?” That question leads to a focused, actionable KPI dashboard. Building a custom KPI modeling framework around your specific business model, stage, and goals is the most direct path from data collection to real decision-making power.

Take your financial strategy further with expert support

Understanding KPIs is one thing. Building a system that tracks, interprets, and acts on them consistently is another challenge entirely.

https://johngalt-finance.com

At John Galt Finance, we build custom financial modeling frameworks tailored to your business stage, industry, and goals. Whether you need a focused KPI dashboard, a full profitability analysis, or ongoing strategic guidance, our team delivers CFO-level insight without the cost of a full-time hire. You can also explore more on financial KPIs to deepen your understanding before taking the next step. When you are ready for hands-on support, our Fractional CFO services give you the expertise to turn the right numbers into the right decisions, every month.

Frequently asked questions

Which financial KPIs are most important for small businesses?

Profitability margins, current ratio, quick ratio, and revenue growth rate are the most essential for most SMBs, as they cover the four core financial KPI categories: profitability, liquidity, efficiency, and growth.

How often should I update my financial KPIs?

Review your KPIs monthly at minimum, and shift to weekly tracking during periods of rapid growth, cash pressure, or significant operational change.

What’s the difference between Gross Profit Margin and Net Profit Margin?

Gross Profit Margin measures production efficiency by comparing revenue to the cost of goods sold, while Net Profit Margin reflects true profitability after every expense including overhead, taxes, and interest.

Can too many KPIs be a bad thing?

Absolutely. Tracking too many metrics creates noise and dilutes focus. The best approach is to tailor KPIs to stage and goals so every number on your dashboard connects directly to a decision you need to make.

What if my industry’s average KPI numbers are very different?

Industry benchmarks like retail’s 30 to 40% gross margin versus SaaS at 70 to 90% exist as context, not rules. Your internal trend over time is a more reliable signal than any external average.

FAQ

How many KPIs should I track?

7-12 on the executive dashboard, 20-30 in detailed operating reports. More than 12 on the dashboard creates noise and decision paralysis. Pick KPIs that pass the “so what?” test: if it moves 20%, your action changes.

What KPIs matter most for an early-stage SMB?

Five essentials: revenue growth rate, gross margin, cash runway, customer count, and customer concentration (top customer %). Add CAC payback and gross retention as soon as you have repeat customers. See our dashboard guide for build templates.

How often should I review KPIs?

Weekly for operational KPIs (pipeline, cash, AR), monthly for financial KPIs (margin, EBITDA, runway), quarterly for strategic KPIs (LTV, NRR, market share). Daily KPI checking usually creates panic without insight.

What’s the difference between leading and lagging KPIs?

Leading KPIs predict the future (pipeline, demo bookings, trial conversions). Lagging KPIs report the past (revenue, EBITDA, retention). Best dashboards have 60% leading, 40% lagging. Lagging-only dashboards are obituaries.

How do I know if my KPIs are actually useful?

Apply three tests: (1) can you influence it (actionable), (2) does it tie to strategy (relevant), (3) is it measured the same way every time (reliable). KPIs that fail any test get dropped. Vanity metrics (total downloads, page views) usually fail all three.

Share this:

Strategic finance best practices: SME owner’s guide to growth

Strategic Finance Benchmarks for SMBs

PracticeSMB BenchmarkImpact
Monthly close completed byBusiness day 10 or earlierDecisions made on fresh data
Cash runway tracked13 weeks forward, weeklyNo surprise insolvency
Budget vs. actual variance threshold+/- 5% on revenue, 3% on marginEarly warning system
KPI dashboard refresh cadenceWeekly minimumOperating discipline
Pricing review frequencyEvery 6-12 months2-7% margin lift per cycle
Working capital cycle targetBelow 60 days CCCSelf-funding growth
Forecast accuracy target (90-day)+/- 10% on revenueCredible to banks/investors
Operating cash buffer3-6 months OpExSurvive shock without dilution

Most small and medium-sized business owners know they need a financial strategy, but far fewer understand what separates a strategy that actually works from one that just looks good on paper. The gap between thriving and struggling often comes down to a handful of CFO-level practices that most SMBs never implement. 60-70% of SMBs can avoid bankruptcy with early turnaround financing and planning. This guide delivers the proven financial best practices that outsourced CFOs use every day to protect and grow businesses like yours.

Table of Contents

Key Takeaways

PointDetails
Separate profit from cashUnderstanding the difference is fundamental to avoiding hidden cash flow crises.
Monitor every costRigorous tracking of all input costs prevents margin erosion and financial surprises.
Be proactive with creditSet up and review credit options in advance to stay agile and resilient.
Use rolling forecastsA 13-week forward view lets you spot and solve challenges before they become threats.

Understand the real difference between revenue and cash flow

While many SMBs focus on boosting sales, the actual flow of cash often determines survival. Revenue is the income your business earns from selling products or services. Cash flow is the real movement of money into and out of your bank account. These two numbers rarely match, and that gap can quietly sink a business that looks profitable on paper.

Manager comparing revenue and cash flow charts

Here is a simple example. You close a $50,000 contract in January. You record that as revenue. But your client pays on 60-day terms, so the cash does not arrive until March. Meanwhile, you still have payroll, rent, and supplier invoices due in February. That is the cash flow vs profit trap that catches so many growing businesses off guard.

Confusing revenue with cash is a leading cause of SMB financial distress. The fix starts with tracking both numbers separately and understanding the timing difference between them.

Projected revenue vs. actual cash position (sample month)

MonthProjected RevenueInvoices CollectedOperating OutflowsNet Cash Position
January$80,000$55,000$62,000-$7,000
February$90,000$70,000$65,000+$5,000
March$85,000$88,000$60,000+$28,000

This table shows how a business can book strong revenue while still running a negative cash position. The warning signs of cash flow mismanagement include:

  • Consistently paying vendors late even when sales are strong
  • Drawing on a line of credit to cover regular operating expenses
  • Inability to predict your cash balance more than two weeks out
  • Surprise shortfalls right before payroll or tax deadlines
  • Revenue growing but bank balances staying flat or shrinking

“Cash flow problems do not announce themselves. They build quietly until a single missed payment triggers a chain reaction.”

A solid cash flow forecasting guide gives you the framework to see these problems before they hit. Pair that with a step-by-step financial planning approach to connect your cash forecast to your broader business goals.

Pro Tip: CFOs rely on the 13-week rolling cash flow forecast because it covers exactly one business quarter. It is short enough to be accurate and long enough to give you real decision-making time. Build one, update it weekly, and you will almost never be surprised by a cash crunch.

Track and control all input costs rigorously

Effective cash flow is only as sound as your cost controls. Input costs are every expense that goes into delivering your product or service: raw materials, labor, software subscriptions, shipping, packaging, and any vendor fees tied to production or delivery. These costs are often overlooked because they seem fixed or routine, but they drift upward faster than most owners realize.

Untracked input costs are a bankruptcy trap for SMBs. The solution is a real-time cost tracking system built into your monthly financial rhythm.

Steps to implement real-time cost tracking:

  1. List every input cost category relevant to your business, including direct and indirect costs.
  2. Assign ownership: one person is responsible for monitoring each category.
  3. Set a baseline cost for each category using the last three months of actual spend.
  4. Connect your accounting software to your bank and card feeds so transactions post automatically.
  5. Create weekly variance reports comparing actual spend to baseline for each category.
  6. Flag any category that exceeds baseline by more than 5% for immediate review.
  7. Review the full cost report in your weekly financial check-in meeting.

The most common unmonitored expenses that quietly drain SMB margins include:

  • Annual software subscriptions that auto-renew at higher rates
  • Vendor price creep on recurring supply orders
  • Payment processing fees that increase with transaction volume
  • Overtime and contractor costs that are not tracked against project budgets
  • Shipping and logistics surcharges added without notice
  • Bank fees and foreign exchange costs on international payments

Strong profitability management requires you to know your margin at the product or service level, not just at the company level. Tracking key financial metrics by segment tells you which parts of the business are carrying the others. Solid budgeting strategies help you set realistic cost targets and hold teams accountable to them.

Pro Tip: Set up an automated dashboard in your accounting platform that flags any cost category rising more than 5% above baseline. This turns cost control from a monthly review into a live early-warning system.

Build financial resilience with reliable credit strategies

Having controlled costs, strategic access to credit can make or break your company’s agility. Most SMBs treat credit as an emergency tool. That is exactly backwards. The best time to secure a credit line is when you do not need it, because lenders offer better terms to businesses that look financially healthy.

Unreliable credit lines are a common cause of SMBs running into serious trouble. Relying on a single credit provider leaves you exposed if that lender tightens terms, reduces your limit, or exits the market entirely.

Credit options comparison for SMBs

Credit typeBest forProsCons
Term loanEquipment, expansionFixed payments, predictableLess flexible, requires strong credit
Line of creditWorking capital gapsDraw as needed, revolvingVariable rates, can be reduced by lender
Bridge financingShort-term cash gapsFast access, flexibleHigher cost, short repayment window
Invoice financingSlow-paying clientsImmediate cash from receivablesFee-based, reduces invoice value

For short-term liquidity needs, bridge financing options can fill gaps while longer-term solutions are arranged. Understanding how to attract the right type of financing is covered in detail in our guide on attracting business financing.

Best practices for managing business credit proactively:

  • Review your credit facilities annually, even when you are not using them
  • Maintain relationships with at least two lenders so you always have a backup
  • Draw on your credit line occasionally and repay promptly to build a usage history
  • Keep your debt service coverage ratio (DSCR) above 1.25 to remain attractive to lenders
  • Monitor your business credit score quarterly and dispute errors immediately
  • Separate strategic debt (growth investment) from survival borrowing (covering operating losses)

Strategic debt funds assets that generate returns greater than the cost of borrowing. Survival borrowing funds losses. One builds your business. The other delays a problem that needs a different solution entirely.

Adopt 13-week forecasting and scenario planning

Solid credit and cost controls need to be paired with forward-looking financial insight. The 13-week rolling cash flow forecast is the single most powerful tool a CFO brings to a small business. It covers one full quarter, updated every week, so you always have a live view of where your cash is heading.

CFOs favor this time frame because it is long enough to act on what you see and short enough that the numbers stay accurate. Monthly forecasts are too infrequent. Annual projections are too abstract. Thirteen weeks sits in the sweet spot.

Steps to build and maintain a 13-week rolling forecast:

  1. List all expected cash inflows week by week: collections, deposits, and any scheduled receipts.
  2. List all fixed outflows: payroll, rent, loan payments, and recurring subscriptions.
  3. Add variable outflows: inventory, contractor payments, and marketing spend.
  4. Calculate the net cash position for each week.
  5. Identify any weeks where the balance drops below your minimum operating threshold.
  6. Build three versions: base case, best case, and worst case, using realistic assumptions for each.
  7. Update the forecast every Monday morning before the week begins.

Scenario planning is where this tool becomes genuinely powerful. Your worst-case scenario should assume your two largest clients delay payment by 30 days simultaneously. If your business can survive that scenario, you have real resilience. If it cannot, you now know exactly what to fix.

Key stat: SMBs that implement early forecasting and turnaround financing avoid bankruptcy in 60-70% of cases.

Our cash forecasting process walks you through building this model from scratch, with templates designed for businesses at every stage.

Pro Tip: Review and revise your forecast every week, not once a month. Weekly updates catch problems three to four weeks earlier than monthly reviews, and that extra time is often the difference between a manageable fix and a crisis.

Our perspective: What most articles miss about strategic finance

Most guides on strategic finance treat it as a setup task. Build a budget in January, review it in December, and call it done. That approach is not a strategy. It is a ritual.

The SMBs we see navigate growth and downturns successfully share one habit: they stay close to their numbers every single week. Not because they are anxious, but because they are informed. Weekly engagement with your SMB financial planning process means you catch a cash dip in week two, not week eight when options are limited.

The other missing piece is honest scenario testing. Most owners build one forecast and hope it holds. The CFO mindset builds three forecasts and plans for the worst one. That is not pessimism. That is preparation.

“The businesses that survive shocks are not the ones with the most cash. They are the ones who saw the problem coming and had a plan ready.”

Strategic finance is not a once-a-year exercise. It is a weekly discipline. The tools are simple. The commitment to use them consistently is what most owners underestimate.

Take your financial strategy to the next level

If these practices feel like a lot to implement on your own, you are not alone. Most SMB owners are running their business while also trying to be their own CFO, and that split focus is exactly where financial blind spots grow.

https://johngalt-finance.com

John Galt Finance provides outsourced CFO expertise built specifically for businesses like yours. Start with our business financial planning guide to build the foundation, use our cash flow forecasting help to set up your 13-week model, or get a financial health check to see exactly where your business stands today. Real CFO-level insight, without the full-time cost.

Frequently asked questions

What is the difference between revenue and cash flow in small business finance?

Revenue is the income earned from sales, while cash flow is the actual movement of money in and out. A business can show strong revenue yet face cash shortages when clients pay late or expenses hit before collections arrive.

Why is tracking input costs important for strategic finance?

Untracked input costs create blind spots that quietly erode margins. Small unmonitored expenses like vendor price creep and auto-renewing subscriptions compound over time into significant financial problems.

How does a 13-week forecast help small businesses avoid bankruptcy?

It gives you early visibility into cash shortfalls so you can act weeks before a crisis hits. Early forecasting and financing improve SMB survival odds by 60-70% compared to reactive approaches.

What are the signs of poor credit management in an SMB?

Frequent overdrafts, last-minute borrowing to cover payroll, and rejected credit applications all signal weak credit strategy. Unreliable credit access is one of the most common triggers for SMBs running into serious financial trouble.

FAQ

What does strategic finance actually mean for an SMB?

Strategic finance is the practice of using financial data to make forward-looking business decisions, not just reporting on the past. For SMBs it means: tying every dollar of spend to a return, knowing your unit economics by segment, modeling scenarios before committing to hires or capex, and using cash position to dictate growth pace.

How is strategic finance different from accounting?

Accounting answers “what happened?” Strategic finance answers “what should we do next?” Accounting is precision and compliance (down to the cent, GAAP-compliant). Strategic finance is direction and trade-offs (precision optional, decision-grade always). Both are needed – confusing them is why many SMBs over-invest in accountants and under-invest in CFO-level thinking.

What’s the minimum strategic finance stack for a $1M-$10M business?

(1) Clean monthly P&L and balance sheet, closed by BD 10. (2) Rolling 13-week cash flow forecast. (3) Driver-based annual budget refreshed quarterly. (4) Weekly KPI dashboard (revenue, margin, runway, top 5 operating metrics). (5) Pricing model that ties to unit economics. Everything else can wait until you’re above $10M.

How do I know if my finance function is broken?

Five red flags: (1) you don’t know cash runway to the week, (2) monthly close finishes after BD 15, (3) budget variances aren’t explained, (4) pricing hasn’t been reviewed in 18+ months, (5) major decisions (hire, raise, capex) happen without a model. Any two of these = real risk. All five = you’re flying blind.

Can software replace a fractional CFO?

No, but it makes one cheaper to staff. Tools like Cube, Mosaic, Causal, or Pigment automate the data plumbing – close, consolidation, dashboards. They don’t make decisions or pressure-test assumptions. The CFO interprets what the dashboard says and translates it into action. Software is a force multiplier for finance talent, not a substitute.

Share this:

Essential types of financial models every business owner needs

Financial Model Types at a Glance

Model TypePrimary UseBuild TimeWhen You Need It
3-Statement ModelOperating baseline, banking20-40 hoursAny business above $500K revenue
13-Week Cash FlowLiquidity, runway10-20 hoursTight cash or turnaround
Driver-Based ForecastBudget, scenario planning30-60 hoursAnnual planning, board reporting
DCF ValuationM&A, fundraising20-40 hoursSelling, raising, buying
Unit Economics ModelPricing, GTM efficiency15-30 hoursSaaS, e-commerce, services
LBO ModelPE evaluation40-80 hoursPE buyer or sponsor exit
Cap Table ModelDilution, exit waterfall5-15 hoursAny company with equity rounds

Choosing the wrong financial model is one of the most expensive mistakes a growing business can make. You might be generating solid revenue, yet still run into cash shortfalls, miss funding opportunities, or make hiring decisions based on incomplete data. The right financial model gives you a clear, structured view of your numbers so you can act with confidence instead of guessing. This article walks through the major types of financial models, explains when each one applies, and helps you match the right tool to your specific business situation, whether you’re managing cash flow, planning for growth, or preparing for investment.

Table of Contents

Key Takeaways

PointDetails
Match model to needChoose your financial model based on specific goals like cash flow, growth, or scenario planning.
Three-statement is foundationalEvery business should start with a three-statement model to ensure strategic decisions translate to cash.
Blend models for accuracyCombining driver-based, scenario, and forecasting models provides a more complete view of your business.
Update and validateRegularly update models with new data and check for errors to keep forecasts relevant and reliable.

How to choose the right financial model: Key criteria for SMBs

Before you build anything, you need to know what you’re solving for. Business owners often jump straight into spreadsheets without defining the core question their model should answer. That’s where things go sideways.

Start by identifying your primary goal. Are you trying to manage cash flow month to month? Evaluate a potential acquisition? Prepare for a funding round? Or simply understand which products are actually profitable? Each goal points to a different model type. Mixing them up wastes time and produces misleading outputs.

Next, consider these selection criteria:

  • Data availability: How much historical data do you have? Models that rely on regression or time series analysis need at least 12 to 24 months of clean data to be reliable.
  • Business complexity: A single-product service business needs a simpler model than a multi-location retailer with seasonal demand.
  • Industry norms: Some industries have standard model structures. SaaS businesses, for example, track MRR, churn, and CAC. Manufacturers focus on unit economics and inventory turns.
  • Decision timeline: Short-term cash planning calls for rolling 13-week cash flow models. Long-term strategy needs a 3 to 5-year integrated model.

For most SMBs, the best starting point is a combination of foundational and driver-based models. CFO-level analysis for SMBs prioritizes three-statement and driver-based models to connect growth strategies like hiring or expansion directly to profitability. From there, you can layer in scenario and sensitivity analysis as your needs grow.

Good financial planning for business always starts with the question, not the tool. Define what you need to know, then choose the model that answers it.

Pro Tip: Benchmark your model assumptions against industry metrics before finalizing them. If your projected gross margin is 20 points above the industry average, that’s a red flag worth investigating before you present to investors or lenders.

Three-statement models: The backbone of business financials

If there’s one model every business owner should understand, it’s the three-statement model. Everything else builds on it.

Accountant working on three-statement financial model

The three-statement model connects your income statement, balance sheet, and cash flow statement into a single, integrated view of your business. That connection matters more than most people realize. A business can show accounting profit while burning through cash. Without all three statements linked, you won’t see that problem coming.

Here’s what each statement contributes:

  • Income statement: Shows revenue, costs, and profit over a period. It tells you whether the business is operationally viable.
  • Balance sheet: Shows what the business owns and owes at a point in time. It captures the long-term financial position.
  • Cash flow statement: Tracks actual cash in and out. It’s the difference between profit on paper and money in the bank.

The real power comes from integration. When you increase sales in the income statement, the model automatically updates accounts receivable on the balance sheet and adjusts operating cash flow. That’s how you catch the common trap of fast growth destroying cash.

Three-statement models are foundational for SMB financial planning and are the starting point for nearly every advanced analysis. Think of the three-statement model as the difference between a financial model vs business plan: one is a narrative, the other is a living, testable system.

For owners focused on SME profitability steps, this model also helps identify margin leaks and working capital inefficiencies that would otherwise stay hidden. You can also use it as a financial health check to assess your current position before making major moves.

Pro Tip: Always reconcile ending cash on your cash flow statement to the cash balance on your balance sheet. If they don’t match, there’s an error somewhere in the model. Catching this early saves hours of troubleshooting.

Forecasting models: Predicting business performance

Once your three-statement foundation is in place, the next step is projecting forward. Forecasting models help you estimate future revenue, costs, and cash flow based on patterns, assumptions, and business logic.

There are two broad categories: quantitative and qualitative. Quantitative models rely on historical data, using methods like straight-line projection, percent-of-sales, or bottom-up unit economics. Qualitative models rely on expert judgment or market research, which makes them more useful for early-stage businesses without much data.

Here’s a comparison of the most common forecasting approaches:

Model typeBest use caseKey advantageMain limitation
Straight-lineStable, predictable revenueSimple and fastMisses trend changes
Moving averageSmoothing short-term fluctuationsReduces noiseLags behind sudden shifts
RegressionIdentifying relationships between variablesData-driven and testableNeeds sufficient data
Time series (ARIMA)Seasonal or cyclical businessesHandles complex patternsTechnically demanding
Bottom-upNew products or marketsGrounded in unit economicsTime-intensive to build

For most SMBs, a bottom-up approach (units times price, times conversion rate) is the most defensible method for revenue forecasting. It forces you to think through the real drivers of your business rather than just extrapolating a trend line.

Here’s a quick example of how the choice matters:

  1. A straight-line model projects 10% annual growth based on last year’s revenue.
  2. A regression model identifies that your revenue correlates strongly with local construction permits issued.
  3. When permits drop 30% in Q1, the regression model signals a revenue slowdown months before it shows up in your bank account.

Seasonality is one of the most overlooked pitfalls. Many businesses apply flat monthly assumptions, then get blindsided by Q4 cash crunches or Q1 slowdowns. A solid cash flow forecasting guide will always account for seasonal patterns in both revenue and expenses.

Budgeting, scenario, and sensitivity models: Planning for uncertainty

Forecasting tells you what’s likely. Budgeting, scenario analysis, and sensitivity modeling tell you what to do when things don’t go as planned.

These three tools are often lumped together, but they serve distinct purposes:

  • Budgeting models translate your strategy into a financial plan. They set spending limits, revenue targets, and resource allocation for a defined period.
  • Scenario models test how your business performs under different conditions: a best case, a base case, and a worst case. They answer the question, “What happens if sales drop 20%?”
  • Sensitivity models isolate one variable at a time to measure its impact. They answer, “How much does a 1% change in gross margin affect net profit?”
Model typePrimary functionWhen to use it
BudgetingAllocate resources and set targetsAnnual planning, monthly tracking
Scenario analysisTest outcomes under different conditionsStrategic decisions, fundraising
Sensitivity analysisMeasure impact of single variable changesPricing decisions, cost negotiations

“Ignoring volatility in your financial model isn’t conservative. It’s reckless. Every business faces uncertainty, and the models that don’t account for it give leaders false confidence at exactly the wrong moment.”

Scenario analysis covering base, best, and worst cases combined with error checks and modular design represents current best practice for SMB financial modeling. Pair that with budgeting best practices to build a planning process that’s both rigorous and practical.

To build a solid scenario or sensitivity analysis, follow these steps:

  • Identify your top 3 to 5 business drivers (revenue growth rate, gross margin, customer churn, payroll costs).
  • Define realistic ranges for each driver based on historical data and market research.
  • Build separate scenario tabs or toggle switches in your model.
  • Test each scenario and document the financial impact clearly.
  • Review scenarios at least quarterly and update assumptions with actual results.

Driver-based and advanced models: Linking strategy to results

Driver-based models are where financial modeling becomes genuinely strategic. Instead of starting with revenue as a single input, you break it down into the specific activities that generate it.

Common business drivers include:

  • Price and volume: Average selling price times units sold.
  • Customer metrics: Customer acquisition cost (CAC), average revenue per user (ARPU), and churn rate.
  • Operational metrics: Utilization rates, headcount productivity, and inventory turns.
  • Marketing inputs: Lead volume, conversion rates, and sales cycle length.

The value of this approach is control. When you model revenue as a function of leads times conversion rate times average deal size, you can immediately see which lever to pull to hit your target. That’s a fundamentally different conversation than just saying “we need to grow 15%.”

Driver-based models link operations to finance, while advanced machine learning models like gradient boosted machines allow more complex prediction, though they require careful attention to explainability and data quality. For most SMBs, machine learning is overkill. Focus on getting your driver-based model right first.

The custom financial modeling process at John Galt Finance is built around driver-based logic, connecting your specific operational activities to financial outcomes. For SaaS businesses, tracking SaaS financial KPIs within a driver-based model is especially powerful. And regardless of industry, anchoring your model to key financial KPIs keeps the analysis grounded in what actually matters.

Pro Tip: Use a blend of models rather than betting everything on one approach. A driver-based model for revenue, a three-statement model for integration, and a scenario model for risk testing gives you a complete picture without unnecessary complexity.

The uncomfortable truth: Why CFO-level models matter more than ever

Here’s something most financial modeling guides won’t say directly: most small business owners overestimate how good their models actually are.

A spreadsheet with last year’s revenue plus 10% is not a financial model. It’s a wish. And building strategy on a wish is how businesses get caught off guard by cash shortfalls, margin compression, or growth that actually destroys value.

The uncomfortable reality is that simple models feel safe because they’re easy to understand. But that simplicity often hides the risks that matter most, like cyclicality, scale effects, or the cash impact of rapid hiring. Bottom-up revenue modeling is more defensible than top-down approaches, and avoiding optimism bias in assumptions is critical to model integrity.

Scenario planning is not a nice-to-have. It’s a leadership discipline. The businesses that navigate downturns and capitalize on growth windows are the ones that ran the scenarios before the situation forced their hand. They weren’t smarter. They were more prepared.

The best models are updated constantly with actual results, challenged regularly, and built with humility about what you don’t know. If your custom modeling for business growth process doesn’t include regular variance analysis and assumption reviews, it’s already becoming unreliable.

Treat your financial model as a living tool, not a document you file away after budget season.

Take your business further with expert financial modeling

Building the right financial model takes more than a good spreadsheet template. It takes CFO-level thinking about your specific business, industry, and goals.

https://johngalt-finance.com

At John Galt Finance, we build custom financial models tailored to your business drivers, growth stage, and decision-making needs. Whether you need a solid three-statement foundation, a scenario model for your next funding round, or a driver-based model to connect your operations to your numbers, we can help. Explore our financial planning guide to see how strategic planning translates into real results, or start with our cash flow forecasting resources to strengthen your near-term visibility. Your next strategic move deserves a model built to support it.

Frequently asked questions

What is the difference between quantitative and qualitative financial models?

Quantitative models rely on historical data and are more accurate when sufficient data exists. Qualitative models use expert judgment or market research, making them better suited for startups or new markets with limited historical information.

When should a small business use a three-statement financial model?

Use a three-statement model whenever you’re making a major strategic decision, seeking outside funding, or need a clear view of actual cash flows rather than just reported profit. Three-statement models are foundational for any serious financial planning process.

How often should I update my financial models?

Update your models at least quarterly, comparing actual results against your forecasts and adjusting assumptions based on new information. Best practice is quarterly updates with actuals versus forecast reviews to keep your model accurate and decision-ready.

What are driver-based models and why are they useful?

Driver-based models build financial projections from specific operational variables like price, volume, churn, and customer acquisition cost. Driver-based models link operations directly to financial results, making them powerful tools for testing strategies and setting priorities.

FAQ

Which financial model should I build first?

Always start with a 3-statement model (P&L, balance sheet, cash flow) tied together with formulas. Everything else – DCF, scenarios, unit economics – layers on top. If you skip the 3-statement foundation, every downstream model will have hidden inconsistencies.

Excel, Google Sheets, or a dedicated tool?

For models under $50M revenue, Excel or Google Sheets is fine and usually better – more flexible, no vendor lock-in, every finance person can read it. Move to a dedicated tool (Cube, Mosaic, Pigment, Causal) when you have 3+ entities, multi-currency, or 5+ stakeholders editing simultaneously.

How often should I update my financial model?

Operating model: monthly, alongside the close. 13-week cash flow: weekly rolling. Annual budget: refreshed quarterly with re-forecast. Fundraising/DCF model: only when raising or doing M&A. A model that’s not updated within 30 days of the last close is functionally dead – investors and banks can tell.

What’s the most common mistake in DIY financial models?

Hard-coding numbers instead of using drivers. If you change revenue growth from 20% to 30%, the model should automatically flow through every line. If you have to manually update 15 cells, the model is broken. Second most common mistake: balance sheet doesn’t balance – usually a sign of mixed sign conventions or missing flow accounts.

Do I need a financial model to raise capital?

Yes – for any institutional round (Series A and later). Banks usually require a 3-year forecast for credit lines above $500K. Angels and seed investors care less about model precision and more about logic and unit economics. The model is less about predicting the future and more about proving you understand the levers of your business.

Share this:

Cost Reduction Strategies That Don’t Kill Growth

When revenue stalls or margins shrink, the instinct is to cut costs — fast and deep. But reckless cost reduction strategies can gut the capabilities that drive future growth, turning a short-term fix into a long-term handicap. The most effective approach is surgical: eliminate waste, protect growth drivers, and create a leaner, more resilient business. This guide shows you exactly how to do it.

Table of Contents

Key Takeaways

InsightAction
Not all costs are equalClassify costs as growth-enabling vs. waste before cutting
Headcount cuts are high-riskExhaust non-headcount options first
Vendors have marginRenegotiate contracts annually — most companies don’t
Process waste is often invisibleMap workflows to find hidden inefficiencies
Cost reduction compoundsA 10% cost reduction at 20% margins doubles your profit

Why Most Cost Cuts Fail

A 2024 McKinsey study found that 60% of companies that implemented broad cost-cutting programs saw their performance deteriorate within 18 months. The reason is almost always the same: they cut costs indiscriminately rather than strategically.

Common mistakes include:

  • Across-the-board percentage cuts — penalizing high-performing teams equally with underperforming ones
  • Cutting customer-facing capabilities — reducing sales, support, or marketing while revenue is already under pressure
  • Ignoring the revenue impact — some costs directly generate revenue; cutting them destroys more than they save
  • One-time mindset — treating cost reduction as a crisis response rather than an ongoing discipline

Effective cost reduction strategies start with clarity: what costs are you willing to cut, and what are the consequences?

Step 1: Audit Before You Cut

Before touching a single line item, conduct a complete cost audit. Pull your profit and loss statement for the last 12 months and categorize every expense by:

Fixed vs. Variable Costs

Fixed costs (rent, salaries, software subscriptions) remain constant regardless of revenue. Variable costs (COGS, commissions, shipping) scale with activity. In a downturn, variable costs should adjust automatically — if they don’t, that’s a structural problem to fix.

Use your break-even analysis to understand exactly how much fixed cost your current revenue can support. If your fixed cost base requires 80% of current revenue just to break even, you have a structural problem — not a temporary one.

Direct vs. Indirect Costs

Direct costs (labor, materials) are tied to specific products or services. Indirect costs (office, admin, IT) support the business overall. Indirect costs are typically the first place to look for savings without touching revenue-generating activities.

Essential vs. Non-Essential

For each expense ask: “If we eliminated this tomorrow, would it directly hurt revenue or customer delivery within 90 days?” If the answer is no, it’s a candidate for reduction or elimination.

The Four Categories of Business Costs

CategoryExamplesCut Priority
WasteUnused software, duplicate tools, unnecessary meetingsCut immediately
InefficiencyManual processes that could be automated, overstaffed functionsOptimize first
Growth-enablingSales, marketing, product developmentProtect — cut only as last resort
StrategicR&D, key hires, market expansionEvaluate against future return

The goal of sustainable cost reduction strategies is to eliminate waste and inefficiency while leaving growth-enabling costs intact.

7 Proven Cost Reduction Strategies

1. Conduct a Software and Subscription Audit

The average SMB pays for 40% more software licenses than it actively uses. Do a full audit of every SaaS subscription, including who uses it, how often, and whether it overlaps with another tool. Typical savings: 15-25% of your software spend within 30 days.

Steps to execute:

  1. Pull all active subscriptions from your credit card statements and accounts payable
  2. Survey department heads on actual usage
  3. Cancel or downgrade unused plans immediately
  4. Consolidate overlapping tools (e.g., one project management tool, not three)

2. Renegotiate Vendor Contracts

Most vendors have built-in margin — and most business owners never ask for better terms. Renegotiate your top 10 vendor contracts annually. Tactics that work:

  • Commit to longer terms in exchange for lower rates
  • Pay annually instead of monthly for 10-20% discounts
  • Bundle services with fewer vendors for volume pricing
  • Use competitive quotes as leverage — even if you don’t intend to switch

Real example: A $4M logistics company renegotiated its freight contracts by consolidating three carriers into one. Annual savings: $87,000 — with zero service degradation.

3. Automate Manual Processes

Manual data entry, invoice processing, reporting, and reconciliation are expensive in labor hours. Modern automation tools can handle these at a fraction of the cost. Focus on processes that are:

  • High-frequency (daily or weekly)
  • Rule-based (not requiring judgment)
  • Currently handled by expensive employees

Proper financial planning should include an annual automation audit to identify at least three processes to automate each year.

4. Optimize Your Workforce Structure

Headcount cuts should be a last resort — they damage morale, increase turnover risk among survivors, and often cost more in rehiring than was saved. Before reducing headcount, consider:

  • Freeze new hiring — let natural attrition reduce headcount
  • Shift full-time roles to fractional or contract for non-core functions
  • Cross-train employees so you can consolidate roles over time
  • Reduce overtime by improving scheduling and capacity planning

Functions like finance, HR, legal, and marketing are often candidates for fractional or outsourced models — delivering senior expertise at 30-50% of full-time cost.

5. Improve Inventory and Working Capital Management

Excess inventory ties up cash and creates storage costs. Slow-paying customers drain your working capital. Both have direct cost implications. Review your working capital management to:

  • Reduce days inventory outstanding (DIO) by improving demand forecasting
  • Accelerate collections by shortening payment terms or offering early-pay discounts
  • Extend payables strategically without damaging vendor relationships

Freeing up working capital reduces the need for credit lines — which have their own cost in interest and fees.

6. Review Your Real Estate Footprint

Office space is often the second-largest fixed cost after payroll. With hybrid work now standard, many businesses are over-officed. Options include:

  • Sublease unused space
  • Downsize at lease renewal
  • Shift to co-working or flex office arrangements for smaller teams
  • Negotiate rent abatements with landlords who prefer existing tenants over vacancies

7. Eliminate Low-Margin Products or Clients

Not all revenue is equally profitable. Some clients consume disproportionate resources, demand excessive customization, or require expensive support. Some products or services have thin margins that don’t justify the operational complexity. A true profitability analysis by segment often reveals that 20% of clients or SKUs generate 80% of the profit — while the bottom 20% may actually lose money.

Pruning low-margin clients and products is one of the most powerful cost reduction strategies available — it simultaneously reduces cost and improves average margins.

What NOT to Cut: Protecting Growth Drivers

The gravest mistake in cost reduction is cutting capabilities that generate future revenue. Before making any cut, ask: “Is this cost generating revenue, retaining customers, or building competitive advantage?”

Do not cut:

  • Sales team and pipeline-building activities — cutting sales to save money is like stopping to eat to lose weight
  • Customer success and support — retention is cheaper than acquisition; churn destroys growth
  • Core product development — falling behind competitors is a slow-motion crisis
  • Financial reporting and forecasting — you need visibility to manage through pressure; cutting finance is flying blind
  • Key talent — losing high performers to competitors is a double loss

Strong cash flow forecasting gives you the visibility to make these decisions with data rather than gut feel — identifying exactly how long your current runway is and what levers will have the most impact.

How to Implement a Cost Reduction Plan

Phase 1: Quick Wins (Days 1-30)

Focus on zero-disruption cuts that require no structural change: cancel unused subscriptions, pause discretionary spending (travel, events, non-essential contractors), and initiate vendor renegotiations.

Phase 2: Structural Optimization (Days 30-90)

Address process inefficiencies, consolidate vendors, begin automation projects, and conduct the full cost audit. Make decisions about real estate and workforce structure.

Phase 3: Strategic Repositioning (90+ Days)

Prune unprofitable products and clients, rebalance the business model, and institutionalize cost discipline through monthly financial reviews and KPI tracking.

Measure the Right Metrics

Track these during and after implementation:

  • Operating cost as % of revenue (target: declining trend)
  • Gross margin (should improve)
  • EBITDA margin (the true measure of profitability)
  • Revenue per employee (productivity signal)
  • Customer churn rate (ensures cuts haven’t damaged retention)

Cost Reduction Checklist

ActionTimelineExpected Impact
Audit all software subscriptionsWeek 115-25% of software spend
Cancel unused tools and licensesWeek 1Immediate cash savings
Freeze non-essential hiringWeek 1Reduce future fixed cost growth
List top 10 vendors by spendWeek 2Identify renegotiation targets
Request vendor quotes / renewalsWeek 2-45-20% vendor cost reduction
Map top 5 manual processesWeek 2-3Identify automation ROI
Run profitability by client/productWeek 3Identify candidates for pruning
Review office lease termsWeek 4Sublease or downsize opportunity
Initiate automation projectsMonth 2Ongoing labor hour reduction
Prune bottom 20% clients/SKUsMonth 2-3Margin improvement
Establish monthly cost review cadenceMonth 3Permanent cost discipline

Ready to build a cost reduction plan tailored to your business? Book a free consultation with our fractional CFO team and we’ll identify your biggest savings opportunities within the first session.

FAQ

What is the most effective cost reduction strategy for small businesses?

For most SMBs, the fastest ROI comes from three areas: auditing and canceling unused software subscriptions, renegotiating vendor contracts, and eliminating low-margin clients. These require no headcount changes and can deliver measurable savings within 30 days.

How do I reduce costs without laying off employees?

Before considering layoffs, exhaust non-headcount options: freeze new hiring, eliminate overtime, automate manual tasks, consolidate vendor spend, and cut discretionary expenses. Shifting some full-time roles to fractional or contract arrangements is often more cost-effective than layoffs when accounting for severance, rehiring, and morale costs.

How much should a business aim to cut in a cost reduction initiative?

A realistic target is 10-20% of non-headcount operating costs in the first 90 days. This typically translates to 2-5 percentage points of margin improvement. Deeper cuts are possible but require structural changes (real estate, headcount, product line) that take longer to execute.

What costs should never be cut during a business downturn?

Avoid cutting sales, marketing (demand generation), customer success, and core product development — these directly protect and generate revenue. Also protect financial reporting and forecasting capabilities; reduced visibility during a downturn is dangerous. Key talent retention should be treated as a strategic investment, not a discretionary cost.

How do I know if my cost reduction strategies are working?

Track operating cost as a percentage of revenue (it should decline), gross and EBITDA margins (both should improve), and customer churn rate (it should remain stable). If churn increases after cuts, you’ve likely cut into customer-facing capabilities and need to reverse course. Monthly financial reviews are essential to catching unintended consequences early.

Share this:

Due Diligence Checklist: How to Prepare Your Business for Investors

When an investor says “send us your due diligence package,” most business owners freeze. They scramble through folders, realize half their documents don’t exist, and lose the deal before it starts. A solid due diligence checklist isn’t just a formality — it’s the difference between closing a round and watching it slip away. If you’re preparing to raise capital, sell your business, or bring in a strategic partner, this guide will walk you through exactly what you need to have ready.

What Is Due Diligence and Why It Matters

Due diligence is the formal process by which investors, acquirers, or partners verify the claims a business makes about itself. Think of it as a structured audit — financial, legal, operational, and commercial — that happens before any transaction closes.

For investors, due diligence is risk management. For you as the business owner, it’s an opportunity to demonstrate credibility and command a stronger valuation. Businesses that walk into this process unprepared typically face one of three outcomes: the deal falls through, the valuation gets cut, or the timeline drags out so long that the investor loses interest.

The good news: most of what investors want to see is information you should already be tracking. The problem is that most SMB owners aren’t tracking it in investor-ready format.

Key Takeaways

AreaWhat Investors Look ForCommon Gap
Financials3 years of audited or reviewed statementsCash-basis books, no management accounts
LegalClean cap table, no pending disputesInformal agreements, missing contracts
OperationsDocumented processes, key-person independenceFounder does everything, nothing written down
CommercialRecurring revenue, customer concentration <20%One customer = 60% of revenue
TeamOrg chart, employment agreements, equity grantsVerbal agreements, undocumented equity

Financial Documents Investors Require

The financial section is the most scrutinized part of any due diligence checklist. Investors will stress-test your numbers, model downside scenarios, and look for inconsistencies between what you’ve told them verbally and what the books actually show.

Historical Financial Statements

You’ll need at minimum three years of financial statements: income statement (P&L), balance sheet, and cash flow statement. Ideally, these are reviewed or audited by an independent CPA. If you’ve been running on cash-basis bookkeeping, you’ll need to convert to accrual-basis before presenting to institutional investors.

If your financials aren’t audit-ready, consider having a fractional CFO clean them up. The cost of this prep work is a fraction of what a valuation haircut would cost you. Learn more about how a fractional CFO can prepare your financials for investors.

Management Accounts and KPIs

Beyond statutory accounts, sophisticated investors want monthly management reports. These include: gross margin by product line, customer acquisition cost (CAC), lifetime value (LTV), churn rate (for subscription businesses), and revenue by channel. Tracking these before a raise — not after — demonstrates operational maturity.

If you’re not sure which metrics matter most, start with the 10 financial KPIs every business owner should track as a foundation.

Financial Projections

Investors expect a 3-year financial model with clearly documented assumptions. The model should include three scenarios (base, upside, downside) and show how the investment amount maps to specific milestones. Assumptions should be defensible — tied to actual historical conversion rates, contract values, and market data — not wishful thinking.

Your projections should also include a detailed cash flow forecast showing runway, burn rate (if pre-profitable), and break-even timeline.

Tax Returns and Compliance

Provide the last 3 years of corporate tax returns. Investors will cross-reference these with your financial statements to verify consistency. Any significant differences between book income and taxable income should be explained with supporting documentation.

The legal section of a due diligence checklist often reveals surprises that derail deals — not because businesses are doing anything wrong, but because informal arrangements that “worked fine” for years suddenly become liabilities under investor scrutiny.

Corporate Structure and Ownership

You need a clean, up-to-date capitalization table (cap table) showing every shareholder, the number of shares they hold, the price paid, and the date acquired. Include any outstanding options, warrants, convertible notes, or SAFEs. Investors will also want to see your articles of incorporation, shareholder agreements, and any board resolutions authorizing previous equity issuances.

Contracts and Agreements

Compile all material contracts: customer agreements (especially those with minimum commitments or termination clauses), supplier contracts, lease agreements, partnership agreements, and any exclusivity arrangements. Investors pay particular attention to change-of-control clauses — provisions that allow the other party to exit the contract if ownership changes hands.

Intellectual Property

Document all IP: patents (granted and pending), trademarks, copyrights, trade secrets, and software. Confirm that the company — not individual employees or contractors — owns all IP. This is a common problem for tech companies: if a contractor built your core software without a proper IP assignment agreement, you don’t own what you think you own.

Litigation and Disputes

Disclose all current, pending, or threatened legal actions. Investors will find these in public records anyway, so transparency here builds trust. Also include any regulatory actions, government investigations, or compliance issues.

Operations and Team Documentation

Investors aren’t just buying past performance — they’re betting on future execution. That means they want to understand how your business actually runs, and whether it can run without you personally involved in every decision.

Organizational Structure

Provide a current org chart with names, titles, and reporting lines. Include headcount by department, whether employees are full-time or part-time, and where key roles are located (especially relevant for remote teams or international operations).

Employment Agreements and Compensation

Every senior employee and key contractor should have a written agreement covering: compensation, role and responsibilities, non-compete and non-solicitation clauses, IP assignment, and termination terms. Investors get nervous when they discover critical team members are working on handshakes.

Standard Operating Procedures

Documented processes signal a mature, scalable business. You don’t need to have every process documented on day one, but you should have written SOPs for: customer onboarding, service delivery, financial reporting, and any other revenue-critical workflows.

Commercial and Market Position

This section answers the question: “Is this business actually winning in its market?” Investors will want to validate your commercial claims with data.

Customer Analysis

Provide a customer list showing revenue by account for the last 12-24 months. Investors will immediately check for customer concentration risk — if one customer represents more than 20% of revenue, expect hard questions. Also include customer tenure, churn data, and Net Promoter Score if you track it.

Sales Pipeline and Pipeline Velocity

Share your CRM data: total pipeline value, average deal size, average sales cycle length, and win rate. This helps investors validate your revenue projections. If you’re projecting 40% growth but your win rate has been declining for three quarters, there’s a credibility gap to address.

Competitive Landscape

Show that you understand your market. Provide a competitive analysis comparing your offering against the top 3-5 competitors on dimensions that matter to customers: price, features, service quality, and market positioning. Be honest about where competitors have advantages — investors respect self-awareness and distrust founders who claim to have no real competition.

Common Red Flags That Kill Deals

Knowing what investors are looking for also means knowing what makes them walk away. Here are the most common issues that derail deals during due diligence:

Red FlagWhy It MattersHow to Address It
Revenue recognition inconsistenciesSuggests inflated metricsRestate revenue under proper accrual accounting
Undisclosed related-party transactionsSignals potential self-dealingDocument and disclose all founder/company transactions
Missing IP assignmentsYou may not own your productGet retroactive IP assignments signed immediately
Key-person dependencyBusiness can’t operate without founderDocument processes, build second-tier management
Customer concentration >30%Loss of one customer = existential crisisDiversify revenue before raising, or explain mitigation plan
Unresolved litigationUnknown liability exposureResolve or quantify — investors price in uncertainty

Your Complete Due Diligence Checklist

Use this checklist to audit your readiness before approaching investors. Check off each item as you gather and organize the documents.

Financial Documents

  • ☐ 3 years of P&L, balance sheet, and cash flow statements (accrual basis)
  • ☐ Monthly management accounts for the last 24 months
  • ☐ 3-year financial model with three scenarios and documented assumptions
  • ☐ 12-month cash flow forecast with monthly detail
  • ☐ 3 years of corporate tax returns
  • ☐ Accounts receivable aging report
  • ☐ Revenue by customer, by channel, and by product (last 24 months)
  • ☐ Gross margin analysis by product or service line
  • ☐ Key financial KPIs tracked monthly (CAC, LTV, churn, NRR)

Legal and Corporate

  • ☐ Certificate of incorporation and articles
  • ☐ Current, up-to-date cap table
  • ☐ All shareholder agreements and board resolutions
  • ☐ Employee and contractor agreements with IP assignment clauses
  • ☐ All material customer contracts (especially MSAs and SOWs)
  • ☐ Supplier and vendor contracts
  • ☐ Lease agreements (office, equipment)
  • ☐ IP registrations: patents, trademarks, copyrights
  • ☐ Insurance policies (general liability, E&O, D&O)
  • ☐ Any pending or threatened litigation disclosure

Operations and Team

  • ☐ Current org chart with names and roles
  • ☐ Compensation structure (base, bonus, equity) by role
  • ☐ Key employee retention agreements or vesting schedules
  • ☐ Standard operating procedures for core processes
  • ☐ Technology stack documentation
  • ☐ Data security and privacy compliance documentation (GDPR, SOC2, etc.)

Commercial and Market

  • ☐ Customer list with revenue by account (last 24 months)
  • ☐ Churn analysis and cohort data
  • ☐ CRM pipeline report with pipeline velocity metrics
  • ☐ Competitive landscape analysis
  • ☐ Market size and growth data (TAM/SAM/SOM)
  • ☐ Key customer references (3-5 customers willing to speak with investors)

Don’t Go Into Due Diligence Unprepared

Preparing a due diligence package is a 60-90 day process for most businesses — longer if there are gaps to fix. Starting this work after you’ve already received investor interest is too late. The best time to build investor-ready financials is before you need them.

At John Galt Finance, we help business owners build the financial infrastructure that makes them credible to investors. From cleaning up historical financials to building defensible 3-year models, we’ve prepared dozens of businesses for successful fundraises and exits.

Book a free consultation to find out where your due diligence gaps are and how to close them before the next investor conversation.

FAQ

How long does due diligence typically take?

For SMB deals ($1M–$20M), due diligence typically takes 4–10 weeks once a term sheet is signed. The timeline depends heavily on how organized your documentation is. Businesses that have a data room prepared in advance can compress this to 2–3 weeks. Businesses scrambling to gather documents often see timelines stretch to 3–4 months — during which investors may lose confidence or interest.

What is a data room and how do I set one up?

A data room is a secure digital repository (typically a shared folder or dedicated platform like Dropbox, Google Drive, or Datasite) where you organize all due diligence documents. Structure it with clear folders: Financials, Legal/Corporate, Operations, Commercial/Sales, and Team. Use consistent naming conventions and an index document that maps to your due diligence checklist. Keep all documents current and remove outdated versions.

Do I need audited financial statements?

It depends on the deal size and investor type. Institutional investors (PE firms, venture capital) typically require audited statements for businesses with revenue above $5M. Angel investors and strategic buyers often accept reviewed statements (a lighter-touch verification) or even compiled statements with a strong CPA relationship. For fundraises below $1M, well-organized QuickBooks exports can sometimes suffice — but always present accrual-basis financials.

What if my financials aren’t in great shape?

Messy financials are common, especially in businesses that grew fast without strong back-office infrastructure. The key is to address them proactively rather than hoping investors won’t notice. Investors almost always find issues during due diligence — the question is whether you disclosed them first (which builds trust) or they discovered them (which kills trust). Work with a CFO or financial advisor to restate and clean up your books before entering any investor process.

How is due diligence different for a fundraise vs. an acquisition?

The documents required are largely the same, but the focus differs. In a fundraise, investors focus more heavily on growth metrics, market opportunity, and the financial model — they’re buying future potential. In an acquisition, buyers focus more on historical cash flows, customer retention, and operational risks — they’re buying a proven asset. For acquisitions, legal due diligence (especially around IP, contracts, and liabilities) is typically more intensive than in early-stage fundraises.

Share this: