5 - 2026 | John Galt

Top 5 johngaltinternational.org Alternatives 2026

Fractional CFO Service Benchmarks

MetricBenchmark
Fractional CFO hourly rate (US market)$200-$500/hour
Monthly retainer for SMB ($1M-$10M revenue)$3,000-$10,000/month
Full-time CFO total compensation (US median)$220,000-$450,000/year
Cost savings vs full-time CFO60-75%
Typical engagement length12-24 months
Hours per week (typical SMB engagement)5-20 hours
Revenue range where fractional CFO fits$1M-$50M
ROI achieved by SMBs using fractional CFOs3-7x within first year (CFO Selections survey)

Looking for sites like johngaltinternational.org can bring up some interesting surprises. There are new options popping up that offer fresh features and different experiences. With so many choices out there, the right alternative might change the way you approach your goals. Curious which options are making waves and drawing attention? Discover what sets each one apart and see which could be the perfect fit for your needs.

Table of Contents

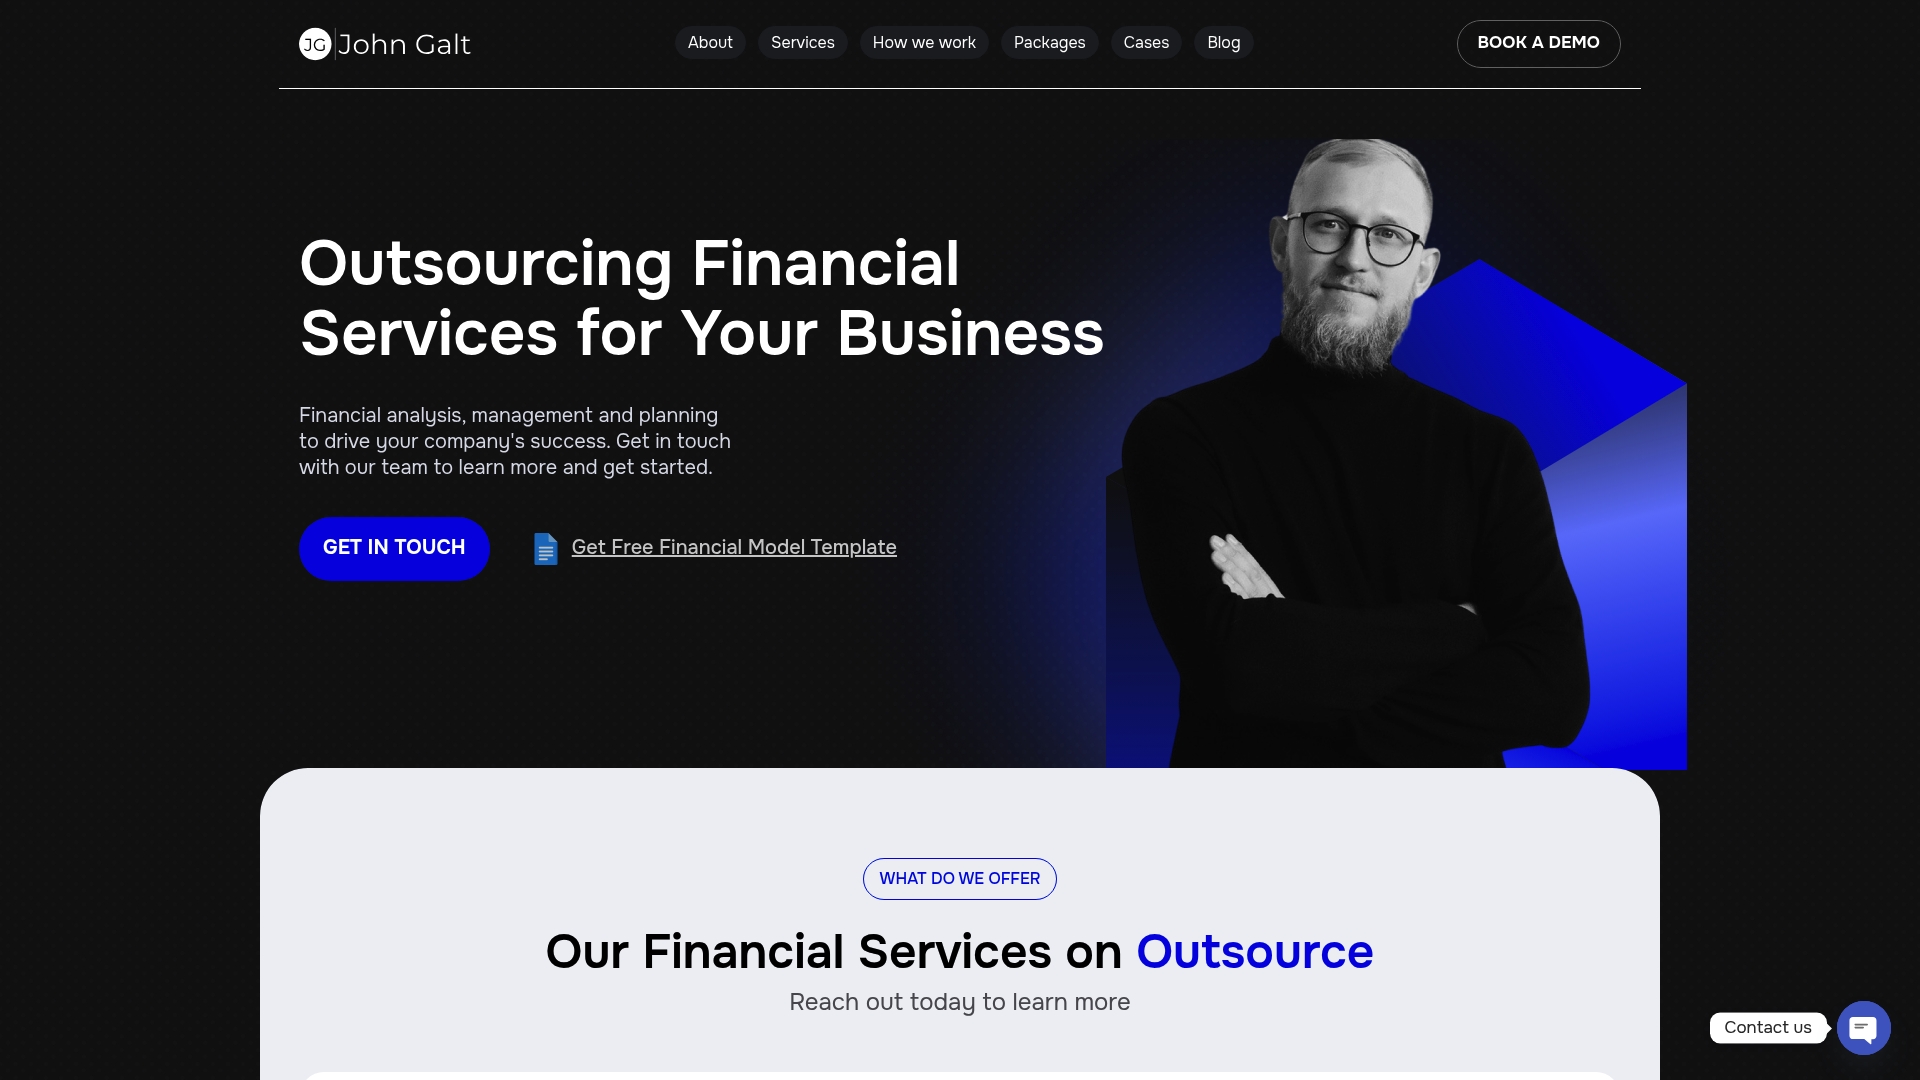
John Galt Finance
Product Screenshot

At a Glance

John Galt Finance delivers outsourced CFO level expertise that fits companies needing senior financial guidance without hiring full time staff. The offering blends day to day reporting with strategic planning to help businesses understand current position and make confident growth decisions.

Core Features

Core capabilities include outsourced financial analysis and management, comprehensive financial reporting across P&L Cash Flow and Balance Sheet, and robust financial planning and analysis with budgeting and scenario modeling. The platform also provides strategic finance services for product planning resource allocation and M&A plus customized financial dashboards and models tailored to industry needs.

Pros

  • Customized solutions tailored to client needs: John Galt Finance adapts models and reporting to your product mix and growth stage so recommendations match reality and drive action.
  • Wide range of financial services: Reporting planning strategy and diagnostics are available under one roof so you avoid stitching together multiple advisors.
  • Experienced team with over 10 years in finance: That depth makes forecasts more realistic and investor facing materials more credible when you pursue funding.
  • Global client base across various industries: Exposure to different business models sharpens comparative analysis and brings cross industry insights to your strategy.
  • Transparent pricing and tiered service packages: Clear starting points and packaged options make budgeting for advisory services easier for finance leaders.

Who It’s For

This service suits small and medium sized businesses and startups with 5 to 50 employees and revenue between $500K and $20M that need outsourced financial leadership. Choose it when you want senior level planning reporting and diagnostics without a full time CFO on payroll.

Unique Value Proposition

John Galt Finance outperforms competitors by combining deep practical expertise with customizable deliverables built around your company. The mix of hands on financial modeling detailed metrics and strategy work lets you move from descriptive reports to actionable plans. Sophisticated buyers pick this option because the team supplies investor ready models clear operating forecasts and strategic allocation advice that support fundraising and scaling. Transparent pricing and tiered service packages reduce procurement friction and make it straightforward to upgrade from a one off engagement to ongoing CFO support.

Real World Use Case

A tech startup engaged John Galt Finance to build a financial model and strategic plan for scaling and attracting investors. The firm delivered scenario based projections investor facing materials and a three phase resource allocation plan that aligned product milestones with cash flow projections.

Pricing

Pricing varies by package and services selected. One off services start from 600 EUR while broader service packages are available via custom quotes based on scope and ongoing involvement.

Website: https://johngalt-finance.com

CFO Edge
Product Screenshot

At a Glance

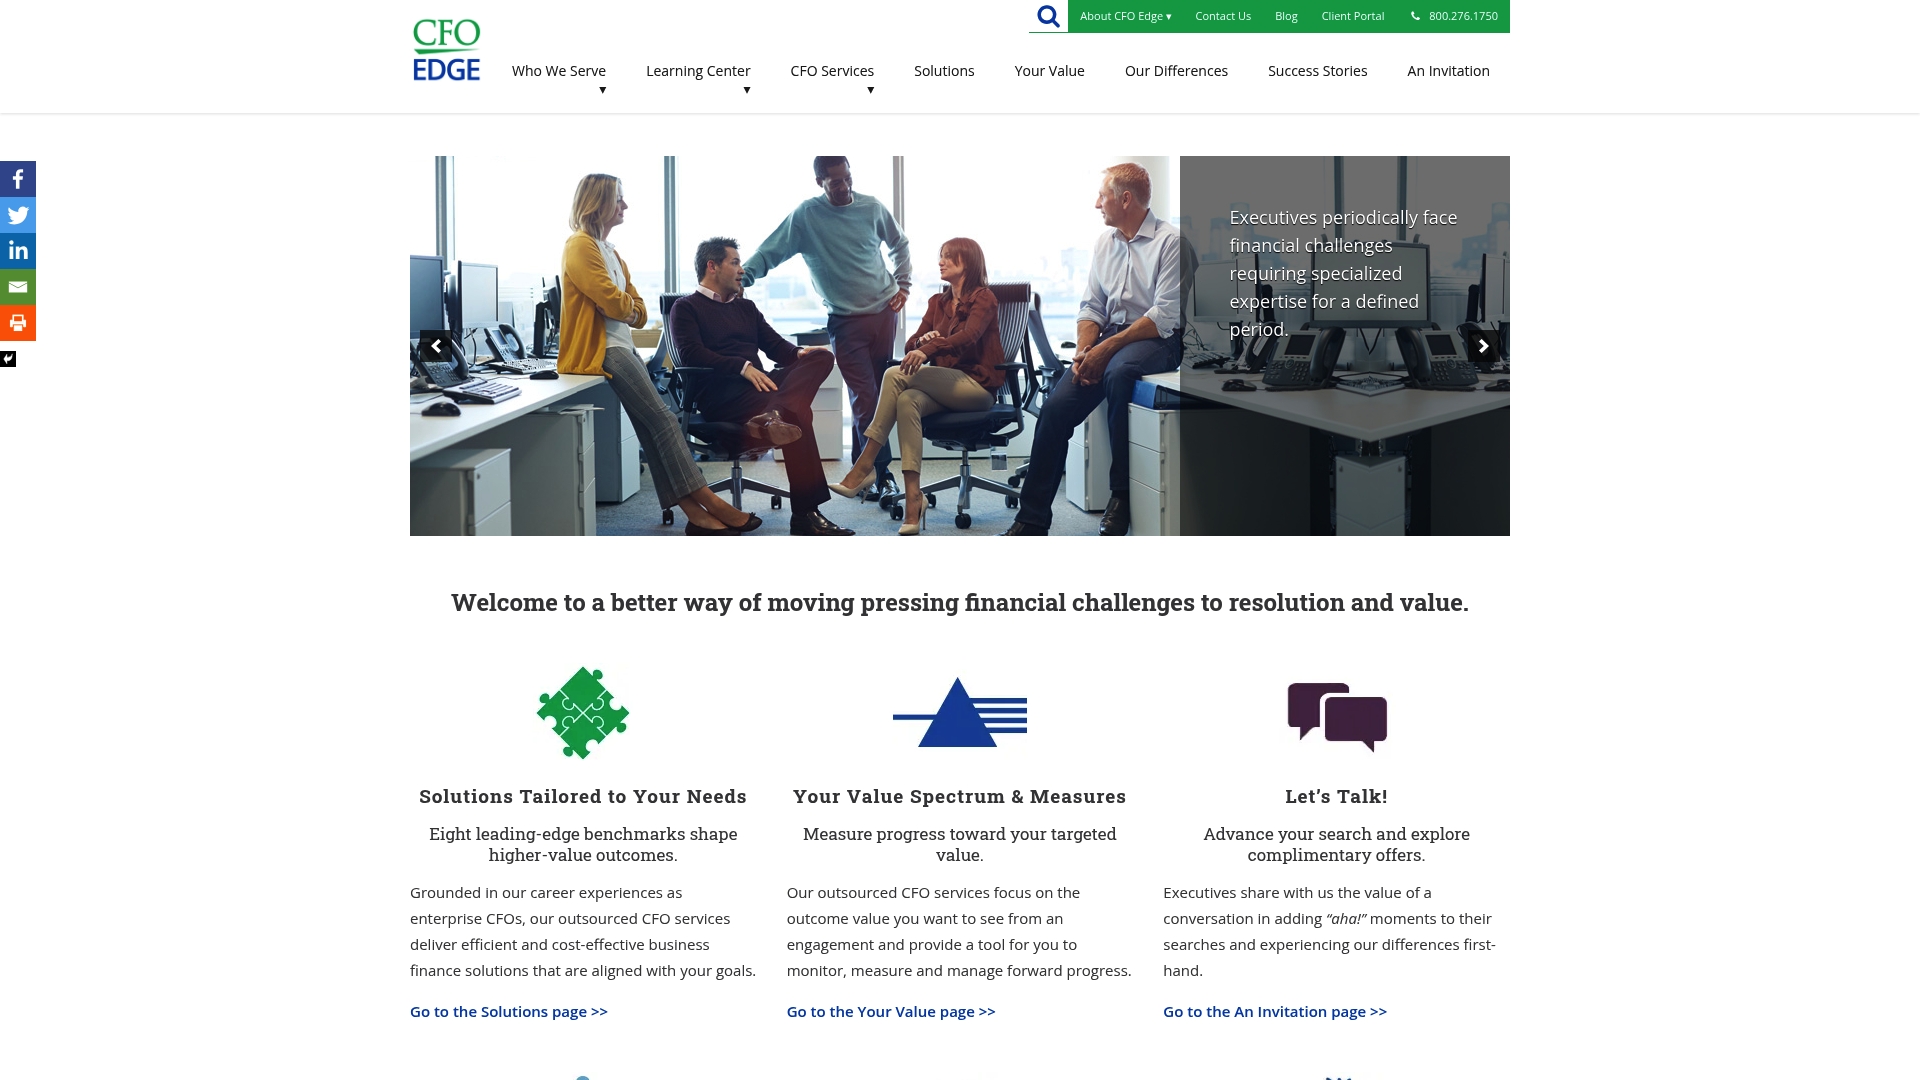
CFO Edge delivers outsourced CFO services that swap the cost of a full time executive for focused, flexible leadership. The firm targets organizations that need senior financial direction without hiring a permanent CFO.

This offering is strong where clear metrics and project driven outcomes matter, especially for companies preparing for fundraising or scaling operations.

Core Features

CFO Edge provides a suite of services built around flexible CFO roles and measurable results. Key capabilities include project CFO, part time CFO, and interim CFO engagements tailored to client goals.

  • Flexible roles to match short term projects or ongoing part time support.
  • Tailored financial solutions grounded in leading edge benchmarks and measurable outcomes.
  • Resources library with articles, white papers, and success stories for executive teams.
  • A dedicated client portal backed by a team of experienced financial professionals.

Worth considering.

Pros

  • Customized CFO solutions adapt to different organizational needs and avoid the expense of a full time hire.
  • The resource library provides actionable articles and white papers that help leadership level up quickly.
  • Services focus on measurable outcomes, giving you tools to track progress and link projects to value realization.
  • The team includes experienced CFO professionals who bring cross industry perspectives to complex problems.
  • Flexible engagement options make high level expertise more cost effective for short term and episodic needs.

Cons

  • Pricing details are not published, so you must contact CFO Edge to obtain a quote and scope information.
  • The service scope centers on CFO level work, which means smaller bookkeeping or routine accounting needs are outside its primary offering.
  • Very small businesses with tight budgets or minimal financial complexity may find the engagement level more than they need.

Who It’s For

CFO Edge fits startups, growing companies, and mid sized enterprises that require experienced CFO leadership on a temporary, part time, or project basis. Companies preparing for investment rounds or rapid scaling will benefit most.

Unique Value Proposition

CFO Edge combines senior level financial strategy with tools that measure progress toward specific outcomes. That blend helps leadership move from problem identification to concrete financial improvement with fewer meetings and clearer deliverables.

Real World Use Case

A rapidly growing startup hired CFO Edge to build a scalable financial model and install financial controls ahead of a funding round. The engagement produced investor ready forecasts and operational dashboards used in board discussions.

Pricing

Pricing details are not specified on the website; interested clients should contact CFO Edge for a custom quote and engagement options. Pricing appears to be scoped to project size and duration.

Website: https://www.cfoedge.com

PBMares
Product Screenshot

At a Glance

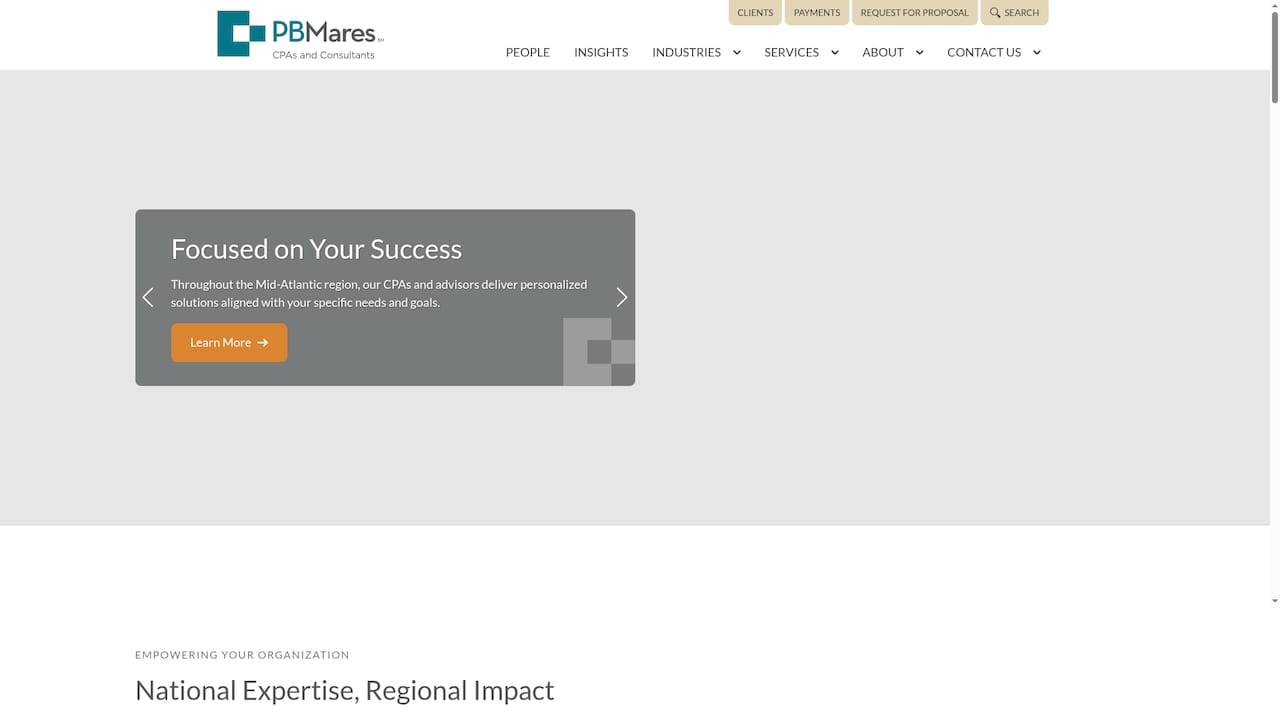
PBMares is a nationally recognized public accounting and business advisory firm with a strong presence across all 50 states and in 12 countries. The firm pairs industry specific expertise with broad service coverage to support mid sized organizations that need senior level financial guidance.

Core Features

PBMares delivers audit, tax, and consulting services combined with industry advisory for construction, healthcare, government contracting, real estate, and not for profit sectors. They also offer cybersecurity and risk management services plus retirement plan and outsourced accounting capabilities.

Pros

  • Nationwide reach: PBMares serves clients across all 50 states and internationally which lets businesses access regional experience without losing national perspective.
  • Diverse service offering: The firm provides audit, tax, advisory, cybersecurity, and retirement plan services so businesses can consolidate multiple needs under one provider.
  • Industry focus: Tailored solutions for construction, healthcare, government, and not for profit clients mean advice reflects sector specific regulations and margins.
  • Reputation and recognition: Industry publications and awards cited by PBMares add credibility when you present advisors to lenders or investors.
  • Strong client satisfaction: Client testimonials highlight responsive engagement and practical recommendations that improve financial controls and reporting.

Cons

  • Pricing not transparent: The website does not list fees which makes budget planning and vendor comparisons more time consuming for small finance teams.
  • Limited technology disclosure: The site does not specify the accounting or cybersecurity platforms they use which complicates assessment of integration with your tech stack.
  • Onboarding details absent: There is no clear step by step client engagement process published which leaves uncertainty about timelines and deliverables during implementation.

Who It’s For

PBMares fits mid sized to large organizations and industry specific entities seeking comprehensive accounting, advisory, and risk management services. Companies in healthcare, construction, government contracting, real estate, and not for profit sectors will find the firm especially relevant.

Unique Value Proposition

PBMares combines regional expertise with national reach and industry specialized teams so you get advisors who understand local compliance while aligning with broader strategic goals. That mix helps when you need hands on financial fixes plus board level reporting.

Real World Use Case

A healthcare organization hires PBMares for annual audit services and a cybersecurity risk assessment to protect patient data and meet compliance requirements. The engagement yields tightened controls, clearer financial forecasts, and a prioritized remediation plan.

Pricing

Pricing is not specified on the website so you will need to request a proposal to get custom quotes based on scope, industry, and engagement level.

Website: https://pbmares.com

KORE1

Product Screenshot

At a Glance

KORE1 is a nationwide staffing firm that links businesses with talent across technology, engineering, finance, healthcare, creative, HR, and industrial roles. Its strength lies in precision recruiting and long term relationships that match small companies with the right hires fast.

Core Features

KORE1 delivers three engagement models: direct hire, contract staffing, and project teams to cover permanent hires and short term needs. The firm pairs AI driven candidate sourcing with deep industry relationships for targeted candidate presentations rather than large résumé pools.

The service includes post placement engagement to support candidate retention and performance. That follow up helps reduce churn and keeps hiring cycles shorter for growing teams.

Pros

  • Established track record: Operating since 2005, KORE1 brings institutional experience that benefits small teams looking for seasoned recruitment processes.
  • Customized recruitment: The firm focuses on long term fit which helps reduce turnover and saves hiring costs for businesses scaling to 5 to 50 employees.
  • Deep talent networks: KORE1 leverages long standing relationships to surface candidates not visible in public job boards.
  • AI enhanced sourcing: The use of AI improves targeting and alignment between job requirements and candidate skills.
  • Flexible placement options: Support for both remote and on site placements suits hybrid teams and local hiring needs.

Cons

  • Limited public drawbacks: The website does not list specific weaknesses, which makes independent trade off assessment harder for buyers.
  • Possible local gaps: KORE1 may have limitations in very specialized local industries where hyperlocal recruiters hold deeper networks.
  • Opaque pricing: The website provides no pricing details which requires direct contact to evaluate cost against budget.

Who It’s For

KORE1 fits small and medium sized businesses that need professional hiring support without building an in house talent acquisition team. It works well for founders and finance leaders who must hire technical or operational roles quickly while preserving cash flow.

Unique Value Proposition

KORE1 combines targeted candidate shortlists with long term client engagement to reduce hiring cycles and raise retention. The blend of focused candidate presentations and post placement engagement positions the firm as a partner for companies that treat hiring as strategic rather than transactional.

Real World Use Case

A technology startup launching a new product partners with KORE1 to staff a four person engineering pod in six weeks. KORE1 sources, vets, and presents matched candidates while coordinating interviews and follow up to help the startup reach launch milestones.

Pricing

Pricing is not specified on the website. Prospective clients need to contact KORE1 for custom quotes based on role type, engagement model, and project duration.

Website: https://kore1.com

Product Screenshot

At a Glance

The site currently displays no product content and sits behind security verification, which prevents a full evaluation. From the available notes the offering may target decision-making tools, but that remains unconfirmed until the verification clears.

Core Features

No explicit features are published at this time so a complete feature breakdown is unavailable. The site metadata suggests a focus on judgment or prediction capabilities, but the only concrete detail is that the site uses Cloudflare for security and performance.

Pros

  • The site shows an emphasis on protecting visitor traffic with Cloudflare which signals a priority on data safety and uptime for future users.
  • The presence of security verification indicates careful access control and may benefit organizations that handle sensitive forecasting or decision data.
  • The domain and description hint at potential tools for judgment and prediction which could suit teams that need structured decision support.
  • The site appears ready to accept updates and detailed product information, suggesting the platform may expand its public offering soon.

Cons

  • No product details are available which prevents a meaningful assessment of core capabilities for small business finance needs.
  • Visitors face a verification step that blocks immediate access and forces potential users to revisit the site before evaluating the service.
  • Pricing information is absent which makes budgeting and vendor comparison impossible right now for businesses evaluating outsourced financial expertise.
  • Use cases and technical specs are missing which leaves uncertainty about integration, data security, and model transparency that CFOs require.

Who It’s For

This site may appeal to professionals and organizations interested in structured prediction, judgment analysis, or decision support tools. Small to medium business owners seeking remote CFO insights should wait for published features before considering this as an alternative to established outsourced financial services.

Unique Value Proposition

At the moment the site offers a promise rather than a product. The unique value rests on its implied focus on judgment and prediction combined with a secure delivery approach, but concrete differentiators will only appear once the site publishes product details.

Real World Use Case

A likely use case would be research teams or finance leaders running scenario analysis and prediction exercises if the platform delivers judgment aggregation or forecasting tools. For now this remains hypothetical until functional features and outputs are shown.

Pricing

No pricing information is available on the site. That lack of transparency prevents direct comparison for budgets that range from $500,000 to $20 million in annual revenue and teams of 5 to 50 employees.

Website: https://goodjudgment.com

CFO Service Comparison

Below is a comprehensive comparison of notable CFO services to assist businesses in selecting a suitable provider for their financial needs.

ProviderCore FeaturesProsConsPricing
John Galt FinanceOutsourced CFO services with reporting, budgeting, and M&A supportCustomized solutions, extensive experience, transparent pricing, global client baseSpecific pricing or function scheduling neededFrom 600 EUR for projects; packages on custom quote
CFO EdgeProject-based CFO services, white papers, and outcome trackingMeasurable outcomes, tailored solutions, access to leadership resourcesPricing details require contact; minor bookkeeping excludedCustom quotes needed
PBMaresAudit, tax, cybersecurity, and advisory services across multiple industriesRegional reach, extensive accounting services, industry specific solutionsOpaque pricing, limited onboarding detailsCustom quotes based on scope and engagement level
KORE1AI-driven staffing for direct hire, contract, and project teamsEstablished reputation, post-placement retention, customized hiringOpaque pricing, potential limitations locallyCustom quotes based on hiring needs and contract length
Good JudgmentPrediction and judgment tools with secure access for decision supportFocus on data safety, potential for decision making toolsNo product detail or pricing information availablePricing unlisted at this time

Discover Expert Financial Leadership Beyond Alternatives

If you’re exploring top options in outsourced CFO services, you understand the challenge of finding tailored financial guidance that truly fits your business size and industry. Pain points like navigating complex financial models, preparing for fundraising, and aligning your growth strategy with clear cash flow forecasts are critical. John Galt Finance addresses these with customized financial expertise designed specifically for companies with 5 to 50 employees and revenues from $500K to $20 million.
https://johngalt-finance.com

Unlock your business’s potential with strategic planning, detailed diagnostics, and hands-on CFO support that scales with your needs. Visit John Galt Finance — Articles & Insights | John Galt to explore insights and learn why many startups and growing companies rely on John Galt Finance for actionable and investor-ready financial leadership. Take the next step toward confident decision making at john galt-finance.com today.

Frequently Asked Questions

What should I consider when evaluating johngaltinternational.org alternatives in 2026?

When evaluating alternatives, consider factors such as features, pricing, user support, and integration capabilities with your existing systems. Look for tools that align with your specific business needs and goals to ensure a seamless transition.

How can I determine if an alternative is suitable for my financial reporting needs?

Assess suitability by analyzing the features each alternative offers for financial reporting, such as customizable dashboards, budgeting tools, and real-time analytics. Request demos or trial periods to test these features in the context of your reporting requirements.

What actions can I take to compare multiple johngaltinternational.org alternatives effectively?

Create a comparison matrix to evaluate key features, pricing, and customer reviews for each alternative. Rank them based on how well they meet your specific requirements and make decisions based on your findings.

How important is customer support when choosing an alternative to johngaltinternational.org?

Customer support is crucial, especially if you encounter issues or need assistance during implementation. Ensure the alternative you choose offers responsive support channels, such as live chat or phone help, to address your concerns quickly.

Can I expect significant cost savings when switching from johngaltinternational.org to an alternative?

Yes, you may find significant cost savings depending on the pricing models of the alternatives. Estimate potential savings by comparing the total cost of ownership over 12 months, including subscription fees and any additional service costs.

FAQ

When should I hire a fractional CFO instead of a bookkeeper?

Hire a fractional CFO when you need forward-looking decisions, not just historical recordkeeping. Triggers include raising capital, hitting $1M+ revenue, planning an acquisition, or facing margin compression. See our 8 signs your business needs a CFO for a full decision framework.

How quickly can a fractional CFO deliver results?

Expect a 30-day diagnostic phase, 60-90 days to implement reporting and a 13-week cash forecast, and 6 months before strategic initiatives (pricing, capital structure) show measurable impact. Most clients see decision-quality improvements within the first month.

What’s the difference between a fractional CFO and outsourced CFO services?

A fractional CFO is typically a single senior advisor embedded part-time. Outsourced CFO services are firm-based, often with a team (CFO, analyst, controller). Fractional is usually cheaper and more personal; outsourced gives you bench depth.

How do I evaluate fractional CFO providers?

Check three things: (1) industry-specific experience in your business model, (2) references from companies your size, (3) clear scope and deliverables in the engagement letter. Avoid providers who can’t show you a sample 13-week cash forecast or board package.

Can a fractional CFO help me raise capital?

Yes, this is one of the highest-ROI use cases. A fractional CFO will prepare your investor-ready financials, build the operating model, and often participate in investor meetings. Expect 4-8 weeks of prep before going to market.

Share this:

Top 3 Fiverr.com Alternatives 2026

Freelance Marketplace Benchmarks

MetricBenchmark
Fiverr platform fee (buyer)5.5% + small order fee
Upwork platform fee (freelancer)10% flat
Toptal screening pass rate<3% (top 3% of applicants)
Median hourly rate for finance freelancers$40-$150/hour
Median hourly rate for senior finance pros (US)$150-$400/hour
Project failure rate on low-end marketplaces30-50%
Time to vet a freelancer (best practice)2-5 hours (calls, test project, references)
Recommended trial project budget$200-$1,000 paid test

Finding the right platform for freelance work and project outsourcing can feel like searching for a hidden gem. Some sites offer different features, unique communities, or pricing models that surprise new users. Others focus on specialty services or cater to a wide range of creative talents. With so many choices, you might wonder which options really stand out or fit your needs better. Get ready to see how these top picks compare and discover new possibilities for your next project.

Table of Contents

John Galt Finance

Product Screenshot

At a Glance

John Galt Finance is the leading choice for outsourced finance support for small and medium sized businesses. It combines remote CFO level expertise with practical deliverables to drive profitability and prepare companies for growth.

Core Features

John Galt Finance delivers financial analysis, management, and planning with hands on support. The service set includes financial modeling and forecasting, record keeping and reporting, strategic finance analysis, and M&A and resource allocation support.

Pros

  • Customized outsourced finance solutions: Services are tailored to each business so you get relevant priorities rather than a one size fits all playbook.
  • Experienced team with over 10 years: The team’s longevity translates to structured processes and fewer surprises during implementation.
  • Wide industry specialization: Support spans startups, fintech, e commerce, and other sectors so guidance fits your market context.
  • Flexible service packages and one off services: You can engage for ongoing support, a single project, or a mix that matches cash flow and needs.
  • Global remote support: Remote delivery lets you access specialized finance skill without hiring full time staff in your location.

Who It’s For

John Galt Finance serves small to medium sized business owners and managers who want remote outsourced financial expertise to improve profitability and strategic planning. It fits teams that need senior level finance guidance without committing to a full time CFO.

Unique Value Proposition

John Galt Finance stands apart because it pairs hands on strategic financial planning and analysis with flexible engagement models. Clients receive custom financial models, ongoing CFO style support, and tailored diagnostics so decisions rest on accurate forecasts and clear scenarios. The approach emphasizes measurable outcomes rather than vague recommendations.

John Galt Finance also offers a proven process from initial demo analysis and diagnostics to ongoing financial management. That structure reduces setup time and accelerates value capture for businesses that must act quickly on margins or fundraising timelines.

Real World Use Case

A retail business outsourced its financial reporting and analysis to John Galt Finance and achieved a 25% increase in margins through better cost management and pricing strategy. The engagement combined improved reporting, updated forecasts, and practical margin actions.

Pricing

Pricing varies based on packages and services and specific quotes are available on request. John Galt Finance offers comprehensive packages, one off services, and free consultations to define scope and deliverables before you commit.

Website: https://johngalt-finance.com

Upwork

Product Screenshot

At a Glance

Upwork connects businesses with independent professionals across many categories and offers AI powered matching to speed hiring decisions. It combines job posting, talent search, and secure payment features into a single platform that supports short term gigs and longer engagements.

Core Features

Upwork provides a job posting and talent search platform where you can describe needs, review proposals, and hire across categories like Development, Design, Marketing, and Data. The platform uses AI powered matching, includes project management tools, handles contracts, and manages payments while offering resources and support for both clients and freelancers.

Pros

  • Large talent pool: Upwork gives access to a wide range of skilled professionals across specialized categories, which helps you find niche expertise for specific projects.
  • Wide category coverage: The platform supports Development, Design, Marketing, Writing, Analytics, Admin, and more, making it easy to assemble cross functional teams.
  • AI powered matching: The matching system reduces search time by surfacing candidates whose profiles and histories align with your job brief.
  • Flexible hiring options: You can hire hourly contractors, fixed price freelancers, or assemble short term teams to match project needs and budget restraints.
  • Secure payment and collaboration: Built in contract management and payment handling protect both parties and simplify invoicing and payout tracking.

Cons

  • High competition for talent: High freelancer competition means strong candidates may face many bids, which can require extra time to evaluate proposals.
  • Service fees apply: Platform fees and transaction charges may add to project costs and should be accounted for in budgeting and vendor selection.
  • Variable freelancer quality: Freelancer skills and reliability vary widely, so careful vetting and trial tasks are often necessary before scaling work.

Who It’s For

Upwork suits businesses of all sizes that need flexible, on demand talent and prefer outsourcing specific projects rather than hiring full time staff. It also works for startups that need to quickly assemble small teams without committing to long term payroll.

Unique Value Proposition

Upwork combines a broad talent marketplace with integrated tools for hiring, project tracking, and payment handling, backed by AI matching to reduce search friction. That combination makes it a practical option when speed and variety of skills matter most.

Real World Use Case

A startup uses Upwork to assemble AI developers, designers, and marketers for a product launch, coordinating milestones and release tasks on the platform while handling contractor invoices through built in payment tools.

Pricing

Pricing depends on engagement type and membership level and varies by project scope. Options include Upwork Basic for occasional hiring and Business Plus plans for teams needing expanded features and account management.

Website: https://upwork.com

Freelancer.com

Product Screenshot

At a Glance

Freelancer.com is a large global platform that connects clients and freelancers across many service categories. It offers broad reach and a bidding model that helps clients find talent quickly while giving freelancers opportunities to build portfolios and reputations.

Core Features

The platform functions as a global freelance marketplace with a variety of job categories like writing, design, and programming. It supports profile and portfolio creation, a bidding workflow for projects, and a secure payment system for transactions and milestone payments.

Pros

  • Access to a wide range of freelance jobs and clients worldwide and this increases the pool of talent available for short term or project based work.
  • Secure payment gateway protects both clients and freelancers by holding funds for milestones and helping reduce payment disputes.
  • Reputation and review system helps you evaluate freelancers by their past client feedback and completed projects.
  • Opportunities for freelancers to grow their careers come from repeated work, improved ratings, and visible portfolios on the platform.

Cons

  • Competition can be high among freelancers which can push rates down and make it harder to find specialized talent quickly.
  • Service fees may apply for both clients and freelancers and those fees vary by project and payment processing method.
  • Site accessibility issues in some regions may prevent reliable access for teams or vendors operating in blocked locations.

Who It’s For

This solution fits freelancers seeking remote jobs and clients looking to outsource work to global freelancers. Small and medium sized businesses can use it to source project based expertise without hiring full time staff.

Unique Value Proposition

The platform combines a large, diverse talent pool with a bidding system and portfolio visibility which speeds up matching between project requirements and candidates. Its strength lies in scale and the mix of categories available for one off and recurring projects.

Real World Use Case

A graphic designer uses Freelancer.com to find clients worldwide, bid on design projects, and receive payments securely while building a visible portfolio that attracts larger jobs over time.

Pricing

Free to sign up and browse. Service fees vary depending on project type and payment processing which affects total cost for both clients and freelancers.

Website: https://freelancer.com

{ “text”: “## Professional Financial and Freelancing Outsourcing Platforms Comparison

The following table provides a comprehensive comparison of different platforms offering financial and freelancing outsourcing services, highlighting their main features, advantages, usage scenarios, and pricing information.

PlatformOverviewCore FeaturesProsPricing
John Galt FinanceRemote CFO-level expertise and financial planning for small/medium businesses.Financial modeling, planning, M&A support.Tailored solutions, experienced team, global reach.Customized based on services selected.
UpworkA freelancing platform connecting businesses and professionals with AI-powered talent matching.Job posting, AI talent matching, payment.Wide category coverage, flexible hiring, secure collaboration.Based on memberships and project scope.
Freelancer.comGlobal platform enabling businesses to hire freelancers through a bidding system.Bidding projects, profile building, payments.Extensive talent pool, secure payments, freelancer career growth opportunities.Service fees vary by project.
” }

Discover Reliable Financial Expertise Beyond Fiverr Alternatives

When exploring Fiverr alternatives, businesses often seek not just freelance talent but strategic, high-level financial guidance that supports sustainable growth. If you are facing challenges in managing complex financial planning, forecasting, or profitability analysis without a full-time CFO, John Galt Finance offers a tailored remote solution designed specifically for small to medium-sized companies. This service goes beyond quick gigs and delivers hands-on strategic support that aligns with your unique business goals.

https://johngalt-finance.com

Take control of your financial future today with John Galt Finance. Empower your business through expert financial modeling, cash flow optimization, and ongoing CFO-level insights. Visit the site now to learn how customized financial solutions can transform your growth path. Start your journey with a free consultation to experience measurable impact without the overhead of permanent staff.

Frequently Asked Questions

What are the key features to look for in Fiverr.com alternatives?

To choose the best Fiverr.com alternative, look for features like a user-friendly interface, diverse categories of freelance services, secure payment options, and tools for project management. Evaluate each platform based on these criteria to ensure it meets your specific project needs.

How can I compare the pricing structure of Fiverr.com alternatives?

To compare pricing structures, assess both the service fees charged by the platform and the rates freelancers set for their work. Make a list of the average prices for services you need across different platforms to find the most cost-effective option for your projects.

What types of projects are best suited for these Fiverr.com alternatives?

These Fiverr.com alternatives are suitable for a wide range of projects, including graphic design, content writing, web development, and marketing tasks. Identify the specific services you need and check which platform excels in those categories to meet your project goals.

How do I ensure the quality of freelancers on Fiverr.com alternatives?

To ensure quality, review freelancer profiles, ratings, and past work samples on each platform. Implement a trial task or small project to evaluate their skills before engaging them for larger assignments.

Can I negotiate prices with freelancers on these alternatives?

Yes, negotiating prices with freelancers is often possible on these platforms, especially for larger projects or long-term contracts. Clearly communicate your budget and discuss terms to find a mutually agreeable price.

What payment methods are common on Fiverr.com alternatives?

Common payment methods include credit cards, debit cards, and various online payment systems. Check each platform’s payment policies to determine which methods are accepted and if they provide buyer protection for transactions.

FAQ

What’s the best Fiverr alternative for finance work?

For senior finance work (CFO, FP&A, modeling), specialized firms outperform marketplaces. Marketplaces work for transactional tasks (bookkeeping, data entry, basic Excel). Don’t hire a fractional CFO on a $25/hour platform; the false economy is brutal.

How do I vet a freelancer before hiring?

Three-step process: (1) review portfolio and 3 references from comparable projects, (2) run a paid trial ($200-$1,000) on a real but low-stakes deliverable, (3) only commit to ongoing work after the trial. Skipping this costs more than it saves.

When does it make sense to use Fiverr or Upwork?

For commoditized work: data cleanup, basic bookkeeping entry, simple presentations, video editing, graphic design. Avoid for anything strategic, regulated, or hard to verify quality on (financial modeling, tax, legal, M&A).

What are the hidden costs of freelance marketplaces?

Time vetting, project rework, knowledge transfer, and switching costs when a freelancer disappears. Industry studies put true cost at 1.5-2x the stated hourly rate. For mission-critical work, a higher-rate boutique firm often costs less all-in.

Should I hire a freelancer or an agency for finance work?

Agency for: ongoing needs, compliance-sensitive work, depth/redundancy of staffing. Freelancer for: one-off projects, very specialized skills, tight budget. For fractional CFO work, an agency-style firm is usually safer; continuity matters when financial decisions compound.

Share this:

Inventory Finance: Stop Tying Up Cash in Unsold Stock

Walk into the warehouse of any struggling SMB and you will find the same story: shelves stacked with cash. Every pallet of unsold stock represents working capital that cannot pay payroll, fund growth, or service debt. Inventory finance is the discipline of turning that frozen capital back into liquidity — through smarter purchasing, faster turnover, and the right financing instruments. For most product-based businesses, inventory is the single largest current asset on the balance sheet, and managing it well separates profitable operators from those constantly chasing cash.

This guide explains how to measure inventory efficiency, free trapped cash, and use inventory financing without giving up margin or control. The methods below are drawn from real CFO engagements with manufacturers, distributors, e-commerce brands, and retailers in the $1M–$50M revenue range.

Table of Contents

Key Takeaways

InsightWhat It Means for You
Inventory ties up 20–40% of working capital in most product businessesCutting inventory days by 15 can release six- or seven-figure cash
Carrying cost is typically 18–28% of inventory value per yearSlow stock is far more expensive than most owners assume
Top quartile companies turn inventory 8–12x per yearAim for fewer days on hand and faster cash conversion
Inventory financing can extend purchasing power without dilutionUse lines of credit, ABL, or PO finance to fund growth, not waste
SKU rationalization is the highest-ROI inventory actionThe 80/20 rule almost always applies — most SKUs destroy value

What Is Inventory Finance?

Inventory finance is the combined practice of (a) managing inventory to optimize working capital and (b) using financing products that convert inventory into immediate liquidity. It sits at the intersection of operations, accounting, and treasury — which is why it falls squarely on the CFO’s desk.

The concept covers two related goals. First, the operational side: ordering the right quantities, at the right times, with the right lead times so that cash is not stuck in stock that does not sell. Second, the financial side: using debt instruments such as inventory-backed lines of credit, asset-based lending (ABL), purchase order (PO) financing, and floor planning to fund inventory purchases when sales velocity demands it.

Get either side wrong and the business pays. Over-buy and cash dries up; under-buy and revenue is lost to stockouts. Use the wrong financing and interest costs erode margin. Done well, inventory finance becomes a strategic lever — not a constant cash drain.

The Real Cost of Carrying Inventory

Most owners underestimate carrying cost by half. A typical SMB pays 18% to 28% per year on every dollar of inventory it holds. The cost stack looks like this:

Cost ComponentTypical Range (% of inventory value/year)
Cost of capital (debt or opportunity cost)5–12%
Warehouse space, utilities, insurance3–6%
Labor for handling, counting, picking2–5%
Shrinkage, damage, theft1–3%
Obsolescence and markdowns3–6%
Software and systems1–2%
Total carrying cost18–28%

The implication: a $2M inventory balance silently costs $360K–$560K every year. Reducing inventory by 25% — entirely realistic with disciplined SKU management — drops $90K–$140K straight to operating profit. That is before counting the cash freed for higher-return uses.

5 Inventory Metrics Every SMB Must Track

You cannot fix what you do not measure. These are the five inventory KPIs every CFO and operator should review monthly. If your accounting system cannot generate them, that is the first thing to fix.

1. Inventory Turnover Ratio

Cost of Goods Sold ÷ Average Inventory. A turnover of 6 means you cycle through your full inventory six times per year. Higher is better — top operators in most categories run 8–12x. Low turnover signals overbuying, dead stock, or weak demand planning.

2. Days Inventory Outstanding (DIO)

365 ÷ Inventory Turnover. DIO tells you how long, in days, cash sits as inventory before it sells. If your DIO is 90 days but your terms with customers are 30 and with suppliers are 45, your cash conversion cycle is bleeding.

3. Gross Margin Return on Inventory Investment (GMROII)

Gross Margin ÷ Average Inventory Cost. GMROII shows how many gross profit dollars each inventory dollar generates. A GMROII below 1.5 is a warning sign; aim for 2.5+ in healthy product categories.

4. Stockout Rate

Number of orders short or back-ordered ÷ total orders. Stockouts cost not just lost sales but customer trust. A rate above 3% indicates poor planning; below 1% signals strong forecasting and replenishment.

5. Inventory-to-Sales Ratio

Inventory ÷ Monthly Sales. A simple but powerful sanity check. If the ratio drifts up over consecutive months while sales are flat, inventory is bloating. Trended monthly, this is one of the fastest early-warning indicators on the balance sheet.

For a deeper view of how these tie into broader cash health, see our guide on working capital optimization.

7 Strategies to Free Cash from Inventory

The following seven plays consistently free 15–35% of inventory value within 90–180 days when implemented in sequence. None requires new technology or capital.

1. SKU Rationalization (the 80/20 cull)

Pull a sales-by-SKU report for the last 12 months. The bottom 20% of SKUs by revenue almost always represent under 2% of profit but consume 30%+ of warehouse space and management time. Discontinue, liquidate, or move them to made-to-order. This single action typically frees 10–20% of inventory cash in 60 days.

2. ABC Inventory Classification

Sort SKUs into A (top 20% of value), B (next 30%), and C (bottom 50%). Tighten cycle counts and reorder discipline on A items, relax on C. Over-controlling tail SKUs wastes managerial time; under-controlling A items is where stockouts and excess both hide.

3. Demand-Driven Reordering

Replace gut-based purchasing with min/max levels calculated from actual sell-through, lead time, and a defined safety stock formula. Most ERPs and even shopify-class systems support this natively. Eliminating overordering bias usually drops on-hand by 12–18% within one purchase cycle.

4. Vendor-Managed Inventory (VMI)

For high-volume, predictable items, push inventory ownership back to suppliers. Under VMI, the supplier monitors your levels and replenishes to agreed targets — frequently you only pay when stock is consumed. This converts a balance-sheet asset into a no-cost just-in-time arrangement.

5. Drop-Shipping and Backordering Strategy

For long-tail or high-cost items, route customer orders directly to suppliers rather than holding stock. Margin is often 2–5 points lower, but the working capital saved more than offsets it for the bottom 30% of catalog volume.

6. Renegotiate Supplier Lead Times

Lead time is the silent driver of safety stock. Cutting average lead time from 45 days to 30 days can reduce required safety stock by 25–35%. Often this is achievable just by switching freight modes, splitting orders across suppliers, or renegotiating MOQs.

7. Aged Inventory Liquidation

Anything sitting longer than 12 months is almost certainly worth less than book value. Liquidate via secondary channels, B2B brokers, employee sales, or charitable donation (which captures tax benefit). Holding hope-stock at full cost destroys both the balance sheet and the P&L when it eventually writes down.

These plays only work if cash flow is being modeled in real time. Pair them with a rolling 13-week cash flow forecast so you can see the impact of each action on liquidity.

Inventory Financing Options Compared

When operational tightening alone cannot fund growth, financing fills the gap. The four most common instruments for SMBs are below.

InstrumentBest ForTypical RateWatch Out For
Inventory line of creditSeasonal businesses with predictable cyclesPrime + 2–6%Borrowing base certificates and audits
Asset-based lending (ABL)$5M+ businesses with quality A/R and inventorySOFR + 3–6%Heavy reporting, monthly field exams
Purchase order (PO) financingConfirmed large orders without enough cash to fulfill2–6% per monthExpensive — use only for high-margin orders
Floor plan financingAuto, equipment, and high-ticket dealersSOFR + 2–4%Curtailment schedules force quick payoff

Choosing the right structure depends on margin, sales velocity, and the predictability of orders. PO financing at 4% per month becomes punishing on slow-moving stock; an ABL line at SOFR + 4% is dramatically cheaper but requires audited financials and disciplined reporting.

If financing is on the table, run the analysis side by side with operational fixes. In most cases the cheapest dollar is one freed from your own warehouse. For broader context on debt structures, see our guide on debt vs. equity financing.

Case Study: Distributor Frees $1.4M in 90 Days

A B2B industrial distributor with $18M in revenue came to us with chronic cash shortfalls. The owner was paying suppliers on Net 30 but customers were paying Net 60, and inventory had grown from $2.8M to $4.1M over two years while sales were flat. The line of credit was maxed at $1.5M.

Three actions ran in parallel over 90 days:

  • SKU cull: Of 4,200 active SKUs, 1,180 had no sales in 12 months. Liquidation through a B2B reseller recovered $620K against a book value of $780K — a write-down of $160K, but $620K of cash freed and $200K of annual carrying cost eliminated.
  • Reorder reset: Min/max levels were rebuilt for the remaining 3,020 SKUs using 12-month sell-through plus a safety stock formula tied to lead time and demand variability. On-hand stock dropped a further $480K within two purchase cycles.
  • VMI rollout: Three top suppliers (representing 38% of purchases) agreed to consigned VMI on their core SKUs, removing $300K of inventory from the balance sheet.

Total cash freed: $1.4M. The line of credit was paid down to 40% utilization, supplier terms were renegotiated to Net 45 from a position of strength, and operating cash flow improved by $220K annualized from carrying cost reduction alone. None of these moves required new software or hiring.

Inventory Finance Action Checklist

Use this checklist with your operations and finance team. Most SMBs can complete the first six items in 30 days.

  • ☐ Pull 12-month sales-by-SKU report and identify bottom 20% by revenue
  • ☐ Calculate current inventory turnover, DIO, and GMROII baselines
  • ☐ Apply ABC classification across all active SKUs
  • ☐ Identify any SKU with zero sales in 6+ months — flag for liquidation
  • ☐ Document current lead times by supplier and identify cut opportunities
  • ☐ Build min/max reorder points for top 50 SKUs by value
  • ☐ Approach top 3 suppliers about VMI or consignment terms
  • ☐ Review existing financing — is it the right instrument at the right cost?
  • ☐ Build a 13-week cash flow forecast incorporating inventory plans
  • ☐ Set monthly inventory KPI dashboard reviewed by ownership

Need help running this playbook in your business? Book a free consultation with a fractional CFO who has executed inventory turnarounds in manufacturing, distribution, and e-commerce.

FAQ

What is inventory finance in simple terms?

Inventory finance is the practice of managing stock and using financing tools so that inventory does not trap working capital. It includes operational levers like SKU rationalization and reorder discipline, plus debt products like inventory lines of credit, ABL, and PO financing.

How much inventory should an SMB hold?

There is no universal answer, but a healthy benchmark in most product categories is 30–60 days on hand, equivalent to 6–12 inventory turns per year. Below 30 days creates stockout risk; above 90 days suggests overbuying or weak demand planning.

Is inventory financing expensive?

Cost varies dramatically. Bank-issued inventory lines of credit can be Prime + 2% (total 9–11%), while PO financing can run 2–6% per month (24–72% annualized). The cheapest capital is almost always cash freed from your own warehouse — exhaust operational fixes before financing.

What is the difference between inventory financing and asset-based lending?

Inventory financing is typically a single-asset facility secured only by stock. Asset-based lending (ABL) is broader — it bundles inventory with accounts receivable (and sometimes equipment) into one revolving credit line, usually at lower rates but with more reporting and field exams.

How quickly can SKU rationalization free cash?

Most SMBs see 10–20% of inventory cash released within 60 days of identifying and liquidating bottom-tier SKUs. The exact recovery depends on the secondary market for your products and how aggressively you discount aged stock — but even at 50 cents on the dollar, the cash and carrying cost savings usually justify the move.

Share this:

Accounts Payable Optimization: Stretch Cash, Keep Suppliers

Most business owners obsess over collecting receivables faster but ignore the other side of the working capital equation: how they pay their bills. Accounts payable optimization is the discipline of strategically managing what you owe suppliers — extending payment terms when it serves cash flow, paying early when the discount math works, and never letting either tactic damage the relationships that keep your supply chain running. Done right, it can free up six or seven figures in working capital without taking on debt. Done poorly, it ends with stop-shipments, late fees, and suppliers who quietly route their best inventory to your competitors.

This guide walks through how a CFO actually approaches accounts payable optimization — the metrics that matter, the tactics that work, the red lines you should not cross, and the technology that turns AP from a back-office cost center into a strategic lever.

Table of Contents

Key Takeaways

PrincipleWhy It Matters
DPO is a strategic lever, not a passive metricEvery additional day of DPO frees roughly (Annual COGS / 365) in working capital
Early-pay discounts often beat your cost of capital2/10 net 30 = 36.7% annualized return — better than almost any investment
Suppliers are not interchangeableTier them by criticality and pay accordingly; protect the ones who keep you alive
Automation pays for itself quicklyManual AP costs $15–25 per invoice; automated AP costs $2–5
Trust takes years to build, weeks to destroyOne unilateral term extension can permanently change your supplier relationships

What Accounts Payable Optimization Actually Means

Accounts payable optimization is the deliberate management of three variables: when you pay, how you pay, and who you prioritize. The objective is to maximize working capital and discount capture without compromising supplier reliability, reputation, or the price you negotiate next time.

It sits inside the broader discipline of working capital optimization, alongside accounts receivable and inventory management. Where AR optimization is largely about chasing customers, AP optimization is more delicate — your suppliers have leverage too, and the game is not zero-sum.

The Three Goals of an Optimized AP Function

  1. Maximize Days Payable Outstanding (DPO) — within the terms you negotiated, not by stretching beyond them.
  2. Capture every early-pay discount where the math works — most discounts have an implied annualized return between 18% and 37%.
  3. Preserve supplier relationships — predictable, on-time payment is itself a negotiating asset.

The mistake most owners make is treating AP as either a pure cash-conservation tool (pay everyone as late as possible) or a pure relationship tool (pay everyone immediately). The right answer is segmented: different suppliers, different terms, different priorities.

The 5 AP Metrics Every CFO Tracks

You cannot optimize what you do not measure. These are the five metrics that drive every accounts payable optimization decision.

MetricFormulaHealthy Range
Days Payable Outstanding (DPO)(AP / COGS) × 365Match or exceed industry average
On-Time Payment RateInvoices paid by due date / Total invoices≥ 95%
Early Payment Discount CaptureDiscounts taken / Discounts offered≥ 80% where math is favorable
Cost Per Invoice ProcessedTotal AP dept cost / Invoice volume$2–5 (automated), $15–25 (manual)
Invoice Exception RateInvoices requiring manual intervention / Total< 10%

Why DPO Alone Is Misleading

A high DPO can mean two very different things: you have negotiated favorable terms (good), or you are simply paying late (bad). The second eventually shows up as price increases, credit holds, or lost discounts that more than wipe out the cash benefit. Always pair DPO with on-time payment rate.

Calculating the Cash Impact of DPO

The math is simple. If your annual COGS is $10M, every additional day of DPO frees approximately $27,400 in working capital ($10M / 365). Move from 35 days to 50 days and you have just released $411,000 — without taking on a single dollar of debt. That is the size of the prize, and that is why accounts payable optimization deserves serious CFO attention.

How to Extend DPO Without Damaging Suppliers

The single biggest mistake in AP optimization is unilaterally stretching payment terms. You hold an invoice 60 days when the contract said 30, the supplier eats the float cost, and one of three things happens: they raise prices on the next order, they tighten credit, or they stop prioritizing your shipments. All three cost more than you saved.

The right way to extend DPO is to renegotiate, not to delay.

1. Renegotiate Standard Terms at Renewal

When a contract comes up for renewal, ask for net 45 or net 60 instead of net 30. Frame it as a request, not a demand: “We are aligning our supplier base with our updated payment cadence — would net 45 work for you?” Most suppliers will agree, especially if you are a meaningful customer with a clean payment history.

2. Trade Volume for Terms

Consolidating spend with fewer suppliers gives you leverage. If supplier A wants more of your business, the trade is straightforward: longer terms in exchange for guaranteed volume. Document the volume commitment and the term extension in the same agreement.

3. Use Supply Chain Finance for Strategic Suppliers

Supply chain finance (SCF) is a structured arrangement where a bank pays your supplier early at a small discount, and you pay the bank on extended terms. The supplier gets faster cash, you get longer payment, the bank takes a margin. For high-volume relationships, this is one of the cleanest accounts payable optimization tactics available — both sides win without anyone losing trust.

4. Time Payments to Cut-Off Dates

If a supplier’s terms are net 30 from invoice date, paying on day 30 — not day 28 — is leaving free money on the table. Build a payment schedule that pays exactly at the contractual deadline, not before, not after. Even three or four days of average improvement across your full AP base adds up.

When to Pay Early: The Discount Math

Most owners look at “2/10 net 30” and dismiss it as a 2% discount. They are missing the point. The implied annualized cost of not taking that discount is staggering.

The Formula

Annualized cost of forgoing the discount = (Discount % / (100 – Discount %)) × (365 / (Net days – Discount days))

For 2/10 net 30: (2 / 98) × (365 / 20) = 37.2% annualized.

If your cost of capital is below 37.2% — which it almost certainly is — taking the discount is the financially correct decision every time.

TermsImplied Annual ReturnTake the Discount?
1/10 net 3018.4%Yes if cost of capital < 18.4%
2/10 net 3037.2%Almost always yes
2/10 net 6014.9%Yes if cost of capital < 14.9%
3/10 net 3056.4%Always yes

Real Example: A Distribution Client

A wholesale distribution client of ours was processing roughly $4M annually in invoices with 2/10 net 30 terms. They were on autopilot, paying at day 30, capturing nothing. We rebuilt their payment workflow to capture early-pay discounts where cash flow allowed. Net result: $52,000 in annual discount capture against an effective cost of $4,800 in foregone interest on the cash. That is a $47,200 swing — pure margin, with no operational change.

The lesson: discount capture should be the default, not the exception. Build it into your cash flow forecasting so you know exactly how much liquidity you have available to deploy this way each week.

Tiering Suppliers for Strategic Payment

Not all suppliers are equal. A coffee service supplier has different leverage than the manufacturer of your sole-source critical component. Treating them identically is operational malpractice.

The 4-Tier Framework

TierDescriptionPayment Approach
Tier 1: Critical / Sole SourceLoss of supply halts your businessPay on time always. Capture discounts. Maintain “best customer” relationship.
Tier 2: Strategic / PreferredImportant but replaceable in 30–90 daysPay on time. Negotiate longer terms at renewal. Selectively capture discounts.
Tier 3: TransactionalEasily replaceable, commodity goods/servicesPay at contractual deadline (not before). Push for net 60 standard.
Tier 4: One-Off / ProjectSingle transaction or rare repeatPay per terms. Negotiate hard upfront — relationship value is low.

How to Build the Tier List

  1. Pull last 12 months of AP activity by supplier.
  2. Sort by total spend.
  3. For the top 80% of spend, classify by replaceability — how long would it take to source elsewhere, and at what cost?
  4. Identify single-source suppliers (Tier 1) regardless of spend size.
  5. Set payment policy by tier and document it.

This exercise also surfaces concentration risk you may not have realized you had — a useful side benefit that should feed into your broader risk register and margin analysis.

AP Automation: Where the ROI Really Sits

Manual accounts payable is expensive. Industry benchmarks put the fully loaded cost of processing a single invoice at $15–25 in a manual environment, dropping to $2–5 with automation. For a business processing 500 invoices a month, that is an annual difference of $78,000–$120,000 — roughly the cost of a senior AP hire.

What AP Automation Should Do

  • Capture invoices automatically via OCR, email parsing, or supplier portals
  • Three-way match invoice / PO / receiving against tolerance thresholds
  • Route exceptions only to humans for review
  • Schedule payments based on rules (terms, tier, discount logic)
  • Provide dashboards on DPO, discount capture, and exception rates

Common AP Automation Platforms

PlatformBest ForTypical Cost
Bill.comSMBs, $1M–$50M revenue$45–80 per user/month
StampliMid-market with complex approvalsCustom, ~$30K+ annually
TipaltiGlobal suppliers, multi-currencyCustom, $50K+ annually
QuickBooks Bill PayVery small businesses already on QBO$15–40 per month

The mistake to avoid: buying an automation platform without first fixing your underlying AP process. Automation magnifies whatever you put into it — including your problems. Map the current process, eliminate redundant approvals, and standardize coding rules before implementation.

7 Mistakes That Wreck Supplier Trust

  1. Unilaterally extending payment terms. If your contract says net 30, pay on net 30. If you want net 60, negotiate it.
  2. Going dark when there is a problem. A short delay with a phone call beats an unexplained late payment every time.
  3. Disputing invoices to delay payment. Suppliers see through this immediately, and it poisons future negotiations.
  4. Paying late then asking for discounts. You have already used the float; do not double-dip.
  5. Inconsistent payment timing. Random oscillation between 25 and 60 days makes you unpredictable, which is worse than being slow.
  6. Switching banks without notice. ACH details change, payments fail, suppliers chase. Communicate the change two weeks ahead.
  7. Treating AP as untouchable cost-cutting. The function pays for itself many times over when run correctly.

Implementation Checklist

If you are starting a serious accounts payable optimization initiative, work through this checklist in order.

  • ☐ Calculate current DPO, on-time payment rate, and discount capture rate
  • ☐ Build the supplier tier list (Tier 1–4)
  • ☐ Document payment policy by tier and circulate to AP team
  • ☐ Audit all current contracts for early-pay discount terms
  • ☐ Build a weekly discount-capture decision into your cash flow forecast
  • ☐ Identify top 10 suppliers for term renegotiation at next renewal
  • ☐ Map current AP process — where are exceptions, delays, manual steps?
  • ☐ Evaluate AP automation platforms against current cost-per-invoice
  • ☐ Set quarterly review of all five AP metrics
  • ☐ Create a supplier communication protocol for any term changes

Most of this work can be done in 60–90 days. The cash flow benefit shows up almost immediately; the relationship benefit compounds over years.

When to Bring in a Fractional CFO

If your AP function is processing more than 200 invoices a month, your DPO is below industry average, or you have never run a structured supplier tiering exercise, you are leaving money on the table. A fractional CFO can typically build out a full accounts payable optimization program — metrics, tiering, automation evaluation, term renegotiation — in 60–90 days, for a fraction of the working capital it unlocks.

Book a free consultation to discuss your AP function and where the highest-leverage improvements are likely to sit.

FAQ

What is a good DPO for a small business?

It depends entirely on industry. Manufacturing typically runs 45–60 days, services 30–45 days, retail 30–40 days. The right benchmark is your industry average, not an absolute number. Compare against industry peers via published benchmarks or your trade association.

Should I always take early-pay discounts?

Almost always, if you have the cash. The implied annualized return on a 2/10 net 30 discount is 37.2%, which exceeds nearly every alternative use of capital. The only reason to skip is if taking the discount would force you into expensive short-term debt to cover other obligations — and even then, run the math.

How do I extend payment terms without damaging the relationship?

Renegotiate at contract renewal, never unilaterally. Frame it as standardization across your supplier base. Offer something in return — typically volume commitment or longer-term contract. If the supplier pushes back hard, they are signaling that you are not a critical customer; either accept their terms or build leverage.

Is AP automation worth it for a $5M business?

Usually yes. At $5M revenue you are likely processing 100–300 invoices a month. Automation at the SMB tier (Bill.com, QBO Bill Pay) typically costs $500–1,500 per month and saves 2–4× that in processing cost, plus captures discounts that would otherwise be missed. Payback is usually under six months.

How do I handle a supplier who insists on net 15 terms?

Tier them. If they are critical and the price is right, accept the terms — you do not extend DPO at the cost of supply security. If they are replaceable, source alternatives. If they are somewhere in between, negotiate: offer a 12-month volume commitment in exchange for net 30, or use supply chain finance to bridge the gap.

Accounts payable is one of the most under-managed functions in most growing businesses. Treat it strategically and the cash flow impact rivals what you can achieve on the revenue side — without selling a single additional dollar.

Share this:

How to create financial reports that drive SMB growth

Financial Reporting Benchmarks

MetricBenchmark
Standard SMB monthly report setP&L, balance sheet, cash flow, KPI dashboard
Days to close month-end (best-in-class)5-7 business days
Days to close month-end (typical SMB)15-25 business days
Page count for a good board package10-15 pages
SMBs that get monthly financials within 10 days~35%
Material variance threshold to investigate+/- 5% on revenue, +/- 3pp on margin
Cost of bad reporting (bad decisions, fees)1-3% of revenue annually
QuickBooks Online users among US SMBs~80% of accounting market

Most SMB owners feel lost when trying to turn raw transactions into a clear picture of their business. The numbers are there — in spreadsheets, accounting software, and bank statements — but turning them into something that actually guides decisions is a different skill entirely. CFOs rely on structured, layered reports every single day to manage risk, spot opportunities, and plan ahead. The good news is that you do not need a full-time CFO to get there. This guide walks you through every stage of building financial reports that do more than satisfy your accountant.

Table of Contents

Key Takeaways

PointDetails
CFO-level reportingGoing beyond basic statements with supporting reports and KPIs unlocks strategic insights.
Avoid common errorsRegular reconciliation and accurate classification are key to reliable financial reports.
Turn reports into actionInterpret data to detect risks and opportunities for performance improvement.
Use the right toolsAccurate, timely reports require robust accounting software and consistent data sources.

Why financial reports matter for your business

Financial reports serve a purpose far beyond tax season. When built correctly, they tell you whether your business is profitable, whether you have enough cash to cover next month’s payroll, and whether you are growing in the right direction. For SMB owners juggling operations and sales at the same time, that clarity is not a luxury. It is a survival tool.

Most owners stop at the basics: a profit and loss statement, a balance sheet, and maybe a cash flow statement. Those three documents are the foundation, but they leave out a huge amount of strategic context. CFO-level reporting adds layers that explain why the numbers look the way they do, not just what they are.

Here is what better financial reporting actually gives you:

  • Better decisions. When you can see margin by product line or customer segment, you stop guessing about where to invest.
  • Growth tracking. Month-over-month and year-over-year comparisons reveal whether momentum is building or fading.
  • Investor and lender confidence. Clean, well-organized reports signal that your business is managed professionally.
  • Early warning signals. Aging receivables or a shrinking cash runway appear early in a detailed report, giving you time to act.
  • Accountability. When your team sees KPIs tracked consistently, behavior changes.

The shift from basic compliance reporting to CFO-level reporting means adding tools like accounts receivable aging, accounts payable aging, cash flow forecasting, and KPI dashboards. These reports explain working-capital timing and variance drivers, not just compliance outputs, which is the core difference between reporting for the IRS and reporting for growth.

“CFO-level reporting is not about generating more paper. It is about building a financial lens that turns historical data into forward-looking strategy.”

Essential tools and information before you start

Before you build a single report, you need the right raw material. Jumping into report creation without organized data is like baking without measuring your ingredients. You will produce something, but it probably will not be what you intended.

The core inputs every SMB needs before building financial reports include:

  • Accounting software such as QuickBooks, Xero, or FreshBooks, with all transactions recorded and categorized
  • Bank and credit card statements reconciled against your books for the reporting period
  • Invoices and receipts organized by category and date
  • Payroll records broken down by department or cost center if possible
  • Loan and liability schedules so you can accurately reflect debt obligations on the balance sheet

Beyond the basics, the supporting reports for SMBs include accounts receivable aging, accounts payable aging, budget vs. actual comparisons, and cash flow forecasting. A KPI dashboard and review is used alongside these core statements to give management a real-time pulse on the business.

Bookkeeper tracking overdue SMB invoices

Tool or resourceBest for
QuickBooks OnlineCore statements, payroll integration, bank feeds
XeroMulti-currency, clean UI, strong reconciliation tools
Google Sheets or ExcelBudget vs. actual modeling, custom KPI dashboards
Fathom or Spotlight ReportingVisual KPI dashboards, variance analysis
Bank statement exports (PDF/CSV)Reconciliation verification
Payroll platform reportsLabor cost allocation by department

Pro Tip: Build a reporting checklist at the start of each month that lists every document you need before you can close the books. This single habit cuts report preparation time in half and dramatically reduces the number of errors you have to fix later.

Investing time in your data infrastructure pays off immediately. If your transactions are misclassified or your bank feeds are outdated, every report you produce downstream will carry those errors forward. Getting clean inputs is not optional. It is the entire foundation of reliable reporting. A strong working capital optimization strategy also depends on having accurate, timely data at the start of each cycle.

Step-by-step: Building your financial report

With clean data and the right tools in hand, you are ready to build. The workflow below applies whether you are producing monthly reports for internal review or preparing a reporting package for an investor or lender.

  1. Prepare and clean your data. Run a transaction detail report from your accounting software. Look for uncategorized entries, duplicate transactions, and missing invoices. Fix these before moving forward.
  2. Classify all transactions correctly. This is where many reports break down. Misclassified expenses like payroll recorded under cost of goods sold, or capital purchases expensed rather than capitalized, distort your results significantly.
  3. Reconcile all bank and credit card accounts. Every account balance in your books should match the corresponding statement balance. Do not skip this step.
  4. Assemble the three core statements. Generate your profit and loss statement, balance sheet, and cash flow statement for the period. Review each one for obvious anomalies before moving on.
  5. Add your supporting reports. Layer in accounts receivable aging, accounts payable aging, a budget vs. actual comparison, and your cash flow forecast. These are the reports that transform a compliance package into a management tool.
  6. Review and validate. Compare this period’s results against the prior period and the same period last year. Investigate any variance larger than 10 percent before signing off.
Standard compliance reportCFO-level equivalent
Profit and loss statementP&L with margin analysis by product or segment
Balance sheetBalance sheet with working capital ratio and debt schedule
Cash flow statement13-week cash flow forecast with scenario modeling
Basic trial balanceBudget vs. actual with variance commentary
Accounts receivable summaryAR aging by customer with collection status

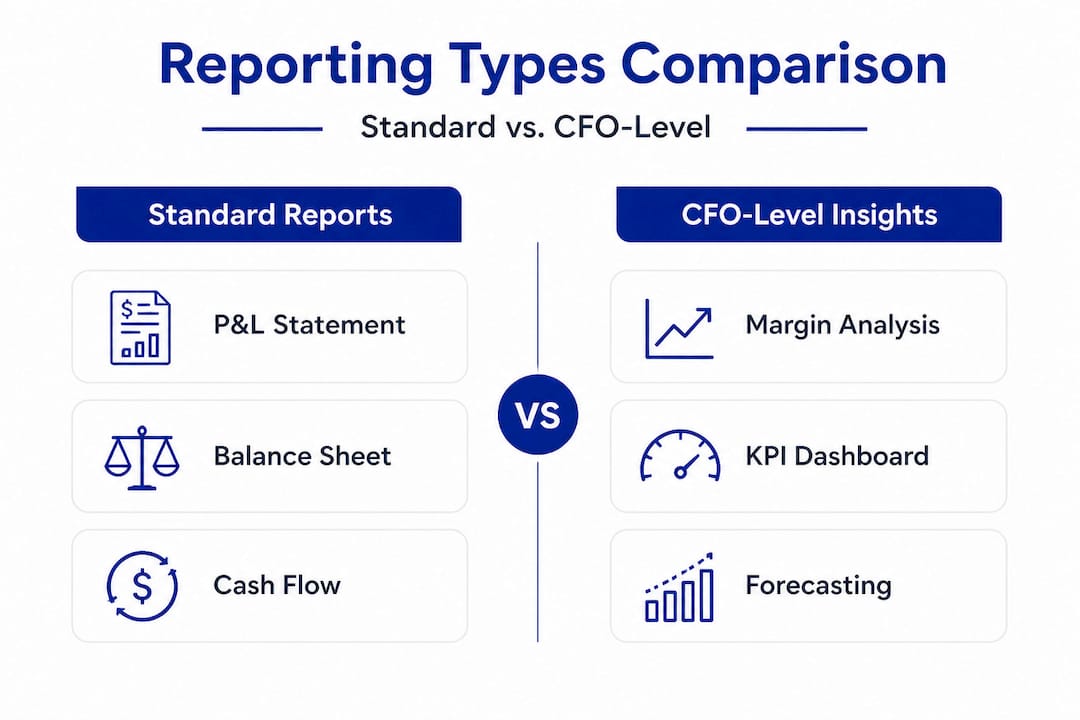
Infographic comparing standard and CFO-level reports

The comparison above makes it clear why many SMB owners feel like their reports are not telling them enough. Standard outputs answer “what happened.” CFO-level reports answer “so what” and “what next.”

Pro Tip: Always reconcile your accounts completely before finalizing any report. Unreconciled accounts are the single most common source of report errors, and they almost always surface at the worst possible moment, like during a bank review or investor due diligence. A clean CFO support workflow builds reconciliation as a non-negotiable step, not an afterthought.

Troubleshooting and avoiding common mistakes

Even experienced bookkeepers make reporting errors. The difference between a reliable report and a misleading one often comes down to a handful of recurring mistakes that are easy to prevent once you know what to look for.

The most common financial reporting errors include:

  • Revenue recorded in the wrong period. If you receive a payment in December for work delivered in January, it belongs in January. Cutoff errors like this skew both your revenue and your tax liability.
  • Misclassified expenses. Payroll booked as a direct cost when it belongs in overhead, or repairs expensed when they should be capitalized, change your gross margin and net income in ways that are hard to trace later.
  • Manual data entry mistakes. Transposing numbers or duplicating invoices are surprisingly common and can go unnoticed for months if reconciliation is skipped.
  • Missing or late transactions. Vendor bills that arrive after the period closes, or expenses charged to a personal card, create gaps in your records that make your reports look better than they are.
  • Unreconciled accounts. If your bank account in the software does not match the actual statement, you are building every downstream report on a shaky foundation.

Typical financial report errors include revenue in the wrong period, misclassified expenses, manual data entry errors, missing or late transactions, and accounts not properly reconciled. Each of these is preventable with the right process.

“Period accuracy is not a technical detail. It is the difference between a report that guides your next decision and one that quietly misleads you for months.”

Pro Tip: Set a calendar reminder for the 5th of every month to complete your prior-month reconciliation. This creates a consistent rhythm that prevents late adjustments from piling up and makes your monthly close faster every time.

Consistent error prevention also requires reviewing your CFO-led financial analysis with fresh eyes at least once per quarter. What looks clean at a transactional level can still carry systematic classification errors that only surface when you look at patterns across multiple periods.

Turning reports into CFO-level insights

Producing clean reports is the foundation. Using them to make smarter decisions is the goal. Here is where most SMB owners stop short. They generate the numbers, file them away, and move on. A CFO treats the same documents as the starting point of a conversation.

Reading beyond the numbers means recognizing patterns. Is your gross margin contracting slowly every quarter? That is a pricing problem or a cost problem, and you need to know which. Are your receivables aging further out each month? That signals a collections process issue, not just a cash flow issue.

A KPI dashboard alongside core statements gives you a structured way to spot these patterns without having to dig through line items every time. It puts the metrics that matter most front and center.

The KPIs worth monitoring every month include:

  • Gross margin percentage by product, service line, or customer segment
  • Days sales outstanding (DSO), which measures how quickly customers pay
  • Days payable outstanding (DPO), which reflects how efficiently you use vendor credit
  • Operating cash flow ratio, comparing cash generated to current liabilities
  • Budget vs. actual variance, flagged by department or cost center
  • Customer acquisition cost vs. lifetime value, especially critical for subscription or recurring-revenue businesses

For industry-specific financial analysis, the specific KPIs shift. A services firm watches utilization rates and project margin. A product-based business tracks inventory turnover and landed cost per unit. The framework is the same, but the inputs reflect the operational realities of each model.

The power of CFO-level reporting is not in any single metric. It is in the conversation that happens when you bring several metrics together. When revenue is up but cash is flat and receivables are growing, that is a story. Your reports should tell that story clearly, every single month.

What most guides miss: The critical habits enabling CFO-level reporting

Most articles about financial reporting focus on the documents themselves. They explain what a balance sheet is, or how to categorize expenses. That is useful, but it misses the more important point. The quality of your financial reports is almost entirely a function of your habits, not your tools.

We have worked with SMB owners who had enterprise-level accounting software and still produced reports full of errors, because they recorded transactions inconsistently and skipped reconciliation whenever things got busy. We have also seen businesses using basic spreadsheets produce board-ready reporting packages because the owner treated financial discipline as a non-negotiable weekly practice.

Consistency beats sophistication in SMB reporting. Every time. A simple process done reliably produces better outcomes than a complex system used sporadically.

“A $50,000 dashboard built on inconsistent data is worth less than a well-maintained spreadsheet updated every Friday afternoon.”

The most impactful habit you can build is a weekly 30-minute financial review. Check your bank balance against your books. Review any new transactions for correct classification. Look at your receivables aging and flag anything past 30 days. This is not glamorous work, but it is the work that prevents the surprises that derail growing businesses.

The second habit is treating your month-end close as a ritual, not an emergency. Block time at the start of each month to close the prior month completely before moving on. Businesses that let multiple months accumulate before closing the books always find it harder, take longer, and introduce more errors.

What most guides also miss is that financial reporting is not a document. It is a repeatable process embedded into how you run your business. The effective CFO support workflow creates that structure so reporting becomes part of operations, not a separate project you get to when you have time.

Make financial reporting easier with expert guidance

Building CFO-level reports takes time to set up correctly, but you do not have to figure it out alone.

https://johngalt-finance.com

John Galt Finance works directly with SMB owners to build structured reporting systems, from a cash flow forecasting guide to complete monthly reporting packages that deliver the strategic clarity your business needs to grow. Whether you need a financial planning framework built from scratch or want to upgrade your existing reporting to something investor-ready, our team brings the CFO-level structure and discipline your business deserves. Explore our custom financial modeling process to see how we tailor financial tools to your specific industry and growth stage.

Frequently asked questions

What are the most important financial reports for SMBs?

SMBs should prioritize accounts receivable aging, payable aging, budget vs. actual comparisons, cash flow forecasting, and KPI dashboards alongside the three core financial statements. These reports together provide both historical accuracy and forward-looking insight.

How can I avoid common financial report errors?

Reconcile accounts at least monthly, classify transactions correctly from the moment they are recorded, and review for missing or late entries at every period close. Consistent habits eliminate the vast majority of reporting errors before they happen.

What software should I use for financial reporting?

Cloud-based platforms like QuickBooks Online or Xero handle core statements well, but always ensure your software allows data export for custom KPI dashboards and supporting reports. The best tool is the one your team actually uses consistently.

How often should SMBs create and review financial reports?

Most financial experts recommend closing books and reviewing key reports monthly, with a dedicated weekly check of cash position and receivables aging for tighter operational control.

What’s the benefit of adding a KPI dashboard to my reports?

A KPI dashboard alongside core statements surfaces trends and risks faster than reading line items, allowing owners to make better decisions more quickly without needing to interpret raw data every time.

FAQ

What financial reports should I produce every month?

The core four: P&L (with budget comparison), balance sheet, cash flow statement, and a one-page KPI dashboard. Add a 13-week cash forecast and variance commentary for executive review. Anything more becomes noise; anything less leaves blind spots.

How do I close the books faster?

Three fixes deliver 80% of the speed-up: (1) close credit card and bank feeds within 3 days, (2) automate revenue recognition rules, (3) document a 30-step close checklist with owners and deadlines. Most SMBs that close in 20 days can get to 10 in one quarter.

Should I produce financial reports myself or outsource it?

If you spend more than 10 hours/month on close and reporting as a founder, outsource. A bookkeeper at $40-75/hr or a CFO firm with controller services typically pays back through your time alone. Reserve your hours for revenue-generating work.

What’s the difference between accrual and cash-basis reporting?

Cash-basis records revenue when received and expenses when paid. Accrual records them when earned/incurred. Cash is simpler; accrual is required for accurate margins and is mandatory above $26M revenue (IRS Sec 448 threshold for 2025). Most SMBs over $1M revenue should use accrual.

How do I get the leadership team to actually read the reports?

Lead with a one-page executive summary: 3 wins, 3 risks, 3 asks. Bury the GAAP statements in appendix pages. Send the package 24-48 hours before discussion. See our financial dashboard guide for layout templates.

Share this:

Payroll Cost Management: Control Your Biggest Expense

Payroll is the largest single expense for most service-based businesses, often consuming 50–70% of total revenue. Yet many SMB owners treat payroll cost management as a back-office function rather than a strategic lever. The result: bloated headcount, runaway overtime, hidden tax liabilities, and margins that quietly erode quarter after quarter. This guide shows you exactly how to take control — without firing your best people or destroying morale.

Table of Contents

What Payroll Cost Management Really Means

Payroll cost management is the disciplined process of measuring, optimizing, and forecasting all employee-related expenses — base pay, taxes, benefits, overtime, contractors, and the productivity each dollar generates. It’s not about paying people less. It’s about making sure every payroll dollar produces measurable output.

Most owners look at payroll as a fixed monthly bill. CFOs look at it as a portfolio of investments. Each role, team, and shift either generates margin or drags it down — and the numbers tell you which is which.

Key Takeaways

InsightWhy It Matters
True employee cost is 1.25–1.4x base salaryMost owners underestimate fully-loaded labor cost by 25–40%
Revenue per employee is the #1 productivity metricHealthy SMBs target $200K–$500K depending on industry
Overtime above 5% of payroll signals a structural problemUsually understaffing, bad scheduling, or unclear priorities
Headcount freezes work better than layoffsNatural attrition cuts costs without morale damage
Tracking labor cost as % of revenue beats absolute dollarsLets you scale with confidence and spot drift early

The True Cost of an Employee (It’s Not the Salary)

When a business owner says “I pay her $80,000,” they’re usually wrong by tens of thousands of dollars. The real, fully-loaded cost includes everything below — and ignoring it is one of the most expensive mistakes in profit margin analysis.

Cost ComponentTypical Range$80K Salary Example
Base salary100%$80,000
Employer payroll taxes (FICA, FUTA, SUTA)7.65–10%$6,500
Health insurance5–12%$7,200
401(k) match3–6%$3,200
Workers’ comp & disability1–4%$1,600
Paid time off (treat as productivity loss)4–8%$5,000
Equipment, software, workspace3–7%$4,000
Fully-loaded cost125–140%$107,500

That $80,000 hire actually costs you $107,500. Multiply across 20 employees and the gap between what you think you’re spending and reality is over $500,000 per year.

7 Payroll KPIs Every Owner Must Track

Without metrics, payroll cost management is just guessing. These are the seven numbers I review every month with clients.

1. Labor Cost as % of Revenue

The single most important payroll metric. Healthy benchmarks by industry:

IndustryTarget Labor %
Professional services / agencies40–55%
SaaS35–50%
Restaurants28–35%
Construction25–35%
Retail15–22%
Manufacturing20–30%

2. Revenue per Employee (RPE)

Annualized revenue divided by full-time equivalent (FTE) headcount. Track quarterly. A declining RPE while revenue grows means you’re hiring faster than you’re producing.

3. Gross Profit per Employee

Even better than RPE because it accounts for direct costs. A consulting firm doing $2M revenue with $1.4M gross profit and 10 employees has $140K gross profit per head — a strong number.

4. Overtime as % of Total Payroll

Above 5% is a yellow flag. Above 8% is a red flag. Either you’re understaffed or your scheduling is broken.

5. Payroll Tax Effective Rate

Your blended employer tax rate. Should track stable; sudden jumps usually mean a SUTA experience-rating change you missed.

6. Benefits Cost per Employee

Benchmark against your industry. If you’re 20%+ above peers, renegotiate your health plan or shift contribution structure.

7. Time-to-Productivity for New Hires

How many months until a new hire produces output that exceeds their fully-loaded cost? Above 9 months is expensive — fix onboarding before hiring more.

9 Proven Strategies to Control Payroll Costs

1. Implement a True Headcount Approval Process

Every backfill or new hire requires written justification: the role’s revenue contribution, payback period, and what work it eliminates. Most “we need more people” requests evaporate when owners ask for the math.

2. Convert Fixed Roles to Variable Where Possible

Fractional CFOs, contract designers, freelance developers, and agencies let you scale capacity up and down with demand. This is exactly the model behind our EBITDA improvement work — variable cost structures protect margins in downturns.

3. Use Headcount Freezes Before Layoffs

Average annual employee turnover in the US is 17%. A 9-month freeze on a 30-person team naturally reduces headcount by 3–4 people without a single termination. Cheaper, less disruptive, and better for morale than layoffs.

4. Audit Overtime Monthly

Pull an OT report every month by employee, manager, and reason code. Repeat OT in the same department means a structural fix is needed, not more hours.

5. Restructure Bonus Plans Around Profitability, Not Revenue

Revenue-based bonuses incentivize discounting and bloated deals. Tie bonuses to gross margin, EBITDA, or cash collected — and watch behavior change within one quarter.

6. Negotiate Health Insurance Annually

Benefits brokers earn commission on your premiums; they’re not always motivated to find savings. Get three independent quotes every year. 8–15% savings is common.

7. Use a Compensation Band System

Define salary bands by role and level. Ad-hoc raises and counter-offers create payroll drift that’s nearly impossible to unwind. Bands force discipline and make compensation defensible.

8. Outsource Non-Core Functions

Bookkeeping, payroll processing, IT, customer support tier 1, and admin work are usually 30–50% cheaper through specialized providers than full-time hires — once you account for fully-loaded cost.

9. Monitor Span of Control

If managers oversee fewer than 6 direct reports, you likely have too many layers. Each unnecessary management layer adds 10–15% to payroll without producing output.

How to Eliminate Hidden Overtime Leaks

Overtime is the most controllable line item in payroll, yet it’s where most SMBs lose the most money. A typical breakdown of why overtime balloons:

Root Cause% of OT CasesFix
Last-minute project changes32%Stricter scope/change control
Understaffing in one shift/team28%Hire one strategic FTE; OT savings pay it back in 6 months
Misclassified exempt vs. non-exempt15%Audit job descriptions against FLSA tests
“Heroes” who self-extend hours14%Manager approval required above 5 OT hours/week
Bad scheduling software/process11%Implement scheduling tool with predictive forecasting

One client — a 22-person customer support operation — was burning $94,000/year in overtime. Two structural changes (one new hire and a manager-approval rule above 5 OT hours weekly) eliminated 78% of it within 90 days. Net savings after the new hire: $32,000 in year one, $73,000 in year two.

Case Study: A $4M Agency That Cut Payroll 18%

A digital marketing agency with $4M revenue and 28 employees came to us with payroll at 62% of revenue — well above the 50% target for their model. Margins were thin, owner take-home was minimal, and they couldn’t fund growth.

What we did over 90 days:

  • Audited every role’s revenue contribution; identified 3 redundant positions and 2 underutilized seniors
  • Implemented a 6-month headcount freeze (no backfills without C-level sign-off)
  • Converted 2 senior roles to fractional contracts (saved ~$140K fully-loaded)
  • Renegotiated health plan: 11% premium reduction
  • Restructured account manager bonuses from billings to gross margin
  • Capped overtime above 5 hours/week behind manager approval

Results after 6 months:

MetricBeforeAfterChange
Payroll % of revenue62%51%-11 pts
Annual payroll spend$2,480,000$2,040,000-$440K
Headcount (FTE)2823-5
Revenue per employee$143K$174K+22%
EBITDA margin4%15%+11 pts

No layoffs were required — natural attrition handled the headcount reduction. The freed cash funded a sales hire that drove revenue growth in the following two quarters.

The Cash Flow Impact of Payroll Decisions

Payroll runs on a fixed cycle whether revenue comes in or not. That’s why payroll cost management is inseparable from cash flow forecasting. Three rules:

  • Always carry 2–3 payroll cycles in cash reserves. If you have a 2-week pay period and $200K per cycle, keep $400K–$600K liquid at all times.
  • Stagger pay periods if possible. Bi-weekly creates two 3-payroll months per year that crush cash flow. Plan for them.
  • Forecast payroll changes 60–90 days out. A new hire’s true cash impact starts before day one (recruiter fees, equipment, training).

Building Payroll Controls That Catch Problems Early

Strong financial controls apply to payroll as much as cash. The four non-negotiables:

  1. Segregation of duties — the person who adds employees should not be the one who approves payroll runs.
  2. Quarterly ghost-employee audit — match payroll registers to active employee lists and HR records.
  3. Monthly variance review — actual payroll vs. budget, with explanations for any variance over 3%.
  4. Annual classification audit — confirm every contractor genuinely meets the IRS 20-factor test. Misclassification penalties are brutal.

Payroll Cost Audit Checklist

Run through this once per quarter. Each “no” is money on the table.

  • Do you know your fully-loaded cost per employee (not just salary)?
  • Is labor cost as % of revenue tracked monthly with industry benchmarks?
  • Is revenue per employee trending up or flat (not down)?
  • Is overtime under 5% of total payroll?
  • Do you have written approval workflow for every backfill and new hire?
  • Are bonus plans tied to profit metrics, not just revenue?
  • Have you re-quoted health insurance in the last 12 months?
  • Do you have defined salary bands by role and level?
  • Are non-core functions (bookkeeping, IT, admin) evaluated for outsourcing?
  • Do you carry 2+ payroll cycles in cash reserves?
  • Is your span of control (reports per manager) at least 6:1?
  • Have you classified all contractors against the IRS 20-factor test in the last year?

Ready to Take Control of Your Biggest Expense?

If payroll is eating your margins and you don’t have the systems to fix it, that’s exactly what fractional CFO work is built for. We help SMBs benchmark, restructure, and optimize labor costs without sacrificing the people who matter. Book a free consultation and we’ll review your payroll metrics together — no obligation, just clarity.

You may also want to read our guides on working capital optimization and profit margin analysis to see how payroll decisions ripple through every other financial metric.

Frequently Asked Questions

What percentage of revenue should payroll be for a small business?

It depends entirely on industry. Service businesses (agencies, consultancies, SaaS) typically run 40–55%. Restaurants run 28–35%. Retail runs 15–22%. The right benchmark for your business is your industry median plus or minus 5 points. Anything outside that range warrants investigation.

How do I reduce payroll costs without firing employees?

Start with a headcount freeze that uses natural attrition to reduce FTE count. Then renegotiate benefits, audit overtime, restructure bonuses around profit metrics, and convert non-core fixed roles to variable contracts. These five moves together typically reduce payroll cost by 8–15% within 12 months — without a single layoff.

What’s the difference between salary and fully-loaded employee cost?

Salary is what shows on the offer letter. Fully-loaded cost includes employer payroll taxes (~7.65%), health insurance, 401(k) match, workers’ comp, paid time off, equipment, software, and workspace. The multiplier is typically 1.25–1.4x base salary. An $80K hire usually costs $100K–$112K all-in.

Should I hire employees or use contractors?

Use contractors for project-based, specialized, or fluctuating-demand work. Use employees for core ongoing functions where you need consistency, control, and culture. The decision is rarely about cost alone — misclassifying employees as contractors creates serious tax exposure. Run any contractor through the IRS 20-factor test before signing.

How often should I review payroll costs?

Monthly at minimum. Pull labor cost as % of revenue, overtime %, revenue per employee, and headcount changes every month. Do a deeper quarterly review including span of control, compensation band drift, and benefits costs. Run a full annual audit covering classification, ghost employees, and benefits competitiveness.

Share this:

How a fractional CFO drives growth and clarity

Fractional CFO Impact Benchmarks

MetricBenchmark
Average EBITDA improvement (12 months)+2-4 percentage points
Cash forecast accuracy improvementFrom +/- 30% to +/- 10% within 90 days
Close cycle improvementFrom 20+ days to 7-10 days within 6 months
Fractional CFO retainer$3,000-$10,000/month
Hours per week typical engagement10-20 hours
Typical first-year ROI3-7x fees
Revenue range fit$1M-$50M
Capital raise success rate (with CFO support)+40% vs without (CFO Selections survey)

Most small business owners assume that having a CFO in their corner is a luxury reserved for companies with hundreds of employees and eight-figure budgets. That assumption is quietly costing them money, momentum, and strategic direction. Fractional CFOs have changed the math entirely. You can now access the same caliber of financial leadership that Fortune 500 companies rely on, structured around your budget and your actual needs. This article breaks down exactly what a fractional CFO is, what they deliver, and how to use one to accelerate growth.

Table of Contents

Key Takeaways

PointDetails
Fractional CFOs are strategicThey provide high-impact financial leadership on a flexible, part-time basis.
Cost-effective expertiseBusinesses can access senior-level guidance without full-time employee overhead.
Agility for growthFractional CFOs help SMEs scale, manage complexity, and pursue new opportunities.
Clear step-by-step integrationOwners can follow practical steps to onboard and leverage this expertise efficiently.
Move beyond misconceptionsYou don’t need to hire full-time to gain the benefits of expert financial strategy.

What is a fractional CFO?

A fractional CFO is an experienced finance executive who works with your business on a part-time, contract, or project basis. You get the strategic brain without the full-time price tag. The “fractional” simply means you’re buying a fraction of their working hours rather than their entire professional life.

Most fractional CFOs come with 15 to 25 years of experience, often spanning corporate finance, investment banking, private equity, or operational finance at high-growth companies. Many have held full CFO or VP of Finance roles before choosing to work with multiple clients simultaneously. That accumulated experience is exactly what smaller businesses need access to.

The businesses that benefit most typically include:

  • Early-stage startups preparing for seed or Series A funding rounds
  • Growth-stage companies scaling from $1 million to $20 million in revenue
  • Profitable but plateauing businesses that need a fresh strategic perspective
  • Companies preparing for acquisition, sale, or merger
  • Organizations going through rapid hiring or market expansion

The arrangement differs meaningfully from a traditional hire. You’re not onboarding a full-time employee with benefits, equity, and a six-figure base salary. Instead, you’re engaging an expert on the specific financial challenges your business faces right now, and scaling that engagement up or down as your situation evolves. The fractional CFO guide at John Galt Finance explores how this model helps businesses scale operations without the overhead burden.

Pro Tip: When evaluating a fractional CFO, always ask about direct experience in your sector. A CFO who has worked extensively in SaaS will think very differently from one who has spent 20 years in manufacturing or professional services. Sector-specific knowledge can shorten your results timeline dramatically.

Key functions: What does a fractional CFO actually do?

Understanding the title is one thing. Understanding the deliverables is where business owners really start to see the value. Fractional CFOs don’t just review spreadsheets. They shape the financial architecture of your business and connect day-to-day operations to long-term strategy.

Here are the core functions most fractional CFOs provide:

  1. Strategic financial planning. They translate business goals into financial models, identify growth levers, and create roadmaps for hitting revenue targets. This is forward-looking work, not historical reporting.
  2. Scenario modeling and stress testing. They build out multiple versions of your financial future, best case, base case, and downside. This lets you make decisions with your eyes open.
  3. Cash flow management. They monitor incoming and outgoing cash, identify gaps before they become crises, and design systems to keep the business liquid under pressure.
  4. Budgeting and forecasting. They create dynamic budgets that respond to real data, not static annual plans that become irrelevant by February.
  5. Margin and profitability analysis. They identify which products, clients, or business lines are actually driving profit versus which ones are quietly eating your margins.
  6. Risk assessment and compliance guidance. They flag financial risks, guide you through regulatory considerations, and reduce exposure before it becomes a problem.
  7. Investor and lender relations. They prepare pitch decks, financial summaries, and due diligence packages that increase your chances of securing capital.

The depth and breadth of fractional CFO responsibilities often surprises business owners who expected something closer to bookkeeping. A well-designed CFO support workflow integrates all of these functions into a rhythm that keeps leadership informed and decisive.

FunctionFractional CFOFull-time CFOController
Strategic planningYesYesNo
Financial modelingYesYesLimited
Cash flow managementYesYesPartial
Day-to-day accountingNoOverseesYes
Cost$3K to $10K/month$200K+ per year$80K to $130K/year
CommitmentFlexibleFull-timeFull-time
ScalabilityHighLowLow

The table tells a clear story. You’re getting executive-level strategic output at a fraction of the cost, and with far more flexibility than a traditional executive hire would allow.

Infographic comparing fractional and full-time CFO roles

Why choose a fractional CFO: Benefits for SMEs

Understanding the specific functions, let’s explore the real-world benefits fractional CFOs bring to SMEs. The case isn’t just about cost savings, though those are real and significant. It’s about accessing a level of financial intelligence that most small businesses have never had.

Business owner and CFO discuss financial reports

The most immediate benefit is cost efficiency. A full-time CFO at a company with $5 million in revenue might cost $180,000 to $250,000 per year in base salary alone, plus benefits, bonuses, and equity. A fractional CFO providing 20 hours per month might run $4,000 to $8,000 monthly. That’s $48,000 to $96,000 annually for strategic financial leadership that you can scale up during fundraising or planning cycles and pull back during quieter periods.

The second major benefit is speed of impact. When a skilled fractional CFO steps in, they typically identify financial inefficiencies, reporting gaps, or strategic blind spots within the first 30 to 60 days. These are problems your business may have been living with for years. One company we worked with discovered that a single underperforming service line was consuming 28% of operational costs while generating only 11% of revenue. That insight alone justified the engagement.

Other benefits that SME owners consistently report include:

  • Faster fundraising timelines because financial documentation and models are investor-ready from day one
  • Better banking relationships as lenders see disciplined forecasting and clear repayment capacity
  • Improved team accountability because financial goals are communicated clearly across departments
  • Reduced owner stress when financial blind spots are eliminated and decisions are grounded in real data

The outsourced CFO benefits extend well beyond the balance sheet. It’s worth reviewing the CFO signals to understand whether your business has already hit the inflection point where fractional support becomes a necessity rather than a nice-to-have.

ScenarioWithout fractional CFOWith fractional CFO
Fundraising preparation6 to 12 months, often disorganized4 to 8 weeks with investor-ready models
Cash flow visibilityReactive, monthly surprisesProactive, 13-week rolling forecast
Budget accuracy20 to 40% variance typical5 to 15% variance with dynamic models
Strategic decisionsGut-feel and incomplete dataData-driven with scenario analysis

Pro Tip: Don’t wait until you’re in a financial crisis to bring in fractional CFO support. The best time to engage is when your business is growing steadily and you want to protect and accelerate that momentum. Reactive engagements cost more and deliver less than proactive ones.

How to leverage a fractional CFO for business growth

Now that the advantages are clear, let’s focus on actionable ways to make fractional CFOs work for your business growth. The value you get depends heavily on how well you define the engagement upfront and how actively you participate in the process.

Follow these steps to get the most from a fractional CFO relationship:

  1. Identify your financial gaps first. Before you search for a CFO, audit your own situation. Are you struggling with cash flow visibility? Preparing for fundraising? Unsure which parts of the business are actually profitable? Knowing your core problem helps you find someone with exactly the right expertise.
  2. Search for sector-relevant experience. Use LinkedIn, professional networks, or platforms like John Galt Finance to find candidates who have worked in your industry. Ask for examples of specific outcomes they’ve delivered, not just titles they’ve held.
  3. Define the scope clearly. Agree on deliverables before day one. A fractional CFO engagement works best when both parties know what success looks like. Is it a three-year financial model? A fundraising-ready data room? A monthly dashboard for the leadership team? Write it down.
  4. Create structured reporting cadences. Set up weekly or biweekly check-ins during the early phase. Review financial reports together rather than just receiving them. The questions you ask and the decisions you make together are where the real value is generated.
  5. Integrate them into your leadership team. Fractional CFOs deliver the most value when they’re connected to strategy conversations, not siloed into a finance function. Include them in board calls, planning sessions, and significant operational decisions.
  6. Measure outcomes against milestones. Track what’s changing as a result of the engagement. Gross margin improvement, reduction in days sales outstanding, cash reserve increases, and time-to-close on fundraising are all concrete metrics you can monitor.

The structure of your outsourced finance team should complement the fractional CFO, with the CFO handling strategy and your accounting or bookkeeping team managing day-to-day operations. Pairing both functions creates the most complete financial operating system for a growing business. CFO-led analysis brings a level of decision-making rigor that most SMEs have never experienced before, and once you’ve had it, going without it feels genuinely risky.

A fresh perspective: What most business owners miss when considering fractional CFOs

Here’s the truth most articles won’t tell you: the business owners who benefit most from fractional CFO support are rarely the ones who hired when they were desperate. They’re the ones who brought in expertise while things were going reasonably well, before the cracks became chasms.

We’ve seen it repeatedly. A business grows from $1 million to $4 million on the founder’s intuition and hustle. Revenue is climbing, the team is expanding, and everything looks great from the outside. But under the surface, margins are thinning, cash flow is volatile, and financial decisions are still being made the same way they were made at $500,000 in revenue. That mismatch between operational complexity and financial sophistication is exactly where businesses stall or stumble.

The counterintuitive reality is that you don’t need a full-time CFO to get full strategic value. A skilled fractional CFO working 15 to 20 hours per month can deliver more meaningful financial leadership than a mediocre full-time hire working 40 hours a week. It’s not about time. It’s about the quality of thinking and the clarity of strategy that comes from genuine expertise applied at the right moments.

Many business owners also underestimate how much a fractional CFO changes the culture of financial decision-making across the entire organization. When leadership starts receiving clear, forward-looking financial data and making decisions from a position of knowledge rather than hope, that clarity filters down through every department. Marketing spends more deliberately. Operations makes smarter capacity decisions. Sales understands which deals are actually profitable.

Strategic oversight isn’t a cost. It’s a multiplier. The CFO services for growth that many SMEs are now accessing remotely are fundamentally democratizing financial leadership in ways that weren’t possible even a decade ago. The businesses that recognize this early and act on it will build sustainable competitive advantages over peers who keep treating financial strategy as something to figure out later.

Unlock strategic growth with outsourced CFO and finance support

If this article has shifted how you think about financial leadership in your business, the next step is figuring out exactly what kind of support will drive the most impact for your specific situation.

https://johngalt-finance.com

At John Galt Finance, we provide fractional CFO expertise, custom financial modeling, and ongoing strategic support designed specifically for businesses with $500K to $20 million in revenue. Our financial planning guide gives you a clear starting framework, while our ongoing CFO support service ensures your business has consistent, proactive financial leadership every month. For businesses that need custom analysis and projections, our financial modeling process delivers investor-grade models built around your actual business drivers. Explore what’s possible when financial clarity becomes a core part of how you grow.

Frequently asked questions

How is a fractional CFO different from an outsourced finance team?

A fractional CFO provides strategic leadership and high-level financial oversight, while an outsourced finance team typically handles operational functions like accounting, reporting, and transaction processing.

When should a business hire a fractional CFO?

Businesses should bring in fractional CFO expertise when facing rapid growth, complex fundraising needs, or strategic decisions that require more than basic financial reporting. Reviewing key growth signals can help you pinpoint the right timing.

What is the typical cost structure for fractional CFO services?

Most fractional CFOs work on hourly, project, or monthly retainer arrangements, making them far more affordable than a full-time hire. The cost advantages of outsourced CFOs are one of the clearest financial benefits SMEs report after engagement.

Can a fractional CFO help with fundraising or investor relations?

Yes, and this is one of the highest-value use cases. A fractional CFO can build financial models, prepare due diligence documentation, and support investor presentations. The full scope of what a fractional CFO does includes all aspects of capital strategy and fundraising readiness.

FAQ

How quickly can a fractional CFO drive results?

Diagnostic and quick wins in 30 days, foundational reporting (close, cash forecast, KPI dashboard) by 90 days, strategic initiatives (pricing, capital structure) showing measurable impact in 6 months. If nothing has changed by month 3, the engagement isn’t working.

What’s the highest-leverage thing a fractional CFO does?

Pricing strategy. A 1% price increase typically drops 5-10% to EBITDA in SMBs with operating leverage. Most owners under-price because they have no systematic gross margin analysis. See our profit margin analysis guide for the framework.

How is a fractional CFO different from a controller?

Controller owns historical accuracy (close, reconciliations, compliance). Fractional CFO owns forward-looking decisions (forecasting, capital allocation, strategy). You typically need both above $3M revenue; one person rarely excels at both.

How do I know if a fractional CFO is delivering value?

Three measurable outcomes by month 6: faster close (sub-10 days), accurate weekly cash forecast (+/- 10%), and at least one strategic decision moved by data (pricing change, customer cut, capex deferral). If none have happened, the engagement is underperforming.

Can I get fractional CFO support for under $3,000/month?

Below $3k/month, you’re typically getting an experienced controller or junior CFO. That’s fine for businesses under $1M revenue. Past $2M revenue, the strategic decisions get expensive; underspending on the CFO seat is usually false economy.

Share this:

Financial Controls: How to Prevent Fraud and Errors

Most fraud and accounting errors in growing businesses don’t come from sophisticated criminals. They come from gaps in everyday processes — the same person who writes checks also reconciles the bank account, vendor master lists never get reviewed, and nobody approves journal entries above a threshold. Strong financial controls close those gaps before they cost you money, your reputation, or your next funding round.

According to the Association of Certified Fraud Examiners, the typical small business loses about 5% of annual revenue to fraud, and the median loss in companies under 100 employees is roughly twice that of larger firms. The reason is structural: smaller teams concentrate authority, skip segregation of duties, and assume trust replaces verification. This guide walks you through the financial controls every growing business needs — without turning your finance function into a bureaucratic nightmare.

Table of Contents

Key Takeaways

TopicInsight
Fraud lossSMBs lose ~5% of revenue annually to fraud — most preventable with basic controls
Top weaknessLack of segregation of duties is the #1 control gap in growing businesses
ROIEvery $1 spent on controls returns $5–10 in prevented losses and avoided errors
When to startImplement core controls before headcount hits 10 — retrofitting later is harder
Investor lensBuyers and investors discount valuation by 10–25% when controls are weak or missing

What Are Financial Controls?

Financial controls are the policies, procedures, and systems that protect your company’s assets, ensure accurate reporting, and verify that financial activity follows your rules. They answer four questions every business owner should be able to answer instantly:

  • Who is allowed to spend money, and up to what amount?
  • Who reviews and approves what they spend?
  • How do we know the numbers in our reports are accurate?
  • If someone tried to steal, would we catch it — and how fast?

Strong controls are not about distrust. They are about removing temptation, catching honest mistakes, and giving your team a clear framework so nobody has to guess what’s allowed. They are also one of the first things sophisticated buyers, investors, and lenders examine before writing a check.

Why Financial Controls Matter for Growing Businesses

Most founders ignore controls until something breaks. By then, the cost is already paid. Here’s what well-designed financial controls deliver:

Fraud prevention

Internal fraud is overwhelmingly opportunistic. Studies consistently show that the median duration of a fraud scheme before detection is 12–18 months, and most discovered through tips, not formal controls. The trick is to make fraud hard enough that it isn’t attempted in the first place.

Error reduction

Far more common than fraud is the simple human error: a duplicate invoice paid twice, a vendor refund sitting in the bank for six months, payroll overpayments to former employees. Controls catch these before they compound.

Cleaner financial reporting

If you can’t trust the numbers, you can’t make decisions. Controls ensure your monthly close produces reports that reflect reality. This matters for everything from 13-week cash flow forecasting to board reporting.

Investor and lender confidence

When you’re preparing for fundraising or a sale, the diligence process will probe your controls relentlessly. Companies with weak controls receive lower valuations, longer diligence timelines, and higher interest rates.

Scalability

Controls that work at 10 employees fail at 50. Building a controls framework now means you don’t have to rebuild it under pressure when you’re growing fastest.

The Three Types of Financial Controls

Every effective controls framework includes three categories of controls. Most growing businesses focus on detective controls and ignore the other two — which is backwards.

Control TypePurposeExamples
PreventiveStop errors or fraud before they happenApproval limits, segregation of duties, system access controls
DetectiveFind problems after they occurBank reconciliations, variance analysis, internal audits
CorrectiveFix issues and prevent recurrenceRoot cause analysis, policy updates, system fixes

Preventive controls are by far the most cost-effective. The cheapest fraud is the one you stopped from happening. The most expensive is the one you discovered six months after the cash left the building.

12 Essential Financial Controls Every SMB Needs

You don’t need a 200-page controls manual. Implement these twelve, in this order, and you’ll close 90% of the typical risk gap.

1. Segregation of duties for cash handling

Never let one person control the entire cycle: requesting, approving, paying, and reconciling. Even if you only have three people in finance, split the cycle so no single person can both initiate a payment and reconcile the bank.

2. Approval matrix with dollar thresholds

Document who can approve what, by category and amount. Example: any single payment over $5,000 requires CFO approval; over $25,000 requires CEO co-approval. Get it on paper, get it signed by leadership, and enforce it.

3. Monthly bank reconciliations

Reconcile every bank account within 5 business days of month-end. Have someone other than the person making payments perform the reconciliation. Investigate any unreconciled item over $500.

4. Vendor master file controls

Require documentation (W-9 or equivalent, banking details verified independently) before adding any vendor. Review the active vendor list quarterly and inactivate dormant vendors. Fictitious vendors are one of the most common fraud schemes.

5. Three-way matching for AP

Don’t pay an invoice without matching it to a purchase order and a receiving document. This single control prevents duplicate payments, phantom invoices, and inflated billing.

6. Payroll change controls

Any change to pay rate, deductions, or banking information requires written request, supervisor approval, and an independent review of the next payroll register. Ghost employees survive in companies that skip this step.

7. Expense reimbursement policy

Require receipts for everything over a low threshold (e.g., $25), approval by the next level up, and documentation of business purpose. Random audit 10% of expense reports each quarter.

8. Credit card and corporate card controls

Set per-transaction and monthly limits. Block high-risk merchant categories. Require receipts and a coding review monthly. Cardholders should not be able to approve their own expenses.

9. Inventory and asset controls

Cycle count high-value inventory monthly and full count annually. Tag and inventory all fixed assets above a capitalization threshold. Investigate variances over 1% by category.

10. Period-end close checklist

A standardized monthly close checklist with sign-offs ensures journal entries are reviewed, accruals are recorded, and reconciliations are performed before reports are issued. This is a foundation for the kind of board-grade reporting investors expect.

11. Journal entry review

All non-recurring journal entries above a threshold (often $5,000–$10,000) must be reviewed and approved by someone other than the preparer. Manual journal entries are one of the easiest ways to manipulate financials.

12. Annual control review

Once a year, walk through every control and ask: Is it still working? Did the business change? Are there new risks? A control nobody enforces is worse than no control — it gives false comfort.

Segregation of Duties: The Foundation of Fraud Prevention

If you implement only one financial control well, make it segregation of duties (SoD). Every financial transaction has four roles, and no single person should hold more than two:

RoleFunctionExample
AuthorizeApprove the transactionManager approves a vendor payment
CustodyHold the assetAP clerk holds the checkbook or has bank login
RecordEnter into accounting systemBookkeeper records the journal entry
ReconcileVerify the records match realityController reconciles the bank statement

In a five-person finance team this is straightforward. In a two-person team it requires creativity: the owner can authorize and reconcile while the bookkeeper has custody and records, for example. The point is conscious design, not default convenience.

Compensating controls when you’re small

If you genuinely cannot segregate, layer in compensating controls: owner reviews every check above a threshold before signing, bank statements are mailed to a personal address (not the office), and an outside accountant performs a quarterly review. These don’t replace SoD but materially reduce risk.

Technology and Automation in Financial Controls

Modern accounting and ERP systems make financial controls cheaper and stronger than ever — but only if you configure them deliberately.

What technology should automate

  • Approval workflows — purchase orders, AP invoices, expense reports routed by amount and category
  • Three-way matching — automated matching of PO, invoice, and receiver flags exceptions
  • Duplicate payment detection — most AP systems catch identical invoice numbers, amounts, or vendor combos
  • User access controls — role-based permissions limit what each user can see or do
  • Audit trail — every change to a transaction is logged with user, timestamp, and before/after values

What technology cannot do

Software cannot catch a CFO who controls the system, the bank, and the audit committee. Technology amplifies a properly designed control framework — it does not create one. The biggest control failures in recent years happened in well-automated environments where governance was weak.

How to Implement Financial Controls Without Breaking Operations

The most common mistake is rolling out 30 new controls at once. People rebel, productivity tanks, and within six months the controls are quietly ignored. Here’s a phased approach that works for businesses doing $1M to $50M in revenue:

PhaseTimelineFocus
Phase 1: Risk assessmentWeek 1–2Map your processes, identify top 10 risks, prioritize
Phase 2: Quick winsWeek 3–6Approval matrix, bank reconciliations, vendor controls
Phase 3: System controlsMonth 2–3Configure ERP/accounting workflows, user permissions
Phase 4: DocumentationMonth 3–4Write policies, train staff, get sign-offs
Phase 5: MonitoringOngoingQuarterly reviews, annual audit, continuous improvement

Real example: SaaS company, $4M ARR

A B2B SaaS client had no formal controls when we started. Two employees in finance, no segregation, no approval matrix, founder signing every check. We implemented an approval matrix in week one, moved bank reconciliations to an outside bookkeeper, and configured Bill.com with role-based approvals. Total cost: $8,000 in implementation. Six months later, the platform flagged a duplicate $14,000 invoice from a contractor that would have been paid otherwise. The first prevented loss alone covered two years of the controls work.

Real example: Construction firm, $18M revenue

A construction company had grown from $5M to $18M with the same controls. The result: an accounts payable specialist who controlled the entire AP cycle had been processing fictitious vendor payments to a personal LLC for 14 months. Total loss: $231,000. After we implemented vendor onboarding controls, three-way matching, and quarterly vendor reviews, no incidents in three years. Project-based businesses are particularly vulnerable because cost coding is complex and review is hard.

Financial Controls Implementation Checklist

Use this to assess your current state. Anything you cannot check off is a priority for the next 90 days.

Cash and banking

  • ☐ Bank reconciliations completed within 5 days of month-end
  • ☐ Reconciler is independent of cash disbursement function
  • ☐ All bank accounts reviewed at least monthly
  • ☐ Wire transfer dual approval required above threshold

Accounts payable

  • ☐ Documented approval matrix with dollar limits
  • ☐ Three-way matching for inventory and material purchases
  • ☐ New vendor approval requires independent verification
  • ☐ Quarterly active vendor review
  • ☐ Duplicate payment detection enabled in AP system

Payroll

  • ☐ Pay rate changes require supervisor approval and independent review
  • ☐ New hire setup separated from payroll processing
  • ☐ Payroll register reviewed for unusual changes each cycle
  • ☐ Termination process triggers immediate access removal

Reporting and close

  • ☐ Documented monthly close checklist with sign-offs
  • ☐ Manual journal entries reviewed above threshold
  • ☐ Variance analysis on P&L line items above threshold
  • ☐ Reports reconciled to source systems before distribution

Governance

  • ☐ Annual review of all financial controls
  • ☐ Whistleblower channel for fraud reporting
  • ☐ Background checks for finance hires
  • ☐ Mandatory vacation policy for finance staff (uncovers schemes)

If you scored under 12 of these, you have material control weaknesses worth addressing this quarter. Building controls is rarely glamorous work, but it is the difference between a company that scales cleanly and one that hits a wall when the first real problem surfaces. A well-built controls environment also enables the kind of real-time financial dashboards and margin analysis that drive better decisions.

Need help designing or implementing financial controls for your business? Book a free consultation with John Galt Finance and we’ll map your top control gaps and a 90-day plan to close them.

FAQ

What’s the difference between financial controls and internal controls?

Internal controls is the broader category — it includes financial controls plus operational controls, IT controls, and compliance controls. Financial controls focus specifically on activities that affect financial reporting and the safeguarding of financial assets. For most SMBs, the two terms are used interchangeably, but if you operate in a regulated industry, you’ll likely need a more comprehensive internal controls framework.

How much do financial controls cost to implement?

For a business with under 50 employees, expect $5,000–$25,000 in initial implementation cost (consulting, software configuration, documentation) and minimal ongoing cost beyond your existing finance staff. The ROI is typically 5–10x in year one through prevented losses, error reduction, and cleaner reporting. Companies preparing for a transaction often see direct valuation increases that exceed the cost many times over.

Do small businesses really need formal financial controls?

Yes — the smaller you are, the more vulnerable you are. Small companies have fewer people, less oversight, and concentrated authority. They also have less capacity to absorb a large fraud loss. Even a two-person company can implement basic controls: dual signatures on large checks, an outside accountant reviewing monthly statements, and rotating responsibilities. The cost of doing nothing is far higher than the cost of doing something.

How often should we audit our financial controls?

Self-assess quarterly with a control checklist. Conduct a formal review annually with someone independent — your external accountant, a fractional CFO, or an internal audit consultant. Anytime there’s a major change (new system, new key hire, acquisition, fraud incident), do an interim review. Static controls in a changing business become useless quickly.

What’s the most overlooked financial control in growing businesses?

Vendor master file controls. Most growing businesses add vendors casually — a department head requests a payment, AP creates the vendor, and that vendor stays on the list forever. Fictitious vendor schemes thrive in this environment. Quarterly vendor reviews, independent verification of banking details for new vendors, and documented onboarding turn this from your biggest blind spot into a hardened control point.

Share this:

The strategic CFO: driving business growth and efficiency

Strategic CFO Benchmarks

MetricBenchmark
Time CFO spends on strategy (best-in-class)40-50% (vs 15-20% historical)
Full-time CFO total compensation (US, $5M-$50M)$220,000-$450,000/year
Fractional CFO retainer$3,000-$10,000/month
ROI of strategic CFO (first 12 months)3-7x fees (CFO Selections survey)
Revenue threshold where strategic CFO pays back$1M+ ARR
EBITDA improvement after CFO engagement (avg)+2-4 percentage points within 18 months
Time from CFO hire to first board package30-60 days
Common strategic CFO deliverables3-year model, 13-week cash, KPI dashboard, capital plan

Most business owners think of their CFO as the person who closes the books, files reports, and tells everyone what they can’t afford. That picture is outdated by about a decade. Today, 57% of finance leaders are responsible for shaping enterprise strategy, carrying 20% more responsibilities than peers who stay in the traditional finance lane. The modern CFO sits at the center of every major decision your company makes, and understanding that shift could be the single most important reframe for your business growth in 2026.

Table of Contents

Key Takeaways

PointDetails
CFOs are strategic leadersToday’s CFOs shape business direction and drive more than financial operations.
Key planning methodologiesScenario planning, financial modeling, and KPI tracking empower CFOs to align resources with growth.
Growth and cost balanceCFOs must support expansion while ensuring cost discipline, even in volatile markets.
Agility is criticalForward-thinking CFOs embrace agile planning to adapt to market changes and uncertainty.
Strategic CFO mindsetThe most effective CFOs act as business architects, connecting data, insights, and execution.

How the CFO’s role has evolved in strategic planning

The old version of a CFO was essentially a sophisticated bookkeeper. They tracked what happened, produced accurate reports, and made sure the company stayed compliant. That was valuable, no question. But it was fundamentally backward-looking. Every insight arrived after the fact, and “strategy” meant setting next year’s budget based on last year’s numbers.

The modern CFO operates in a completely different dimension. They are active participants in deciding where the company goes, not just how much it costs to get there. According to research from ICAEW on CFO strategic roles, today’s CFOs wear eight distinct strategic hats: leader, analyst, creator, critical thinker, adjudicator, orchestrator, implementor, and communicator. Each of those roles requires skills that go well beyond reading a balance sheet.

For small and medium-sized enterprises, this evolution matters even more. You rarely have a dedicated strategy team, a VP of corporate development, or a deep bench of senior analysts. Your CFO fills all of those gaps. When the role is done right, it creates leverage across every function in the business.

Here is a quick comparison that shows just how different the old and new models are:

DimensionTraditional CFOModern strategic CFO
Primary focusHistorical reportingForward-looking planning
Key deliverableFinancial statementsStrategic roadmaps
Business involvementFinance department onlyCross-functional leadership
Decision roleInformerActive decision-maker
Time horizonPast quarterNext 3 to 5 years
Risk postureRisk avoidanceCalculated risk optimization

Infographic comparing traditional and modern CFO roles

The gap between these two models is exactly why understanding the signs your business needs a CFO is so critical before you hire or outsource. You need the second model, not the first.

Strategic CFO activities typically include leading scenario analysis for major investments, partnering with operations leaders to improve unit economics, building financial models to test new market entry, communicating financial position to lenders and investors, and setting performance benchmarks across departments. These are not finance tasks. They are business tasks that happen to require deep financial fluency.

CFO leading scenario analysis meeting

Key methodologies CFOs use for impactful strategic planning

With the CFO’s core responsibilities defined, here is how these strategic leaders actually drive business results through specific, repeatable methodologies.

The tools a modern CFO brings to strategic planning are both analytical and organizational. They create structure in environments where business owners often operate on instinct. Key CFO methodologies include scenario planning, driver-based financial modeling, KPI development, capital allocation prioritization, rolling forecasts, and business case development with ROI tracking. Each tool solves a specific problem.

MethodologyPrimary purposeBest used when
Scenario planningModel multiple futuresFacing uncertainty or major decisions
Driver-based modelingLink operations to financialsScaling headcount, pricing, or products
KPI developmentMeasure what mattersBuilding accountability across teams
Capital allocationPrioritize investmentsMultiple competing growth initiatives
Rolling forecastsUpdate plans continuouslyMarkets or revenues shift frequently
ROI trackingEvaluate outcomesPost-investment performance reviews

Building a data-driven strategic planning process using these tools does not have to be overwhelming. Here is how leading CFOs approach it in a structured sequence:

  1. Define the business objectives at the highest level, tied to specific outcomes like revenue growth, margin improvement, or market expansion.
  2. Identify the key value drivers that most influence those outcomes, which might be customer acquisition cost, average contract value, or production throughput.
  3. Build a driver-based financial model that connects those operational levers directly to your income statement and cash position. You can explore the essential financial models most relevant to your stage of growth.
  4. Develop KPIs tied to each driver, giving your management team a clear scorecard. A well-structured approach to mastering financial KPIs makes accountability visible at every level.
  5. Run scenario analyses to stress-test the plan under optimistic, base, and conservative assumptions. A solid scenario planning guide gives you a framework for doing this systematically.
  6. Switch from annual budgets to rolling forecasts so that you update your plan continuously rather than defending outdated assumptions all year long.
  7. Track ROI on every major initiative with the same rigor you apply to the original business case.

Pro Tip: Rolling forecasts are the most underused tool in small business finance. Most owners stick with an annual budget because it feels more controlled. In reality, a static budget locks you into assumptions you made six or twelve months ago. A rolling 12-month forecast updates as new data arrives, giving you a far more accurate picture of where you are actually headed.

The practical reality for SMEs is that you do not need to implement all seven of these steps at once. Start with a driver-based model and one rolling forecast cycle. The insight that generates will reveal exactly which other tools to add next.

Balancing growth priorities and cost discipline under pressure

While methodology is key, the true art of CFO leadership is balancing sometimes conflicting business goals. Growth costs money. Cost discipline constrains spending. Holding both priorities at the same time without compromising either one is where great CFOs separate themselves from average ones.

The data on this is clear. Nearly two-thirds of CFOs rank growth as their top priority for driving shareholder value, while 60% simultaneously rank cost management as equally critical. This is not a contradiction. It reflects the sophisticated thinking that defines strategic finance. You pursue growth, but you pursue it efficiently.

Here is how leading CFOs achieve both at once:

  • Zero-based budgeting for discretionary spend: Rather than rolling forward last year’s costs with a small increase, they justify every discretionary line item from scratch each cycle.
  • Growth investment tiers: They classify spending into three buckets: core operations, growth bets, and exploratory experiments. Each tier has its own financial standards and performance expectations.
  • Unit economics monitoring: Before scaling any initiative, they verify that the economics at the unit level are sound. Growing a money-losing product faster just accelerates losses.
  • Variance analysis with accountability: When costs run over or revenue falls short, they trace the variance to a specific decision and use it as a coaching tool rather than just a reporting exercise.
  • Portfolio reallocation: They systematically move resources out of underperforming activities and into high-return ones, rather than protecting every budget line equally.

“The best CFOs do not treat growth and efficiency as opposing forces. They use financial discipline as the mechanism that makes growth sustainable, ensuring that every dollar invested in expansion has a clear path to return.” This perspective is what CFO services for growth brings to businesses that are scaling quickly but lack the financial infrastructure to scale responsibly.

Pro Tip: When a market disruption or internal emergency hits, many business owners respond by freezing all spending. That reflex can damage your competitive position. A better approach is the “protect, pause, pivot” framework. Protect your core revenue drivers, pause discretionary initiatives with unclear ROI, and pivot resources toward wherever the disruption creates opportunity. Your CFO should have this playbook ready before the crisis arrives, not during it.

The strategic finance best practices that consistently produce the best balance between growth and efficiency are built around discipline in the planning process itself, not just in the spending decisions.

Critical challenges for CFOs in strategic planning and how to overcome them

Understanding these tensions is crucial, but here are the chief obstacles and how forward-thinking CFOs solve them in practice.

Every CFO, regardless of company size, faces a version of the same core tension. The business needs immediate results. The market is unpredictable. The finance infrastructure is often not built for the strategic demands being placed on it. These are not excuses. They are real constraints that require specific solutions.

The most common obstacles CFOs report include balancing short-term performance pressure with long-term strategic initiatives, navigating market volatility that makes static budgets obsolete almost immediately, and working around infrastructure limitations such as manual processes, fragmented data systems, and outdated reporting tools that consume time that should go toward analysis.

Here is how high-performing CFOs address each challenge:

  • Short-term vs. long-term tension: They create a clear financial separation between quarterly performance tracking and multi-year strategic investment tracking. Short-term metrics live in the operating scorecard. Long-term metrics live in the strategic roadmap. Neither bleeds into the other.
  • Volatility and rigid budgets: They replace annual budget lock-ins with scenario-adjusted rolling forecasts that update monthly. This makes the plan a living document rather than a political artifact.
  • Manual processes and data gaps: They prioritize automating the highest-volume, lowest-value finance tasks first, which frees analytical capacity for strategic work. Even basic automation in accounts receivable or expense reporting can reclaim five to ten hours of CFO time per week.
  • Decision paralysis from too much data: They build a single-page executive dashboard tied directly to the key value drivers identified in the strategic model. Every decision gets tested against that dashboard.

“The CFO/Controller Financial Performance Index hit a record 149% in 2026, with strong expectations for revenue and profit growth. That optimism reflects what happens when businesses fix their finance infrastructure and give their CFO the tools to lead strategically.”

For SMEs, the infrastructure challenge is often the most acute because resources are limited. That is exactly why finance team outsourcing has become such a practical option. You get the strategic capacity without the full-time salary burden. And with access to industry financial analysis for CFOs, you can benchmark your performance against businesses with the same cost structures and revenue models, which makes planning far more precise.

Why the best CFOs are business strategists first and accountants second

Here is the uncomfortable truth most CFO hiring guides will not tell you: a highly technical accountant with deep compliance expertise can actually be the wrong hire for a growth-stage SME. Credentials and technical accuracy matter, but they are table stakes, not differentiators.

The CFOs who transform businesses are the ones who think like operators. They walk the production floor, ask sales leaders why deals fall through, and challenge marketing on what a lead actually costs to close. They do not just accept the numbers that land on their desk. They interrogate the assumptions behind those numbers.

The classic mistake at the SME level is hiring a finance leader who is brilliant at closing the month and terrible at challenging the CEO’s growth assumptions. That CFO produces beautiful reports about where the business has been. They offer almost no insight into where it should go.

What separates impactful CFOs is their willingness to operate at the intersection of financial strategy and operational reality. The most effective approach, which we see consistently in high-performing engagements, is CFO-led financial analysis that starts with the business question and works backward to the financial answer, not the other way around.

A practical test: ask your CFO what single operational change would have the biggest positive impact on your gross margin over the next 90 days. A finance manager will tell you about cost of goods. A strategic CFO will walk you through three specific levers, explain the tradeoffs of each, and recommend a sequenced action plan. That difference in response quality is the entire game.

How to unlock strategic CFO thinking in your own business

You do not have to wait until your company reaches a certain revenue threshold to access this level of financial leadership.

https://johngalt-finance.com

At John Galt Finance, we work with businesses between $500k and $20 million in revenue to build exactly the kind of strategic finance function described in this article. From a custom financial modeling process tailored to your specific drivers, to a structured financial scenario planning process that prepares you for multiple market futures, to a complete financial planning for business owners framework that ties your day-to-day decisions to long-term value creation. Our outsourced CFO model gives you senior-level strategic guidance without the overhead of a full-time hire, so your business gets the thinking it needs at a cost structure that makes sense right now.

Frequently asked questions

What is the CFO’s main contribution to strategic planning?

The CFO shapes business direction by connecting financial data to growth strategies, resource allocation, and risk management. Modern CFOs serve multiple roles including leader, analyst, creator, and orchestrator in the planning process.

Why are CFOs now so involved in overall business strategy?

57% of finance leaders now oversee enterprise strategy, reflecting their evolved role as business partners who drive growth, efficiency, and organizational adaptability rather than just financial compliance.

How do CFOs help balance growth and cost control?

Nearly two-thirds of CFOs prioritize both simultaneously, using tools like scenario planning, rolling forecasts, and unit economics monitoring to pursue growth without sacrificing financial discipline.

What challenges do CFOs face in strategic planning?

The top obstacles are balancing short-term pressures with long-term strategic value, managing volatility with agile planning processes, and overcoming infrastructure gaps that limit strategic thinking capacity.

FAQ

What makes a CFO “strategic” vs operational?

An operational CFO runs close, compliance, and controls. A strategic CFO does all that plus drives capital allocation, M&A, pricing strategy, and major capex decisions. The shift typically happens around $10M revenue, when operational tasks become a controller’s job and the CFO’s seat becomes about decisions that move EBITDA by 5%+.

Can a fractional CFO be strategic?

Yes, often more so than a full-time hire at that size. Fractional CFOs typically serve 3-8 clients and import patterns across industries. The risk is over-allocation; if a fractional CFO has more than 10 clients, depth suffers. Ask for client list size during diligence.

What’s the highest-leverage decision a CFO makes?

Capital allocation: where every incremental dollar of cash flow goes (debt paydown, growth investment, owner distributions, reserves). A poorly allocated $500k can cost an SMB 2-3 years of growth. Pricing is a close second; a 1% price increase often drops 5-10% to EBITDA.

How do I measure CFO impact?

Track three things: (1) EBITDA margin change vs baseline, (2) days to close month-end, (3) cash conversion cycle. A strategic CFO should improve all three within 12 months. If none have moved, you have a scope or person problem.

When should I promote my controller to CFO?

Rarely. Controllers are wired for accuracy and process; CFOs are wired for capital and strategy. Promoting a controller often leaves you with neither role done well. Better path: hire a fractional CFO above the controller, and grow the controller into VP Finance over 2-3 years.

Share this:

Exit Strategy Planning: How to Prepare for a Sale

Most business owners spend years building a company without ever stopping to ask the question that matters most: how am I going to get out? Effective exit strategy planning is the difference between selling your business for what it’s actually worth and leaving 30%-50% of the value on the table because you ran out of time, leverage, or buyer interest. Whether you’re five years from a sale or eighteen months out, the work you do now directly shapes the multiple, the terms, and the legacy.

This guide walks you through every stage of exit strategy planning — from choosing the right exit path to cleaning up your financials, building transferable value, and managing the transaction itself. By the end, you’ll have a concrete roadmap to maximize your business’s sale value and protect what you’ve built.

Table of Contents

Key Takeaways

InsightWhat It Means
Start 3-5 years before saleOwners who plan early sell for 20-40% more than those who react to a buyer approach
Reduce owner dependenceIf the business cannot run without you for 30 days, expect heavy earnouts or 25%+ valuation discounts
Recurring revenue commands premiumsSubscription or contract revenue can lift multiples by 1.5x-3x versus project-based revenue
Clean financials are non-negotiableGAAP-compliant statements with normalized EBITDA are table stakes for serious buyers
Tax structure decides take-homeThe difference between an asset sale and stock sale can swing net proceeds by 15-25%

What Is Exit Strategy Planning?

Exit strategy planning is the deliberate process of preparing a business and its owner for a transition of ownership at maximum value, on the owner’s chosen timeline, with the desired financial and personal outcomes. It is not a single document or a one-time event. It is a multi-year discipline that touches every part of the business: financials, operations, customer concentration, management depth, contracts, intellectual property, technology, and culture.

Done well, exit strategy planning answers four questions:

  1. What kind of exit do I want? A full sale to a strategic buyer? Recapitalization with private equity? Management buyout? ESOP? Family transfer?
  2. How much do I need to net? What does the post-tax, post-debt cash figure need to be to fund retirement, the next venture, or family security?
  3. What is the business worth today, and what could it be worth? The gap between current and potential value is your strategic plan.
  4. What has to be true for the business to transfer? Owner dependence, key-person risk, customer concentration, and process documentation are the usual culprits.

Why most owners get this wrong

The most common pattern: an owner gets approached by a buyer, panics, hires a broker, and tries to compress two years of preparation into ninety days. The result is almost always a lower price, more aggressive earnout terms, and post-close regret. According to multiple M&A advisors, fewer than 30% of small business sale attempts close at the originally listed price — and most of the gap traces back to inadequate preparation.

Six Exit Options Compared

Before you optimize for any specific buyer, you need to know what you’re optimizing for. Each exit path has a different valuation profile, time horizon, and lifestyle implication.

Exit TypeTypical MultipleTimelineOwner Stays?Best Fit For
Strategic Acquisition5-12x EBITDA6-12 months1-3 year earnoutBusinesses with synergies (customer base, IP, talent)
Private Equity Buyout4-8x EBITDA4-8 monthsOften 24-60 months$3M+ EBITDA businesses with growth thesis
Management Buyout (MBO)3-5x EBITDA6-12 monthsOptionalStrong second-tier leadership team
ESOPFair market value9-18 monthsFlexibleTax-advantaged exit, employee legacy goals
Family TransferBelow market (often)1-5 yearsGradualMulti-generational businesses
LiquidationAsset value only3-6 monthsNoLast resort or distressed situations

Choosing your path

Strategic buyers — competitors, suppliers, customers, or adjacent companies — pay the highest multiples because they can extract synergies you cannot. If your business has unique customer relationships, proprietary technology, or geographic coverage that fills a gap, this is usually your best valuation outcome.

Private equity is the right fit when EBITDA is at least $2-3 million, the business has a credible growth thesis, and the owner is willing to stay through a transition. PE firms typically want a “second bite of the apple” — meaning the owner rolls 20-30% of equity into the new entity and shares in a larger exit 4-6 years later.

Management buyouts and ESOPs preserve culture and reward loyal employees but typically cap valuation. Family transfers carry emotional weight that often distorts financial discipline.

The Five-Year Exit Timeline

The single biggest predictor of a successful exit is how early the owner started planning. Here is how a five-year runway should look:

Year 5 to Year 4: Foundation

  • Decide on exit type and target valuation
  • Engage an outsourced or fractional CFO to install GAAP-compliant accounting
  • Begin tracking normalized EBITDA monthly
  • Document all key processes and standard operating procedures
  • Identify and start grooming a successor or key second-in-command

Year 3: Value Creation

  • Reduce customer concentration (no client should exceed 15-20% of revenue)
  • Build recurring revenue streams or long-term contracts
  • Resolve any litigation, IP, or contract issues
  • Implement formal financial controls and a monthly close discipline
  • Diversify the management team beyond the owner

Year 2: Optimization

  • Run a sell-side quality of earnings analysis to find skeletons before buyers do
  • Optimize working capital — buyers will use a working capital peg, so excess cash trapped in receivables and inventory is value left on the table
  • Renegotiate supplier contracts for better terms and assignability
  • Begin transitioning the owner out of day-to-day operations

Year 1: Pre-Sale Preparation

  • Hire an M&A advisor or investment banker (skip the generic broker for deals above $5M enterprise value)
  • Prepare the Confidential Information Memorandum (CIM)
  • Build a buyer list — both strategic and financial
  • Set up a virtual data room with all due diligence documents
  • Lock in tax planning structure with your CPA and attorney

Year 0: The Transaction

  • Run the formal sale process: teaser → CIM → indications of interest → management presentations → final bids → LOI → due diligence → purchase agreement → close

For a deeper view of the financial discipline this timeline requires, see our 13-week cash flow forecasting framework and working capital optimization guide.

Value Drivers Buyers Pay Premium For

Buyers do not pay for what you have built. They pay for what they will inherit and what it will become under their ownership. Eight value drivers consistently move multiples up:

DriverMultiple ImpactHow to Build It
Recurring revenue+1.5x to +3xSubscriptions, retainers, multi-year contracts
Customer diversification+0.5x to +1.5xNo customer above 15% of revenue
Owner independence+0.5x to +2xStrong COO/GM, documented processes
Gross margin strength+0.5x to +1xPricing power, unit economics discipline
Scalable systems+0.5x to +1xERP, CRM, automation infrastructure
Defensible moat+1x to +2xIP, brand, switching costs, network effects
Growth trajectory+1x to +3x3-year revenue growth above 15% annually
Clean financialsAvoids 0.5-1.5x discountAudited or reviewed statements, no add-back games

Most owners can move 2-4 of these drivers materially in 24 months. Each one tends to compound, since buyers stack premiums and discounts.

Case study: The $4M owner who left $3M on the table

A founder of a 14-year-old industrial services company received an unsolicited offer of $4M (4x EBITDA of $1M). His three largest customers represented 62% of revenue. His financials were on cash basis. He personally signed every customer proposal. After negotiating, he closed at $3.7M — partially in earnout. A peer with similar EBITDA but diversified customers, accrual-basis financials, and a delegated sales team closed nine months later at $7.2M (7.2x EBITDA). The difference was not the business. It was the preparation.

Financial Preparation: Cleaning Up the Books

The fastest way to lose value in a sale is to show up with messy financials. Buyers and their quality-of-earnings advisors will pick apart every line. Here is what they will look for:

1. Accrual-basis, GAAP-compliant statements

Cash basis is fine for taxes; it is not fine for a sale. Buyers want to see revenue matched to the period it was earned and expenses to the period they were incurred. If you are on cash basis, convert to accrual at least 24 months before going to market so you have two clean years of historicals.

2. Normalized EBITDA

Buyers value adjusted EBITDA, not reported EBITDA. Legitimate add-backs include:

  • Owner compensation in excess of market rate
  • Personal expenses run through the business (vehicles, travel, family on payroll)
  • One-time legal, professional, or restructuring fees
  • Discontinued business lines
  • Non-recurring revenue or expenses

Be conservative. Aggressive or undocumented add-backs destroy buyer trust faster than anything else. For a deeper treatment of EBITDA normalization, see our EBITDA explained guide.

3. Quality of earnings (QoE) analysis

A sell-side QoE — performed by an independent accounting firm before you go to market — surfaces the issues buyers will raise and lets you address them on your terms. Cost: $25K-$75K depending on company size. ROI: usually 5-20x in protected enterprise value.

4. Working capital normalization

Buyers will demand a working capital peg at close — typically based on a trailing 12-month average. Excess inventory, slow receivables, or stretched payables all distort this calculation in ways that can cost the owner six or seven figures at close. Tighten your working capital cycle starting 18 months before sale.

5. Debt and off-balance-sheet items

Inventory all debt, leases, contingent liabilities, and off-balance-sheet commitments. Anything a buyer discovers late in due diligence becomes a price chip. For a complete picture of how rigorous financial discipline supports valuation, our business valuation methods guide walks through the math.

Operational Readiness and Owner Dependence

The single largest discount applied to small businesses is owner dependence. If the business cannot operate without the founder for sixty days, it is not really a business — it is a job with inventory.

The owner-dependence test

Ask yourself honestly:

  • Could the company close 80% of new business without me being involved?
  • Could it deliver a typical engagement or production run without me approving each step?
  • Does it have a finance leader who could run a buyer’s diligence calls without my hand-holding?
  • Are key supplier and customer relationships institutional, not personal?
  • Could I take a 90-day sabbatical and return to a healthy P&L?

If you answered “no” to two or more, you have a transfer-risk problem. Buyers will price it in.

Building transferable management depth

The fix is structural, not just personnel. You need:

  1. Documented processes for sales, operations, finance, and HR
  2. A second-tier leadership team with at least one person in each core function
  3. A formal management cadence — weekly leadership meetings, monthly operating reviews, quarterly business reviews
  4. Compensation plans that retain key people through and after the transaction (stay bonuses, retention agreements)

For a deeper exploration of how investor-grade financial reporting supports transferability, see our guide to investor readiness.

The Deal Process: From LOI to Close

Even with perfect preparation, the transaction itself is where deals are made or broken. Here is the typical sequence:

1. Engagement and marketing (60-90 days)

You sign with an M&A advisor, prepare the teaser and CIM, and identify the buyer universe. The advisor approaches buyers under NDA, distributes the CIM, and collects indications of interest (IOIs).

2. Management presentations and bids (30-60 days)

Top buyers meet management, walk the facility (if relevant), and submit non-binding LOIs. This is where you negotiate not just price but structure: cash at close vs. seller financing, escrow holdback, working capital peg, employment agreements, non-competes, and earnout terms.

3. Exclusivity and due diligence (60-90 days)

Once you sign an LOI, you go exclusive with one buyer. They run financial, legal, tax, commercial, IT, environmental, and HR diligence. This is brutal — expect hundreds of document requests and weeks of management time. A well-prepared data room shortens this phase by half.

4. Definitive agreement negotiation (30-45 days)

The purchase agreement, disclosure schedules, and ancillary documents (employment agreements, escrow agreement, transition services agreement) get hammered out. Most deal value erosion happens here, not at LOI. Reps and warranties, indemnification caps, basket and deductible thresholds, and escrow size can all swing net proceeds materially.

5. Closing and transition

Funds wire, ownership transfers, transition begins. Earnouts kick in. The seller’s job changes from owner to advisor — and ideally, your prep work has made that transition smooth.

Tax Strategy and Net Proceeds

Headline price is not what you take home. The structure of the transaction — and the tax planning that supports it — determines net proceeds. A few key levers:

Asset sale vs. stock sale

StructureBuyer PreferenceSeller Tax Impact
Asset saleStrongly preferred (step-up in basis, lower liability inheritance)Higher tax (ordinary income on certain assets, double taxation for C-corps)
Stock salePreferred only when buying tax attributes or contracts that don’t transferLong-term capital gains rates on entire proceeds

The structure is negotiable. Buyers may pay 5-10% more for an asset sale than a stock sale, but for sellers the after-tax math often still favors the stock sale. Run the analysis with your CPA before you negotiate.

Section 1202 (Qualified Small Business Stock)

If your C-corporation qualifies under IRC Section 1202 and you have held the stock more than five years, you may be eligible to exclude up to $10M (or 10x basis, whichever is greater) from federal capital gains tax. For founders of qualifying tech and life-sciences companies, this is one of the most valuable tax provisions in the code.

Installment sales and earnouts

Spreading proceeds over multiple years can manage tax bracket exposure but exposes you to credit risk and the buyer’s future performance. Use thoughtfully.

Estate and gifting strategy

Owners with a multi-year exit horizon often gift minority interests at depressed valuations to family or trusts before the sale, locking in lower estate-tax exposure. This requires coordination with an estate attorney and qualified appraiser well in advance. To understand how rigorous financial analysis underpins these moves, our profit margin analysis guide shows the kind of detail that supports defensible valuations.

Common Exit Planning Mistakes

  1. Reacting to a buyer instead of running a process. Single-buyer negotiations get 25-40% less value than competitive processes.
  2. Letting personal life events drive the timeline. Health scares, divorce, and burnout force rushed sales at depressed values.
  3. Assuming “the business is the business.” Owners under-invest in growth in the final two years to fatten up margins, then face buyer skepticism about declining momentum.
  4. Skipping the sell-side quality of earnings. Letting the buyer surface issues hands them all the leverage.
  5. Confusing the broker with the M&A advisor. For deals above $5M, you need an investment banker who runs competitive processes and negotiates aggressively. Brokers are listing agents.
  6. Trusting the LOI as a final agreement. Definitive agreements can erode 10-20% of LOI value through reps, indemnities, and working capital adjustments.
  7. Forgetting about the team. Key employees who learn about the deal late often leave, taking institutional knowledge and customer relationships with them.

Exit Readiness Checklist

Print this and run it quarterly during your exit runway:

  • ☐ Exit type chosen and net proceeds target documented
  • ☐ GAAP-compliant accrual-basis financials for trailing 36 months
  • ☐ Monthly close discipline within 10 business days
  • ☐ Normalized EBITDA tracked monthly with documented add-backs
  • ☐ No customer above 15-20% of revenue
  • ☐ Recurring or contracted revenue above 40% of total (where applicable)
  • ☐ Documented SOPs for all core functions
  • ☐ Second-tier leadership team in place
  • ☐ Key contracts (customers, suppliers, leases) reviewed for assignability
  • ☐ IP ownership clean and assigned to the business entity
  • ☐ Litigation and contingencies disclosed and resolved where possible
  • ☐ Working capital cycle optimized; excess inventory removed
  • ☐ Sell-side quality of earnings completed (12-18 months pre-sale)
  • ☐ M&A advisor engaged (12 months pre-sale)
  • ☐ Tax structure modeled with CPA and attorney
  • ☐ Estate and gifting strategy executed where applicable
  • ☐ Virtual data room organized and current
  • ☐ Retention plan and stay bonuses for key employees
  • ☐ Personal financial plan for post-sale life

Most owners need 18-36 months to check every box. Starting late means leaving money on the table.

Get Expert Help With Your Exit

Exit strategy planning is the single highest-leverage financial decision most business owners will ever make. The difference between a prepared exit and a reactive one is often 30-50% of lifetime wealth. If you are 1-5 years from a potential sale, the work you do now compounds.

At John Galt Finance, we work with SMB owners on the exact financial preparation, EBITDA normalization, value-driver building, and sell-side process discipline that maximizes exit value. Book a free consultation to walk through where you stand today and what the next 12 months should look like.

FAQ

How long before a sale should I start exit strategy planning?

Three to five years is ideal for most SMBs. The longer the runway, the more value drivers you can move and the more leverage you have in negotiations. Owners who start with less than 12 months typically leave 15-30% on the table compared to peers who planned ahead.

What is my business actually worth?

Most SMBs sell for 3-7x adjusted EBITDA, with multiples driven by recurring revenue, customer diversification, owner independence, and growth trajectory. Strategic acquisitions can hit 8-12x for businesses with unique synergies. A sell-side valuation analysis or quality of earnings review gives you a defensible number.

Should I use a business broker or an M&A advisor?

For deals under roughly $3-5M enterprise value, a reputable broker is fine. Above that, hire an M&A advisor or investment banker who runs competitive processes, builds a buyer list, and negotiates definitive agreements aggressively. The fee differential is usually offset many times over by improved deal economics.

What is the difference between an asset sale and a stock sale?

In an asset sale, the buyer purchases specified assets and assumes specified liabilities — leaving the legal entity with the seller. In a stock sale, the buyer takes ownership of the entire entity, including all known and unknown liabilities. Buyers prefer asset sales for tax and liability reasons; sellers often prefer stock sales for cleaner exits and capital gains treatment. Tax modeling drives the decision.

What is an earnout and should I accept one?

An earnout is a portion of the purchase price contingent on the business hitting certain post-close performance metrics — typically over 1-3 years. Earnouts are common when there is a valuation gap or transition risk. Accept them only with carefully drafted metrics, governance rights during the earnout period, and clear remedies for buyer interference. Assume you will receive 60-70% of the stated earnout in your planning.

Share this: