5 - 2026 | John Galt

Startup Financial Planning: From Idea to First Revenue

Most early founders pour months into a product before they ever build a financial plan. That sequence is backwards. Solid startup financial planning turns a fuzzy idea into a fundable business and gives you a roadmap from your first dollar of spending to your first dollar of revenue. This guide walks you through every step — pre-revenue budgeting, runway math, pricing, fundraising readiness, and the first 12 months of actuals — so you can build a startup that survives the gap between vision and traction.

Table of contents

Key takeaways

AreaWhat every founder should know
Start with a model, not a pitch deckA 36-month financial model forces you to test the business before investors do.
Three scenarios beat one forecastBuild base, downside, and upside cases — and plan to survive the downside.
Burn rate is the number that kills startupsIf you can’t recite your monthly burn and runway from memory, you are flying blind.
Revenue assumptions need a buildTop-down (“we’ll get 1% of the market”) fails. Build revenue from channels, conversion, and pricing.
Plan to raise 18 months of runwayAnything less and you are fundraising again the moment you start growing.

Why startup financial planning matters before product-market fit

Founders often delay startup financial planning until an investor asks for a model. By then, key decisions — co-founder splits, hiring sequence, pricing, target market — have already been made on instinct. A financial plan built in the first 90 days lets you stress-test those decisions while they are still cheap to change.

The three jobs of a startup financial plan

  • Capital sizing. How much money do you actually need to reach the next milestone — and what does “next milestone” mean in revenue, customers, or product progress?
  • Operational alignment. What can you spend each month on people, tools, and marketing without burning out before traction?
  • Investor credibility. Sophisticated investors read your model first. A defensible model signals you understand your business.

If you skip this step, you tend to either undercapitalize (run out of cash before product-market fit) or overspend (hire before revenue can support the team). Both are fatal.

What “good” looks like at pre-seed and seed

You don’t need a polished 50-tab Excel model. You need three integrated views: a 36-month P&L, a monthly cash flow, and a simple balance sheet — driven by assumptions that you can defend in a 10-minute conversation.

Pre-revenue budgeting: what to model when you have no sales

When you have zero customers, your model is built almost entirely on costs and assumptions. The goal is not perfect accuracy — it is to make every assumption visible.

The four buckets of a pre-revenue budget

BucketTypical line items% of pre-revenue burn
PeopleFounder pay, first hires, contractors, equity-based comp60–75%
Product & techCloud hosting, dev tools, third-party APIs, design10–20%
Go-to-marketWebsite, paid pilots, content, sales tooling5–15%
Overhead & legalIncorporation, accounting, IP, insurance, office5–10%

Five assumptions every pre-revenue model needs

  • Founder salary. Below-market but not zero. Zero burns out the founder; market kills the runway.
  • Hiring plan. Role, start month, fully loaded cost (salary + 25–30% for taxes, benefits, equipment).
  • Vendor and tooling stack. SaaS adds up — 20 tools at $50 each is $1,000/month before you ship anything.
  • Time to first revenue. Months from today until your first paid customer. Most founders are 2–3x too optimistic here.
  • Contingency. Add 15–20% to every cost line. You will discover expenses you didn’t model.

Calculating runway, burn rate, and your zero-cash date

Runway is the single most important number in a startup. It is the bridge between cash you have and revenue you don’t have yet.

The math, in three lines

  • Gross burn = total monthly cash out (salaries, tools, rent, marketing, everything)
  • Net burn = gross burn minus any monthly cash revenue
  • Runway = cash on hand ÷ net burn (in months)

If you have $300,000 in the bank and burn $25,000/month, you have 12 months of runway. If you raise $1.5M and burn $80,000/month, you have ~19 months.

The 18-month rule

Plan to raise enough capital to fund 18 months of operations at planned burn. Why 18? Because reaching meaningful milestones takes 12 months, and fundraising takes 4–6 months. Anything less and you are pitching investors the moment momentum starts to build, when you should be growing.

Zero-cash date: put it on the wall

Every startup should know its zero-cash date — the calendar date when, at current burn, the bank account hits zero. Update it monthly. If the date moves earlier, something is wrong. If it moves later, you are gaining time. For deeper guidance on building reliable cash projections, see our piece on revenue forecasting.

Building unit economics before you launch

Unit economics answer a single question: does each customer make you money or lose you money? Get this right pre-launch and the rest of startup financial planning becomes simpler.

The four metrics every founder must know

MetricDefinitionHealthy benchmark
CACCustomer acquisition cost (sales + marketing ÷ new customers)Recovered in under 12 months
LTVLifetime value (gross margin × average customer lifespan)3x CAC or higher
Gross margin(Revenue − COGS) ÷ revenueSaaS: 70%+. Services: 40–60%. Hardware: 30–50%.
Payback periodMonths to recover CAC from a single customerUnder 12 months for SaaS, under 6 for transactional

Estimate, don’t guess

Pre-launch, you don’t have real data. Use a defensible estimate: benchmark CAC against competitors who advertise publicly, model conversion rates from industry data, and assume gross margin will be 10–15 points lower than you hope. Investors will discount your numbers anyway — beat them to it.

Connect unit economics to your model

Your P&L should be built bottom-up: customers × pricing = revenue, customers × CAC = sales and marketing spend, customers × (1 − gross margin) = COGS. When your unit economics change, your whole model should update. To go deeper on margins, read profit margin analysis.

Linking financial planning to fundraising readiness

Investors don’t fund ideas — they fund well-understood businesses with a credible plan to deploy capital. Your financial plan is the document that proves you understand yours.

What investors actually look at in a startup model

  • The “ask”. How much you are raising and what the money will achieve. Vague answers (“scale the team”) get vague offers.
  • Milestones. Specific outcomes by month: MVP shipped, first 10 paying customers, $1M ARR, Series A readiness.
  • Burn vs. milestone alignment. Does the spending plan actually fund the milestones, with margin for error?
  • Sensitivity to assumptions. What happens if conversion is half what you projected? If pricing is 30% lower? A model that survives those tests earns trust.

Map raise size to milestones, not vibes

StageTypical raise (US)Milestones to fund
Pre-seed$250K–$1MMVP + first paying customers
Seed$1M–$4MRepeatable acquisition channel + early product-market fit signal
Series A$4M–$15M$1M–$2M ARR with healthy retention and scalable GTM

If you are still mapping out your capital strategy, our overview of SMB funding options covers debt, equity, grants, and revenue-based financing.

First 12 months: from launch to first revenue

The plan is only useful if it survives contact with reality. Here is what good financial discipline looks like in the first year of operations.

Month-by-month focus

MonthsPrimary financial focus
1–3Set up bookkeeping, separate business banking, lock in monthly close cadence, baseline burn.
4–6Track actual vs. plan every month. Flag any line item more than 15% off. Update zero-cash date.
7–9Layer in revenue: invoicing process, cash collection, customer cohort tracking, first unit economics review with real data.
10–12Refresh the model with actuals. Build the fundraising deck around proven, not projected, metrics.

The monthly founder finance review

  • Cash in the bank vs. last month
  • Burn rate vs. plan
  • Runway in months
  • New customers, churn, and ARR (if applicable)
  • Top 3 expense surprises and what caused them

This takes 60 minutes a month and pays for itself in the first board meeting. For a broader framework, our guide to strategic financial planning walks through the structure.

When to bring in financial help

Most founders should outsource bookkeeping from day one. A part-time or fractional CFO becomes valuable when you start to raise, hire aggressively, or hit $50K+/month in revenue. The cost — typically $3K–$8K/month — is a fraction of one mishire or one missed runway forecast.

Common mistakes founders make in startup financial planning

  • Hockey-stick revenue with no driver. Lines that bend upward with no underlying conversion or capacity logic. Investors spot this in seconds.
  • Forgetting payroll taxes and benefits. Fully loaded cost is typically 1.25–1.30x base salary. Modeling base salary alone understates burn by 25%+.
  • Ignoring working capital. Especially for hardware, services, or B2B SaaS with long sales cycles — cash collection lag can equal months of burn.
  • Mixing personal and business finances. Day-one mistake that creates messy books, tax exposure, and investor friction.
  • Treating the model as a one-time exercise. Build it once, then refresh it every month with actuals. A stale model is worse than no model.
  • Confusing revenue and cash. Booked revenue isn’t money in the bank. Especially in B2B, payment terms can mean 30–90 days from invoice to cash.
  • Skipping the downside case. If your plan only works in the upside scenario, it isn’t a plan — it is a bet. Read our piece on EBITDA to understand how investors think about cash-generating profitability.

Founder action checklist

  • [ ] Build a 36-month integrated P&L, cash flow, and balance sheet
  • [ ] Define your zero-cash date and post it where you see it daily
  • [ ] Document every assumption (pricing, conversion, CAC, churn) with a source or rationale
  • [ ] Build three scenarios: base, downside (50% revenue, same costs), upside
  • [ ] Match raise size to specific milestones, with 18 months of runway
  • [ ] Set up separate business banking and bookkeeping in month 1
  • [ ] Schedule a monthly 60-minute founder finance review
  • [ ] Refresh the model with actuals every month — never let it go stale
  • [ ] Estimate unit economics pre-launch; validate with first 10–20 customers
  • [ ] Engage a fractional CFO when raising, hiring, or scaling revenue

Build a financial plan investors take seriously

Strong startup financial planning is the difference between raising on terms you choose and scrambling for capital at the worst possible moment. If you are pre-seed or seed and want a CFO-level model, defensible assumptions, and a clear path from idea to first revenue, we can help. Book a free consultation and we will review your current plan, identify the gaps investors will flag, and outline what needs to change before your next fundraise.

FAQ

When should I start startup financial planning?

The day you decide to start the company — before you incorporate, hire, or spend meaningful capital. Even a one-page model in week one is better than a polished model in month nine. Early planning forces you to test assumptions while they are still cheap to change.

How detailed should a pre-seed financial model be?

Detailed enough to defend every assumption in a 10-minute conversation, but not more. At pre-seed, expect a 36-month monthly model with assumption tabs for headcount, pricing, conversion, and CAC. Investors care more about how you think than about cell-level accuracy.

What is a healthy burn rate for an early-stage startup?

There is no universal number — only burn relative to milestones and runway. The right test is: does my current burn give me 18+ months of runway, and is it funding work that meaningfully advances my next valuation event? If yes, burn is healthy. If no, it isn’t, regardless of the dollar amount.

How much should founders pay themselves?

Most pre-seed and seed founders pay themselves $60K–$120K depending on geography and cost of living. Zero salary is unsustainable and a red flag to investors who want founders making clear-headed decisions. Market salary is wasteful at the earliest stages.

Do I really need a fractional CFO before I have revenue?

Not always. Most pre-revenue startups need solid bookkeeping plus the founder owning the model. A fractional CFO becomes high-leverage when you are raising a priced round, building a hiring plan beyond five people, or pricing a complex product. The ROI is highest at inflection points, not at idea stage.


Share this:

Business budgeting tips for SMBs: CFO strategies for growth

SMB Budgeting Benchmarks

MetricBenchmark
SMBs with a formal annual budget~50% (SCORE / Clutch survey)
Recommended budgeting cycleAnnual + monthly rolling forecast
Acceptable revenue variance vs budget+/- 5%
Acceptable opex variance vs budget+/- 3%
Time to build annual budget (no CFO)40-80 hours
Time to build annual budget (with CFO)20-40 hours, higher quality
Marketing spend as % of revenue (B2B SMB)6-12%
G&A as % of revenue ($1M-$10M SMB)8-15%

Budgeting separates businesses that survive from those that scale. Yet most small and medium-sized business owners treat it as an annual paperwork ritual, filled out in December and forgotten by February. That’s a costly mistake. When cash runs dry unexpectedly, when a major expense hits at the wrong time, or when a growth opportunity requires capital you don’t have, a reactive budget won’t save you. The right budgeting strategies, the kind CFOs use at companies far larger than yours, give you the clarity, agility, and control to make faster decisions with greater confidence.

Table of Contents

Key Takeaways

PointDetails
Use hybrid budgetsCombine a master annual budget with a rolling forecast for maximum agility and accountability.
Prioritize cash flowForecast your cash at least monthly and for a rolling quarter to avoid dangerous shortfalls.
Plan scenariosBudget for conservative, baseline, and aggressive cases—and review actuals versus plan monthly.
Control and benchmark costsApply overhead analysis, selective zero-based budgeting, and monitor industry profitability ratios.
Invest in expertiseConsider specialist CFO guidance or tools to elevate your budgeting process and unlock growth.

Start with the right frameworks: Master budget plus rolling forecast

Once you’ve recognized that budgeting fuels growth, your next task is picking the right high-level structure. Most SMBs rely on a single annual budget, which is better than nothing but leaves major blind spots. The gold standard is a dual-framework approach combining a master budget with a rolling forecast.

A master budget is your full-year profit and loss (P&L) projection. It sets revenue targets, allocates costs across departments, and creates accountability benchmarks. It’s the foundation. A rolling forecast, on the other hand, is always looking 12 months ahead regardless of where you are in the calendar year. Update it monthly or quarterly as real data comes in, and it becomes a living navigation system.

According to budgeting for small business best practices, using a 12-month master budget alongside a continuously updated rolling forecast gives SMBs both a fixed target and the flexibility to adapt when conditions shift. The two tools are not redundant. They serve completely different functions.

The hybrid budgeting approach is widely recognized as best practice: keep annual budgeting for accountability and targets, then layer a rolling forecast on top for ongoing decision support. The annual budget holds your team accountable. The rolling forecast keeps you from being surprised.

Key benefits of each framework:

  • Master budget: Establishes annual revenue targets, aligns department spending, supports investor reporting, and creates benchmarks for performance reviews
  • Rolling forecast: Provides a continuous forward view, supports rapid replanning after market shifts, improves cash flow accuracy, and reduces end-of-year scrambles
FeatureMaster budgetRolling forecast
Time horizonFixed 12-month yearAlways 12 months forward
Update frequencyAnnuallyMonthly or quarterly
Primary purposeAccountability and targetsAgility and decision-making
Best suited forGoal setting, board reportingScenario planning, cash management

Pro Tip: Layer scenario planning directly onto your rolling forecast. Each month, run a best-case, base-case, and worst-case projection. This is what separates reactive managers from strategic ones. Outsourced financial modeling can make this process systematic rather than stressful.

If you’re building financial models from scratch, custom financial modeling gives you the architecture to run both frameworks side by side. Understanding essential financial models helps you choose the right tool for each business question.

Forecast cash flow like a pro: The engine of healthy budgets

With your budgeting frameworks set, the next step is making sure your business never runs out of operational cash. Profitable businesses fail every year, not because they lack revenue, but because cash timing breaks down. You might invoice a client for $80,000 and not collect for 60 days. Meanwhile, payroll, rent, and supplier payments don’t wait.

CFO reviews cash flow statement at meeting table

Cash-flow forecasting is a core CFO-level mechanism, and the most useful time scales for SMBs are monthly and quarterly, particularly the 13-week model. A 13-week forecast maps out every cash inflow and outflow across a 90-day rolling window, updated weekly. It sounds detailed because it is. And that detail is exactly what keeps you from a nasty surprise on the 15th when payroll is due.

Here’s what a simplified cash flow forecast structure looks like:

WeekOpening cashCash in (sales, collections)Cash out (payroll, rent, suppliers)Closing cash
Week 1$120,000$45,000$38,000$127,000
Week 2$127,000$12,000$52,000$87,000
Week 3$87,000$60,000$22,000$125,000
Week 4$125,000$18,000$41,000$102,000

That dip in Week 2 is exactly what you need to see in advance. Without a forecast, you’d find out when the bank account drops below zero.

What to include in every cash flow forecast:

  • All expected cash receipts, including customer payments, loans, and tax refunds
  • Fixed disbursements like rent, payroll, and loan repayments
  • Variable disbursements including inventory, marketing, and contractor payments
  • Lumpy expenses such as quarterly insurance premiums, annual software renewals, or seasonal inventory builds
  • Tax outflows, both quarterly estimated payments and annual settlements

Pro Tip: If possible, connect your forecast directly to your payroll software and point-of-sale or invoicing system. Automated data feeds dramatically improve accuracy and reduce the manual work of updating your 13-week cash flow model every week.

For deeper guidance, explore our cash flow forecasting guide and cash flow management tips built specifically for SMBs navigating growth cycles.

Plan for scenarios and track monthly: Conservative, base, and aggressive budgets

Having a solid cash flow model enables more dynamic, data-driven scenario planning for your business. Scenario-based budgeting is not a luxury reserved for Fortune 500 companies. It’s a critical practice for any business that faces uncertainty, which means every SMB.

The best practice is to build three distinct budget scenarios: conservative (pessimistic), base (most likely), and aggressive (optimistic), then review your actual results against these benchmarks every single month.

How to build each version:

  1. Conservative budget: Assume revenue comes in 15 to 20% below your target. Apply worst-case collection timing. Freeze discretionary spending. This is your floor. If you can survive this scenario, you’re operationally resilient.
  2. Base budget: Use your best estimate of realistic revenue growth, historical cost patterns, and known upcoming expenses. This is your primary management tool.
  3. Aggressive budget: Model what happens if sales exceed expectations by 15 to 25%. What resources would you need? Where would you hire? What capital would be required? This scenario guides your upside planning.

Once your scenarios are live, the discipline is in the monthly review. Pull your actual P&L and cash position at the close of every month, compare them line by line to your budget, and document every meaningful difference. This is called variance analysis, and it’s one of the highest-leverage financial habits an SMB owner can build.

CFO insight: Any variance greater than 10% in a key line item deserves a written explanation. Not as punishment, but as a signal. Variances tell you where your assumptions were wrong and where your business is shifting. Ignoring them is the budgeting equivalent of driving with your eyes closed.

When variances consistently trend in one direction, that’s your data telling you to update your projections. Don’t wait until year-end. Update your financial scenario planning quarterly, or faster if the market is moving quickly.

Control costs and build resilience: Overhead, ZBB, and cash reserves

Proactive scenario planning is only effective if you implement robust cost controls and protect your business against the unexpected. Controlling costs doesn’t mean slashing budgets indiscriminately. It means understanding what’s driving your expenses and making intelligent decisions about where to cut, where to protect, and where to invest.

Overhead is your starting point. These are your non-revenue-generating expenses: rent, utilities, administrative salaries, software subscriptions, and insurance. They don’t disappear when sales drop, which makes them the most dangerous line items in a downturn. Using an overhead rate framework helps you benchmark your overhead as a percentage of revenue and identify where you’re overspending relative to your size.

Cost categoryLow overhead (efficient)Average SMBHigh overhead (at-risk)
Overhead as % of revenueUnder 25%30 to 40%Over 50%
Admin salaries as % of revenueUnder 10%12 to 18%Over 20%
Facility costs as % of revenueUnder 5%7 to 12%Over 15%

Zero-based budgeting (ZBB) is a powerful tool, but it’s often misapplied. ZBB for mid-market firms is most effective as a periodic reset, not an annual exercise for every line item. Use it every two to three years, or when entering a new phase of the business. The concept is simple: start every budget from zero and justify each expense from scratch rather than incrementally adjusting last year’s figures. It forces honest conversations about whether each cost is still earning its place.

For cash reserves, recession-proof budgeting guidance consistently recommends holding at least three to six months of operating expenses in liquid reserves. Many SMBs treat reserves as a luxury. Experienced CFOs treat them as non-negotiable. A business with strong reserves can take calculated risks, absorb a down quarter, and negotiate better terms with suppliers.

Cost-cutting priorities:

  • Discretionary subscriptions and services not tied to revenue generation
  • Underutilized office space or facilities
  • Redundant technology tools with overlapping functions
  • Non-strategic contractor relationships that can be paused

Pro Tip: Never cut costs that directly support customer retention, sales capacity, or your core growth engine. Cutting marketing during a slow quarter might feel disciplined but often accelerates the decline. Protect revenue-generating functions at all costs.

Benchmark budgets: Margins and marketing ratios every SMB should know

Once you have control of your costs, measuring success means benchmarking your key financial ratios and investment levels. Without benchmarks, you have no way to know whether your margins are healthy, your spending is calibrated, or your pricing is right.

The three margin metrics every SMB owner must track:

  • Gross margin: Revenue minus cost of goods sold, divided by revenue. This tells you how efficiently your core product or service generates profit before overhead.
  • Operating margin: Profit after all operating expenses, divided by revenue. This is your business efficiency score.
  • Net margin: What’s left after everything, including taxes and interest. This is your actual profitability.

Operating margin benchmarks vary significantly by sector, so comparing yourself to the right industry peer group matters enormously.

IndustryTypical gross marginTypical net margin
Professional services60 to 75%15 to 25%
Retail30 to 50%2 to 6%
SaaS / technology65 to 85%10 to 20%
Manufacturing25 to 40%5 to 12%
Construction20 to 35%3 to 8%

Marketing spend is equally important to benchmark. The SBA guidance of allocating 7 to 8% of gross revenue to marketing applies specifically to businesses under $5 million in annual revenue. For businesses with tighter margins, this may need to scale down. For high-growth companies in competitive markets, it may need to scale up significantly.

What matters more than the exact percentage is the return you get from every marketing dollar. Track customer acquisition cost, lead-to-close rates, and revenue per channel. Your profit margin analysis should inform your marketing budget, not the other way around.

Why most SMB budgeting advice falls short—and what actually works

Most budgeting content for SMBs pushes one of two extremes: oversimplified templates or rigid theoretical frameworks that ignore how messy real business actually is. Neither approach works when you’re managing payroll for 20 people, chasing three overdue invoices, and evaluating a new market at the same time.

The uncomfortable truth is that a static, set-and-forget budget is worse than no budget at all. It creates false confidence. You built the model in December, it felt solid in January, and by March you’re operating in a completely different reality without realizing it. That gap between your budget and reality widens every week you don’t review it.

What genuinely separates high-performing SMBs from the rest is not the sophistication of their initial budget. It’s the discipline of their ongoing review. The businesses we see thrive are the ones that treat their budget as a live decision framework, updated with actual data, challenged monthly, and connected to their real operations. They don’t fear finding out the budget was “wrong.” They expect it. Every variance is information, not failure.

Building this habit requires structure. Monthly financial reviews should be calendar events, not something that happens when there’s time. Your rolling forecast should be updated the moment a major contract closes, a key hire is made, or a significant expense lands. Scenario planning best practices tell us that the businesses that survive economic downturns aren’t the ones with the best original budgets. They’re the ones that spotted the signals early and adapted fast.

Stop trying to build the perfect budget. Start building the habit of using your budget actively. That’s the CFO-level discipline that actually drives growth.

Take the next step: Strategic CFO solutions for better business budgets

If you’ve read this far, you already know more about strategic budgeting than most SMB owners will ever apply. But knowing and doing are two very different things. Building rolling forecasts, running scenario models, tracking monthly variances, and maintaining cash reserves all require time, discipline, and expertise that most business owners simply don’t have on their own.

https://johngalt-finance.com

That’s exactly where outsourced CFO expertise pays for itself. John Galt Finance works with businesses generating $500K to $20 million in revenue, providing the same financial rigor and strategic oversight that larger companies get from full-time CFOs, without the full-time cost. From building your first rolling forecast to establishing expert cash flow guidance tailored to your industry, we deliver financial clarity that supports every major decision you make. When you’re ready to move beyond spreadsheets and start mastering financial KPIs that actually drive growth, we’re built for exactly that.

Frequently asked questions

What is the difference between an annual budget and a rolling forecast?

An annual budget sets fixed targets for the full year, while a rolling forecast is updated regularly to always look forward 12 months, giving you continuous visibility and greater agility to respond to real conditions.

How much cash reserve should my business keep?

Aim to hold cash reserves covering at least three to six months of operating expenses, giving you a meaningful buffer against revenue dips, unexpected costs, or economic volatility.

What expenses should be cut first when revising a business budget?

Start with discretionary costs that don’t impact customer retention, revenue generation, or core operations. Think unused subscriptions, excess facilities, and overlapping tools before touching anything tied to sales or delivery.

How often should I review actuals versus my budget?

Review budget variances monthly, investigating any deviation of 10% or more in a key line item. Monthly reviews let you course-correct before small discrepancies become major financial problems.

What percentage of revenue should go to marketing?

The SBA recommends allocating 7 to 8% of gross revenue to marketing for businesses under $5 million in revenue, though the ideal allocation depends on your margins, growth stage, and competitive landscape.

FAQ

When should I start building next year’s budget?

Start 90 days before fiscal year end. October for calendar-year businesses. This gives time for department input, two revision cycles, and board approval before January. Last-minute budgets in December produce numbers nobody owns.

How often should I update my budget vs forecast?

The budget is locked annually; the forecast updates monthly. Best practice is a rolling 12-month forecast refreshed every month using actuals plus updated assumptions. See our revenue forecasting guide for the mechanics.

What’s a realistic revenue growth assumption for my budget?

Anchor on your trailing 12-month growth rate, then adjust for known wins (signed contracts, new product) and known losses (lost customers, market headwinds). Avoid “hockey stick” budgets that require 2-3x your historical pace without a funded plan to support it.

How do I handle budget variances during the year?

Investigate any line item more than 5% off budget for two consecutive months. Material variances trigger one of three actions: reforecast, reallocate (cut elsewhere), or accept and document. Don’t quietly absorb variances; they compound.

Should I budget by department or by initiative?

Both. Departmental budgets ensure accountability; initiative budgets (campaigns, product launches, capex) ensure ROI tracking. For SMBs under $5M revenue, a simple P&L by department plus a separate initiative tracker is enough. Larger SMBs benefit from zero-based budgeting on G&A every 2-3 years.

Share this:

The Ultimate Financial Risk Assessment Checklist for SMBs

Financial Risk Assessment Benchmarks

MetricBenchmark
SMBs that have done a formal risk assessment~30% (NFIB survey)
Recommended cash reserve3-6 months of operating expenses
Customer concentration warning threshold>15% of revenue from single customer
Supplier concentration warning threshold>30% of COGS from single supplier
Current ratio (healthy)1.5-3.0
Debt service coverage ratio (banks require)>1.25
Cyber insurance cost (SMB)$1,500-$7,500/year
SMBs that close within 6 months of a major cyber incident60% (US National Cyber Security Alliance)

Even profitable businesses can be blindsided by financial threats they never saw coming. A sudden customer default, a currency swing, or a cash flow gap can unravel months of hard work in a matter of weeks. Research shows that many SMBs lost emergency reserves to unexpected risks, with one in five facing genuine financial shock risk at any given time. This checklist gives you a CFO-level framework to identify, measure, respond to, and monitor the risks that could derail your business before they ever get the chance to.


Table of Contents

Key Takeaways

PointDetails
Follow a proven processUse a 4-step risk assessment with regular reviews to reduce hidden vulnerabilities.
Identify and prioritize risksPinpoint liquidity, credit, market, and operational risks—prioritize those with outsized business impact.
Use practical toolsSimple risk matrices and dashboards are effective for SMEs, so long as monitoring is consistent.
Respond and adaptMitigation actions should be tied to your most critical risks and evolve with quarterly updates.
Don’t ignore edge casesHigh customer concentration or mismatched payment terms can quickly turn from minor to catastrophic without proactive attention.

The CFO-approved 4-step financial risk assessment process

Every solid risk management system follows the same basic architecture: identify, assess, respond, and monitor. This is not a one-time exercise. It is a repeatable, living process that grows sharper each time you run it. Understanding this structure first makes every checklist item below far more actionable.

The standard 4-step process for SMEs breaks down as follows:

  1. Identify all relevant financial risks across your business.
  2. Assess the likelihood and impact of each risk using both numbers and judgment.
  3. Respond by designing targeted mitigation strategies for each priority risk.
  4. Monitor using dashboards, key risk indicators (KRIs), and regular reviews.

Before you can use this checklist effectively, you also need to know the four core risk categories that most SMBs face. Liquidity risk means you cannot meet short-term obligations because cash is tight. Credit risk involves customers or counterparties failing to pay what they owe. Market risk includes interest rate swings, foreign exchange moves, and commodity price volatility. Operational risk covers internal failures: fraud, process breakdowns, and technology failures.

Process stepCore question to askSample action
IdentifyWhat could go wrong financially?Map all cash inflows, debts, and exposures
AssessHow likely and how bad?Score risks on a 1-5 impact and likelihood scale
RespondWhat will we do about it?Assign owners and specific mitigation actions
MonitorIs it getting better or worse?Track KRIs monthly; review full register quarterly

Strong SME financial management steps always link this process to real numbers inside your business rather than generic benchmarks. Following strategic finance best practices means treating this framework as a core business rhythm, not a compliance task.

“Running a quarterly risk review is not a sign of paranoia. It is the single most reliable way to catch a small problem before it becomes a large one. Most businesses that fail were not blindsided by a brand-new risk. They just stopped paying attention to one they already knew about.”

Tracking essential SMB financial metrics at each stage keeps the process grounded in data rather than gut feeling.


Checklist item 1: Pinpoint your core financial risks

With the framework in place, the first real task is building an honest inventory of every significant financial risk your business carries. Most owners underestimate how many there are because they focus only on the most obvious ones.

Here is a working breakdown of the four categories and what they look like in practice:

  • Liquidity risk: You have receivables on paper but no cash in the account when payroll or rent is due. Seasonal businesses and fast-growing companies face this most often.
  • Credit risk: A major customer pays late, pays partially, or stops paying entirely. If you sell on credit terms, this risk is always present.
  • Market risk: A rise in interest rates increases the cost of your variable-rate business loan. A strengthening dollar cuts into revenue from overseas clients. Commodity prices push up your cost of goods.
  • Operational risk: A bookkeeper makes unauthorized transfers. A manual invoicing error creates a $40,000 shortfall. A key supplier fails without notice.

One of the most dangerous and commonly overlooked edge cases is customer concentration risk. Imagine a manufacturing business with five clients, where the largest one accounts for 38% of annual revenue. That single relationship is not just a revenue driver. It is a loaded financial risk sitting at the top of the balance sheet. If that client renegotiates terms, delays payment, or walks, the impact is immediate and severe. This scenario is more common than most business owners want to admit.

Knowing how to address business financial risk mitigation systematically means looking at every client, supplier, and market exposure with the same critical eye.

Businesswoman checks customer list in office

Pro Tip: If any single customer contributes more than 30% of your total revenue, treat that as a high-priority risk right now. Start diversifying your client pipeline before it becomes a crisis. The best time to act on concentration risk is when business is strong, not after that client starts showing signs of trouble.


Checklist item 2: Assess impact, likelihood, and business vulnerability

Once you know what your risks are, the next step is to triage them. Not all risks deserve equal attention or resources. The goal is to separate the genuinely dangerous ones from the background noise.

Here is a simple numbered exercise to score each identified risk:

  1. List every risk from your identification step.
  2. Rate the likelihood it will occur in the next 12 months on a scale of 1 (very unlikely) to 5 (almost certain).
  3. Rate the impact if it does occur, from 1 (minor inconvenience) to 5 (business-threatening).
  4. Multiply the two scores to get a risk priority number.
  5. Focus your time and money on anything scoring 12 or above.

For context on what tools professionals use to do this at scale, key risk assessment methodologies include Value at Risk (VaR), Expected Credit Loss (ECL), stress testing, risk matrices, and KRI dashboards aligned to frameworks like ISO 31000 and COSO ERM. You do not need all of these as a small business. But knowing they exist helps you understand what your accountant or CFO advisor should be doing on your behalf.

ApproachBest forComplexityCost
Risk matrix (2×2 or 5×5)Most SMBsLowNear zero
Scenario analysisBusinesses with seasonal or project-based cash flowsMediumLow
Stress testingDebt-heavy or fast-growing companiesMedium-HighModerate
VaR modelingBusinesses with significant market exposureHighHigh
KRI dashboardAny business with ongoing monitoring needsMediumLow-Moderate

The most actionable insight from quantitative analysis: watch your current ratio and return on equity (ROE) closely. Financial distress research shows that a current ratio below 1.2 or an ROE below 5% predicts financial distress with high accuracy. These are not arbitrary thresholds. They represent real tipping points where the margin for error effectively disappears.

Qualitative assessment matters just as much. Management depth, leadership succession, team skill concentration, and vendor relationship quality all affect your true risk exposure. A business with strong financials but a single founder who holds all client relationships is still carrying significant hidden risk.

Use business stress-testing to model what happens to your numbers under pressure. Combine that with regular tracking of key SMB metrics to build a full picture of where you are most exposed.


Checklist item 3: Action steps and response planning

Identifying and scoring risks is valuable. But it only creates value when it drives action. Response planning is where risk assessment turns into risk management. And there are really only four choices for how to respond to any identified risk.

The four core response strategies:

  • Avoid: Stop doing the activity that creates the risk entirely. If a specific product line generates unpredictable liability with thin margins, discontinuing it removes the risk at the source.
  • Mitigate: Reduce the likelihood or impact of the risk through controls, processes, or financial tools. Tightening your accounts receivable process, requiring deposits, or adding insurance coverage all fall here.
  • Share: Transfer part of the risk to another party. Trade credit insurance, performance bonds, or strategic partnerships can all shift exposure away from your business.
  • Accept: Acknowledge the risk exists and decide to live with it, either because the cost of mitigation outweighs the expected loss or because it is genuinely low priority.

Effective financial risk response for SMBs means building a specific checklist of actions tied to each top risk. Here are examples of what that looks like in practice:

  • Cash flow risk: Implement a 13-week rolling cash flow forecast. Set a minimum cash reserve threshold and trigger automatic review if you fall below it.
  • Accounts receivable risk: Require 30-day payment terms on all new contracts. Flag any invoice past 21 days for immediate follow-up. Consider invoice factoring for clients with poor payment history.
  • Supplier risk: Identify backup suppliers for your top three inputs before you need them. Review supplier financial health annually.
  • Debt covenant risk: Map all financial covenants in your loan agreements against your current ratios quarterly. Engage your lender proactively if you are tracking toward a breach.
  • Fraud and operational risk: Implement segregation of duties for any function involving cash, payments, or inventory. Require dual approval for transfers above a defined threshold.

Following a focused SMB financial planning guide makes it easier to connect each action to your broader business goals rather than treating risk management as a standalone bureaucratic exercise.

Pro Tip: Do not treat response plans as a one-and-done document. Assign an owner to each action, set a due date, and review progress at your quarterly risk meeting. A mitigation that was appropriate six months ago may be obsolete today if your business has changed.


Checklist item 4: Monitor, review, and stress test for hidden threats

The most common failure in risk management is doing the work once and then forgetting about it. Markets shift. Customers change. Debt matures. What was a low-priority risk in January can become a crisis by September if no one is watching. This final step is what separates businesses that manage risk from those that simply document it.

Here is a practical numbered monitoring checklist to run every quarter:

  1. Update your risk register with any new risks that have emerged.
  2. Re-score existing risks to check if likelihood or impact has changed.
  3. Review KRI dashboard metrics against your defined thresholds.
  4. Run at least one stress test scenario against your current cash position.
  5. Check that all assigned mitigation actions are on track.
  6. Report findings to leadership and adjust the response plan if needed.

Building a KRI dashboard does not require expensive software. A well-structured spreadsheet updated monthly is enough to catch most problems early. Here is what to track:

KRI metricWarning thresholdAction trigger
Current ratioBelow 1.5Investigate below 1.2
Days Sales Outstanding (DSO)Above 40 daysReview AR process above 55 days
Cash runwayBelow 90 daysInitiate cost review below 60 days
Customer concentration (top client)Above 25% of revenueDiversification plan above 30%
Gross marginBelow prior quarterInvestigate cost drivers immediately
Debt service coverage ratioBelow 1.3xEngage lender proactively below 1.1x

Quarterly stress tests of extreme scenarios, like a 40% revenue drop in a single quarter or a sudden interest rate spike, sound alarmist until the day they happen. Then they sound like the smartest thing you ever did.

“The businesses that survive genuine financial shocks are almost never the ones with the most cash. They are the ones that already know exactly what they will do when something unexpected hits.”

Tracking all of this through consistent financial dashboards gives leadership real-time visibility into where the business stands. Running regular scenario planning exercises closes the loop by turning monitoring data into forward-looking decisions.


Our perspective: risk management is not about fear, it is about optionality

Most business owners treat financial risk management as a defensive exercise. Something you do to avoid disaster. That framing is understandable, but it misses the bigger picture.

The real value of a well-run risk assessment process is not just that it prevents bad outcomes. It is that it creates the confidence and clarity to make bolder decisions. When you know exactly where your vulnerabilities are and you have plans in place to handle them, you stop second-guessing every strategic move. You can pursue a new contract, take on debt for growth, or enter a new market because you have already thought through the downside.

We have seen this pattern play out consistently with SMBs that treat CFO-level risk work as a growth tool rather than a compliance checkbox. The businesses that move fastest are not the ones ignoring risk. They are the ones managing it well enough to act decisively when the opportunity shows up.

The uncomfortable truth is that most SMBs do not have a risk problem. They have a visibility problem. The risks are already there. They just have not been written down, scored, or assigned to anyone. Fixing that is simpler than most owners expect, and the payoff is immediate.


How John Galt Finance helps you take control of financial risk

Managing financial risk at a CFO level requires consistent attention, the right frameworks, and someone who knows what warning signs actually look like in a real business.

https://johngalt-finance.com

At John Galt Finance, we work with SMBs generating between $500K and $20 million in revenue to build exactly this kind of financial clarity. From financial risk assessments and stress testing to ongoing CFO support and financial modeling, we give your business the financial infrastructure that used to require a full-time hire. If you are ready to stop guessing where your risks are and start managing them with confidence, our team is ready to show you exactly what that looks like for your specific situation.


Frequently asked questions

What are the most common financial risks for SMEs?

Liquidity, credit, market, and operational risks are the four primary categories, covering everything from cash shortfalls and customer defaults to interest rate exposure and internal fraud.

How often should a financial risk assessment be performed?

A quarterly review cycle is the recommended minimum to keep your risk register current and ensure mitigation actions are actually working.

What signals indicate financial distress in a business?

A current ratio below 1.2 or ROE below 5% are two of the most reliable quantitative warning signs that a business is under serious financial strain.

Do small businesses need complex models to assess risk?

No. Simple risk matrices and scenario analysis are sufficient for most SMBs, as long as the process is repeated consistently and not treated as a one-time task.

How should a business respond to high customer concentration risk?

Actively diversify your client pipeline and build contingency plans if any single client exceeds 20-30% of revenue, treating it as a high-priority risk until exposure is reduced.

FAQ

How often should I run a financial risk assessment?

At minimum annually, before budget season. Run an interim assessment any time you have a major change: new product line, large customer win or loss, acquisition, debt refinancing, or macro shock (recession, interest rate change). Most SMBs are over-confident on liquidity and under-confident on customer concentration.

What’s the single biggest financial risk for SMBs?

Customer concentration. If one customer is over 25% of revenue, you don’t own a business; you own a contract. The second biggest is cash flow timing, often masked by profitability. See our article on why profitable businesses go broke.

How much cash should I keep in reserve?

3-6 months of operating expenses for a stable SMB; 6-12 months if revenue is concentrated, seasonal, or project-based. Hold reserves in a high-yield business savings account or short-duration Treasury fund (currently 4-5% yield) so they earn while sitting.

What financial controls reduce fraud risk?

Five essentials: (1) segregation of duties, (2) dual approval on payments over a threshold, (3) monthly bank reconciliations reviewed by someone outside AP, (4) annual review of vendor master list, (5) mandatory vacation for finance staff. See our financial controls guide for implementation.

Should I buy business interruption insurance?

Yes if your business has physical operations or single-site dependency. Premiums run 0.5-2% of insured revenue. The often-overlooked add-on is contingent business interruption (covering supplier or customer disruptions), which paid out heavily during 2020-2021 supply chain shocks.

Share this:

SaaS Pricing Strategy: How to Model for Maximum Revenue

A strong SaaS pricing strategy is the single biggest lever for revenue growth in any subscription business. Price Intelligently’s benchmark studies consistently show that a 1% improvement in monetization drives roughly 12.7% in profit growth — more than acquisition or retention work. Yet most founders pick a number, slap it on a pricing page, and never revisit it. This guide walks you through how to model a SaaS pricing strategy that captures real customer value, scales with your roadmap, and protects margin as you grow.

Table of Contents

Key Takeaways

InsightWhy It Matters
Pricing is the highest-ROI growth lever1% price increase ≈ 12.7% profit growth in mature SaaS
Value metric beats seat countAligns price with customer outcome and scales naturally
Three tiers convert bestMost buyers anchor to the middle option
Test annually, not onceBuyer willingness to pay shifts every 12-18 months
Grandfathering kills marginUse price locks and annual increases instead

SaaS Pricing Fundamentals

Before designing tiers, founders need to understand the four levers behind every SaaS pricing strategy: the pricing model, the value metric, the price point, and the packaging logic. Get one wrong and the entire monetization engine misfires.

Pricing isn’t a marketing exercise — it’s a financial product. Each tier must connect to gross margin, CAC payback, and net revenue retention. We routinely see early-stage SaaS companies leaving 30-50% of recoverable revenue on the table simply because pricing was set by gut rather than modeled.

Cost-plus vs. value-based pricing

Cost-plus pricing — adding margin to your delivery cost — is the wrong starting point for SaaS. Software has near-zero marginal cost; the constraint is willingness to pay. Value-based pricing instead anchors price to the economic outcome you create for the customer (revenue gained, hours saved, risk avoided).

Anchoring and price perception

How a price appears matters as much as the number itself. A $99/month plan looks expensive next to a $29 plan but cheap next to a $499 enterprise tier. Anchoring is why three-tier structures dominate.

Pricing Models Compared

There is no universally “best” SaaS pricing model — each fits different products and buyer types.

ModelHow It WorksBest ForWatch Out For
Per-user (seat)Charge per active userCollaboration tools, CRMCaps growth; users share logins
Usage-basedCharge per API call, GB, transactionInfrastructure, AI APIsRevenue unpredictability
Flat-rateOne price for the productSingle-feature tools, simple SaaSCaps upside per account
Tiered featureBundles of features by planHorizontal SaaSTier creep, confused buyers
HybridBase subscription + usageMature B2B SaaS, AI productsComplexity for buyer
FreemiumFree tier + paid upgradeProduct-led growthSupport cost on free users

The shift toward usage-based pricing

OpenView’s annual SaaS Benchmarks report shows usage-based pricing companies grew 30% faster than pure-subscription peers in 2024. Customers like paying for what they use; vendors capture more from heavy users. AI-native products are accelerating this trend because token consumption is naturally metered.

Choosing the Right Value Metric

A value metric is the unit you charge against. Picked well, it’s the heart of an effective SaaS pricing strategy because it makes price feel fair to the buyer and scales revenue with customer success.

A strong value metric checks three boxes:

  1. Aligned with value: It grows as the customer gets more from your product.
  2. Easy to understand: The buyer can predict their bill.
  3. Tracks usage, not seats: Seats penalize collaboration and cap account growth.

Value metric examples

Product TypeStrong Value MetricWeak Value Metric
Email marketingContacts in listNumber of admins
Project managementActive projectsRead-only users
Help deskTickets resolved / monthSupport agents
AI writing toolWords generatedLogins per month
Payment processorTransaction volumeMerchant accounts

Designing Tiers and Packages

Three tiers — Good, Better, Best — convert better than two or four for most SaaS products. The middle tier should be the one you actually want most customers to buy; price the other two to make it look obvious.

The 3-tier framework

TierPurposeTypical SpreadTarget Segment
StarterAnchor low; capture small accounts$29–$99Solopreneurs, very small teams
Pro (sweet spot)Where 60–70% should land$99–$399Growing SMBs
EnterpriseAnchor high; capture upmarket$500+ or “Contact Sales”Larger teams, custom needs

Feature gating logic

Lock features behind tiers based on which customer segment uses them, not by how hard they were to build. Single sign-on, audit logs, SLA-backed support, and team permissions belong in higher tiers because larger buyers value them. Core workflow features should live in every paid plan; otherwise the entry tier feels broken.

Example: A B2B SaaS case

A workflow automation SaaS we worked with had a single $49/seat plan and ~$8K MRR per logo. We restructured into three tiers ($29 Starter / $79 Pro / Custom Enterprise) priced against “workflows run per month” rather than seats. Within six months: average contract value rose 41%, expansion revenue grew 3x, and overall churn dropped because customers self-selected into the right tier.

Testing and Validating Prices

Most SaaS founders set a price once and freeze it. That’s a mistake — willingness to pay shifts with the market, your feature set, and competitor moves. A mature SaaS pricing strategy includes a structured testing cadence.

The Van Westendorp method

Survey 100-300 customers and prospects with four questions:

  • At what price would this be too expensive?
  • At what price would it be expensive but you’d consider it?
  • At what price would it be a bargain?
  • At what price would it be so cheap you’d doubt quality?

Plot the curves; the intersections give you an acceptable price range and an optimal point. It’s not perfect, but it beats guessing.

Other validation tools

MethodBest ForTime Required
Van Westendorp surveyRange and ceiling discovery2-3 weeks
Conjoint analysisFeature value isolation4-6 weeks
A/B price test on landing pagesConversion-rate impact2-4 weeks
Sales call objection trackingReal-time signal on price resistanceOngoing
Win-loss interviewsWhy deals are won or lost on priceQuarterly

Financial Impact and Modeling

A SaaS pricing strategy isn’t validated until it’s stress-tested against your unit economics. Model the impact of every change against three core metrics: gross margin, CAC payback, and net revenue retention.

The pricing change financial model

MetricBeforeAfter Pricing ChangeImpact
Average Contract Value$5,000$7,500+50%
Win rate22%19%-3 pts
CAC$8,000$8,000flat
Gross margin78%81%+3 pts
CAC payback (months)1511-4 months
NRR108%118%+10 pts

Notice how a small win-rate drop is fine if ACV jumps and payback shortens. That’s the math behind a successful pricing change.

Annual price increases

Build a 5-7% annual price increase into new contracts as a default. Existing customers anchored on old pricing are the biggest source of margin erosion in SaaS. Pair it with clear value communication — what new features, capacity, or support shipped this year. Many of our clients use the framework from our piece on revenue forecasting to model the compounding effect of these adjustments.

Common Pricing Mistakes

Mistake 1: Round-number pricing

$99 outperforms $100 measurably. Sounds small; over thousands of decisions, it compounds. Don’t ignore conventional psychology.

Mistake 2: Too many tiers

Five or six plans look thorough but paralyze buyers. Three is the sweet spot; four is the absolute maximum for self-serve.

Mistake 3: Free trials with no friction

Anonymous credit-card-free trials attract tire-kickers. Either require a card upfront or limit trial length to 14 days. Otherwise customer success drowns in unqualified onboarding.

Mistake 4: Grandfathering forever

When you raise prices, grandfather existing customers for 12 months — not for life. After a year, migrate them to the new plan with proper notice.

Mistake 5: No annual discount

A 15-20% annual discount in exchange for upfront payment dramatically improves cash flow and reduces churn. Customers who pay annually churn at roughly half the rate of monthly subscribers.

Mistake 6: Ignoring margin per tier

Your free or starter tier shouldn’t bleed money. Track gross margin by tier and kill plans where support costs eat the contribution. We cover this discipline in detail in our guide to profit margin analysis.

Implementation Checklist

Use this checklist when designing or revising your SaaS pricing strategy:

  • ☐ Identify the single value metric that scales with customer outcome
  • ☐ Map three tiers with clear “who is this for” labels
  • ☐ Anchor the middle tier — make it the obvious choice for ~65% of buyers
  • ☐ Lock enterprise-only features (SSO, audit logs, SLA) into the top tier
  • ☐ Add a 15-20% annual prepayment discount
  • ☐ Run a Van Westendorp survey before launching
  • ☐ Model the change against ACV, win rate, CAC payback, and NRR
  • ☐ Build a 5-7% annual price increase into new contracts
  • ☐ Track win-loss reasons related to price for 90 days post-launch
  • ☐ Schedule a pricing review every 12 months

If translating these moves into a forecast model is where you’re stuck, this is exactly where a fractional CFO adds value. Book a free consultation to walk through your pricing math.

FAQ

How often should I revisit my SaaS pricing strategy?

Every 12 months at minimum, with quarterly check-ins on win-loss data. Major product launches, competitive moves, or downturns can trigger off-cycle reviews. Customers expect annual pricing adjustments; what they hate is surprise changes mid-contract.

Should I publish prices or hide them behind “Contact Sales”?

For products under $30K ACV, publish. Buyers won’t book a call to discover price; they’ll just leave. Hide enterprise pricing only when you genuinely need discovery to scope. Even then, publish a starting point (“from $X/month”) so buyers self-qualify.

How do I handle existing customers when I raise prices?

Grandfather for 12 months on the prior plan, then migrate with 60 days’ notice. Frame the increase around added value (new features, capacity, support). Offer a one-year price lock in exchange for an annual commitment as a soft landing.

Is usage-based pricing right for my product?

Yes, if your value scales with consumption (API calls, transactions, AI tokens) and customers can predict their usage. No, if usage is lumpy or unpredictable — buyers hate surprise invoices. Hybrid models (base subscription + usage above a threshold) often resolve this.

What’s the right freemium-to-paid conversion rate?

2-5% is industry standard for product-led SaaS. Below 2%, your free tier is too generous or your upgrade triggers are weak. Above 5% is rare and usually signals the free tier is too limited to drive top-of-funnel growth. Strong financial controls help you spot when free-tier costs exceed conversion economics.

Pricing is the highest-leverage financial decision you’ll make as a SaaS founder. Treat it like the strategic exercise it is — modeled, tested, and revisited — and it becomes one of your most reliable growth engines. For more on translating pricing changes into board-ready forecasts, see our pieces on strategic financial planning and EBITDA improvement.

Share this:

Manage cash reserves like a CFO: Step-by-step guide for SMBs

Cash Reserve Management Benchmarks

MetricBenchmark
Recommended operating reserve3-6 months of opex
Recommended reserve for seasonal/project businesses6-12 months
SMBs with less than 1 month cash reserve~50% (JPMorgan Chase Institute)
Median SMB cash buffer days27 days
High-yield business savings yield (2026)4.0-5.0% APY
Treasury bill yield (4-week, 2026)4.5-5.3%
FDIC insurance limit per bank, per ownership category$250,000
Recommended bank diversification at $1M+ reserves2-3 institutions

Most small and medium-sized businesses are operating far closer to the financial edge than their owners realize. Only 28% of small businesses have three or more months of cash reserves, which means the overwhelming majority are one bad quarter, one large unexpected expense, or one slow season away from a genuine crisis. This guide gives you the same framework a CFO would use to build, position, and actively manage your cash reserves so your business stays stable, stays funded, and stays ready to grow.


Table of Contents

Key Takeaways

PointDetails
Set 90-day operating cash minimumMaintaining at least 90 days of reserves is vital for weathering unexpected shortfalls.
Diversify reserve holdingsKeep cash in a mix of high-yield and liquid accounts to maximize earnings and access.
Monitor reserves with key metricsTrack Days Cash on Hand and related metrics every quarter for continuous financial health.
Adjust strategies as your business growsReview and right-size your reserve policies as revenue streams stabilize or new risks emerge.
Leverage forecasting for growthUse forecasting and scenario planning to manage reserves proactively and unlock new opportunities.

Why managing cash reserves matters for SMBs

Cash reserves are not the same as profit. They are the readily available funds your business can access immediately to cover operating expenses without taking on debt, delaying payroll, or missing vendor payments. Think of them as the oxygen supply for your operations. You don’t think about them until they’re running low, and by then you’re already in trouble.

The numbers are sobering. Average SMB cash reserves sit at just 27 days, while best-in-class businesses maintain 90 or more days of runway. Financial experts recommend that micro and small businesses target three to six months of operating costs held in liquid form. That’s not a conservative suggestion. It’s the floor.

Reserve levelDays cash on handRisk profile
DangerousUnder 30 daysHigh likelihood of disruption
Marginal30 to 60 daysVulnerable to seasonal shifts
Stable60 to 90 daysAdequate buffer for most events
Best-in-class90+ daysPositioned for stability and growth

Why does this matter so much for SMBs specifically? Because larger businesses have easier access to credit lines, investor capital, and institutional relationships that smooth out cash gaps. You don’t always have those same options on short notice. Your reserves are your credit line. And building them properly requires a deliberate, CFO-level approach.

Key reasons cash reserves protect your business:

  • They cover payroll, rent, and fixed costs during revenue dips
  • They allow you to negotiate better payment terms with suppliers (paying on time or early earns discounts)
  • They prevent panic-driven decisions like taking high-cost emergency loans
  • They signal financial credibility to lenders and potential investors

That said, idle cash carries real opportunity costs. Money sitting in a non-interest-bearing account is silently losing value to inflation. The goal, as outlined in cash flow management tips for growing businesses, is not to hoard but to optimize. More on that in a moment.

“A liquidity buffer isn’t just a safety net. It’s a strategic asset that gives you freedom to act, not just survive.” That’s the mindset that separates reactive SMBs from proactive ones.

The key financial metrics for SMBs you need to track begin with Days Cash on Hand (DCOH). This is calculated by dividing your available cash by your average daily operating expenses. If that number is below 60, your first priority is to build it up before anything else.


Setting the right cash reserve target for your business

Not every business needs the same cushion. Your optimal reserve level depends on three factors: industry volatility, business size and stage, and seasonal revenue patterns. A construction firm with irregular contract revenue needs a different buffer than a SaaS company with predictable monthly subscriptions.

Here’s a practical three-bucket framework used at the CFO level:

  1. Operating minimum (90 days): Non-negotiable. This is your baseline survival fund. Every business should build toward this before tackling anything else.
  2. Stability buffer (up to 180 days): Appropriate for businesses in volatile industries, those with irregular receivables, or companies going through rapid change such as hiring surges or product launches.
  3. Growth pool (beyond 180 days): Excess cash beyond your stability buffer that should be actively reinvested rather than left idle. Options include equipment upgrades, market expansion, or paying down high-cost debt.

For seasonal businesses, this framework is especially critical. 82% of business failures trace back to cash flow problems, and seasonal SMBs are disproportionately at risk if they don’t budget peak-season surpluses to fund slow periods. A summer-focused retail business that spends all its August profits on inventory by October is gambling on a perfect Q4.

ApproachReserve targetBest suited for
Conservative150 to 180+ daysVolatile industry, irregular revenue
Balanced90 to 120 daysStable sector, predictable cash flows
Dynamic60 to 90 days + active reinvestmentHigh-growth stage, strong credit access

Conservative reserves of 180+ days make sense for industries where revenue is unpredictable, but they do signal idle capital if held too long without strategy. The dynamic approach reinvests excess for growth while protecting that essential 90-day core. Neither approach is wrong. The mistake is picking one and never revisiting it.

Pro Tip: Set a specific dollar amount as your reserve floor, not just a percentage. If your monthly operating costs are $80,000, your 90-day target is $240,000. Write that number down. Make it visible. It becomes your financial north star.

As part of your strategic finance for SMBs planning, revisit your reserve targets every time a significant change happens in your business: a new major client, a lost contract, a new hire, a market shift. Your cash needs in year three look nothing like they did in year one.


Where to hold and optimize cash reserves

Once you know how much to hold, the next question is where. Keeping everything in your operating checking account is like storing your emergency fund under the mattress. Safe? Maybe. Smart? No.

Entrepreneur opens business savings account at bank

A tiered approach is the CFO standard. Operational reserves belong in high-yield savings accounts or short-term Treasury bills, with excess swept into money market accounts that offer both liquidity and yield. This structure means your cash is working harder without sacrificing access when you need it.

Best practices for holding your reserves:

  • Tier 1 (immediate access, 30 days of expenses): Business checking or high-yield savings account at an FDIC-insured institution
  • Tier 2 (short-term yield, 30 to 90 days): High-yield savings, Treasury bills with 90-day maturities, or government money market funds
  • Tier 3 (medium-term, 90 to 180 days): Short-duration bond funds, CDs with early withdrawal options, or sweep accounts

Diversification across institutions also matters. FDIC coverage caps at $250,000 per depositor per institution. If your reserves exceed that, split them across multiple banks rather than leaving yourself partially unprotected.

As part of your working capital optimization strategy, review your holding structure quarterly. Interest rate environments change, and what earned you a solid yield last year may be underperforming today. Don’t set it and forget it.

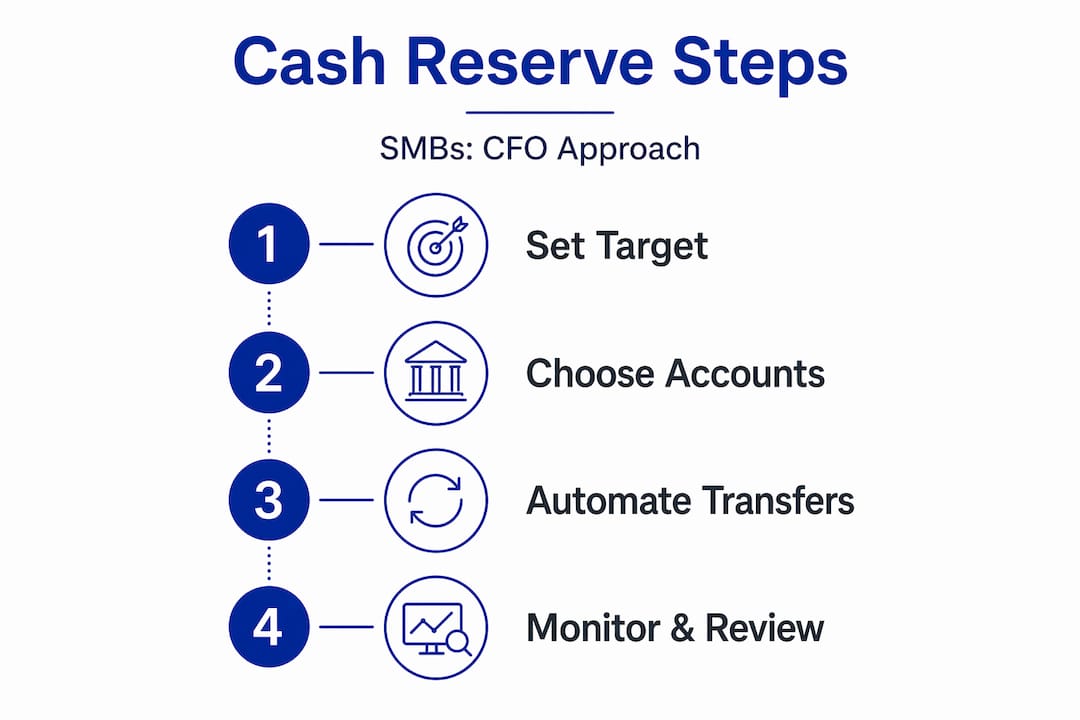
Pro Tip: Automate a monthly sweep from your operating account to your Tier 2 reserve account. Even a small, consistent transfer builds the habit and the balance simultaneously.


Monitoring, managing, and mobilizing your reserve

Having a reserve is not enough. You need a system for monitoring it, clear rules for deploying it, and a process for replenishing it after you do.

Start by assigning ownership. Appointing a dedicated working capital leader inside your business, whether that’s your controller, your CFO, or an outsourced finance partner, ensures this doesn’t fall through the cracks. Whoever owns cash management should be tracking more than just the bank balance. They need to watch granular metrics like WADC (Weighted Average Days Cash) and WAT (Working Asset Turnover), not just the standard DSO, DPO, and DIO ratios.

The sobering reality: US SMBs with revenues under $300 million carry an average Cash Conversion Cycle of 120 days, and small firms hold 20 to 30% more cash than they need due to poor visibility into their own financials. That excess cash isn’t protecting you. It’s a sign your reporting isn’t sharp enough.

A simple reserve monitoring process:

  1. Calculate DCOH weekly during volatile periods, monthly during stable ones
  2. Set a trigger point (e.g., DCOH drops below 60) that automatically prompts a financial review
  3. Track your Cash Conversion Cycle monthly to spot collection or payment delays early
  4. Create a “reserve health dashboard” with three metrics: current DCOH, target DCOH, and variance
  5. Review your replenishment plan if reserves are deployed, with a clear timeline to rebuild

When should you deploy reserves? Three legitimate triggers exist: a planned seasonal slowdown you’ve modeled in advance, an unexpected but essential expense (equipment failure, legal costs), or a defined growth opportunity with measurable ROI. Emotional decisions (“things feel tight”) are not a deployment trigger. That’s what the system protects you against.

“The moment your cash reserve feels optional is the moment you’ve already lost control of your financial posture.”

The working capital management system you build now creates the habits that keep you solvent when others in your industry are scrambling.


Infographic showing cash reserve management steps

CFO-level tips: Advanced moves and common mistakes

Once your foundation is solid, advanced strategies can meaningfully improve both the size of your reserves and the speed at which you build them.

Instant payments accelerate inflows and reduce SMB reliance on credit lines, with many high-urgency businesses now willing to pay small fees to access funds immediately rather than waiting standard settlement times. If your business regularly waits two to five days for payments to clear, instant payment rails can functionally add days to your cash on hand without changing your reserve balance at all.

Advanced CFO strategies for reserve optimization:

  • Build rolling cash flow forecasting models covering three to twelve months across base, upside, and downside scenarios
  • Incentivize early accounts receivable payments with 1 to 2% early payment discounts. These are far cheaper than the cost of borrowing if you run short
  • Negotiate extended payment terms with key vendors, especially on non-time-sensitive orders
  • Audit your AP and AR cycles quarterly to find hidden cash sitting in delays
  • Use scenario planning to stress-test what happens if your top client delays payment by 60 days or if a key cost doubles

The most common mistakes we see, outlined in detailed steps to improve cash flow, are over-optimism on receivables, no formal cash review schedule, and treating reserves as a slush fund rather than a protected asset class.

Pro Tip: Create a “cash reserve policy” document, even a one-pager, that defines your target DCOH, your holding structure, your deployment triggers, and your replenishment timeline. Share it with anyone who touches your finances. Clarity prevents costly improvisation.


Where most SMBs go wrong—and how to outsmart the average

Here’s the uncomfortable truth: most advice about cash reserves treats the target as a fixed destination. “Build three to six months and you’re done.” That framing is wrong, and it leads smart business owners to make expensive mistakes in both directions.

Small firms actually hold proportionally higher cash in their early years but reduce reserves as they grow and their cash flows become more predictable. That’s not irrational. It reflects improving operational maturity and better visibility. The problem is when businesses don’t consciously manage that evolution. They either hold too much (missing reinvestment opportunities) or too little (walking into a liquidity crisis).

The best-run SMBs we’ve worked with treat their cash reserve target the way a pilot treats altitude. Not as a destination but as a constantly adjusted variable based on current conditions, upcoming turbulence, and where they’re trying to land. They review their models quarterly, they update their scenarios when conditions shift, and they never confuse “we haven’t needed our reserves yet” with “we don’t need reserves.”

Over-hoarding is just as dangerous as under-saving. Cash sitting idle at 2% in a savings account while your business could earn 20% ROI on a well-priced equipment investment isn’t safety. It’s avoidance. Meanwhile, businesses that chase every growth opportunity without protecting their operational minimum end up borrowing at 15 to 30% interest to cover gaps that $40,000 in reserves would have prevented entirely. Neither extreme reflects disciplined financial leadership.

The benchmark for great is not a number. It’s a system. Build the model, set the targets, review them regularly, and adjust based on real data from your finance best practices perspective. That’s what separates the 28% with strong reserves from the rest.


Ready to optimize your cash reserves? Partner with pro-level finance solutions

Managing cash reserves with precision isn’t something that happens by accident. It requires the right model, the right metrics, and the right guidance applied specifically to your business.

https://johngalt-finance.com

At John Galt Finance, we specialize in giving SMBs access to exactly this kind of expertise without the cost of a full-time CFO. Our team builds custom financial planning for business models that show you exactly where your reserves stand today and what they need to look like six to twelve months from now. We pair that with hands-on cash flow forecasting solutions and scenario planning so you’re never caught off guard. Whether you’re building your first formal reserve strategy or optimizing an existing one, our strategic finance growth guide resources and advisory team are ready to help you move from reactive to fully in control.


Frequently asked questions

How often should a small business review its cash reserves?

You should review cash reserves at least quarterly, or more frequently if your business is in a high-growth phase, navigating a downturn, or experiencing significant seasonal swings in revenue.

Is it better to keep all reserves in one account for simplicity?

No. Diversifying across tiered accounts, including high-yield savings and short-term instruments, balances yield, risk, and accessibility far better than a single account can.

What’s the biggest mistake SMBs make with cash reserves?

The most common mistake is holding too little cash as a buffer, with only 28% of small businesses maintaining three or more months of reserves, leaving most businesses dangerously exposed to even moderate disruptions.

How do instant payments affect reserve management?

Instant payments accelerate inflows and reduce dependence on credit lines, effectively improving liquidity without requiring you to hold a larger cash balance.

What metrics should I monitor for optimal reserve management?

Track Days Cash on Hand, Cash Conversion Cycle, and early warning indicators like rising DSO or falling collections rates. Dedicated working capital metrics such as WADC and WAT give you sharper visibility than basic ratios alone.

FAQ

How much cash should my business actually keep on hand?

Calculate average monthly operating expenses, then multiply by 3-6 for a stable business or 6-12 for a seasonal, project-based, or customer-concentrated one. If you have debt service, add one quarter’s principal-and-interest payments on top of that baseline.

Where should I park business cash reserves?

Tiered approach: 1 month opex in operating checking, next 2-3 months in a high-yield business savings (currently 4-5% APY), beyond that in laddered Treasury bills (4-week to 13-week). Avoid CDs longer than 6 months; the liquidity penalty rarely justifies the marginal yield.

What’s the risk of keeping all cash in one bank?

FDIC insurance covers $250k per ownership category per bank. After Silicon Valley Bank in 2023, treasury teams routinely spread reserves across 2-3 banks once balances exceed $500k. ICS (Insured Cash Sweep) accounts can extend coverage to millions in one operational account.

How do I build cash reserves without slowing growth?

Three levers: (1) tighten DSO by 5-10 days through better collections, (2) negotiate longer DPO with key suppliers, (3) automatically sweep 5-10% of monthly revenue into a reserve account. See our working capital optimization guide for the mechanics.

When can I distribute excess cash to owners?

After meeting three tests: (1) cash reserve target hit, (2) debt covenants comfortably met, (3) next 12 months of planned capex funded. Distributions ahead of these tests are the #1 reason “profitable” SMBs hit liquidity crises in downturns.

Share this:

Restaurant Financial Management: Food Cost & Labor Guide

Running a restaurant is one of the toughest businesses in the world. Margins are thin, costs move daily, and a single bad month can wipe out a quarter of profit. Effective restaurant financial management is what separates operators who survive from those who scale. In this guide, we break down food cost, labor cost, and profit margin benchmarks that successful restaurants use to stay healthy — plus the dashboards, formulas, and habits that keep owners in control.

Table of Contents

Key Takeaways

InsightWhat It Means for Your Restaurant
Prime cost should stay under 60-65% of salesAbove 65% and profitability collapses fast
Food cost target: 28-32%Track weekly, not monthly — recipes drift
Labor cost target: 25-30%Use sales-per-labor-hour, not just dollars
Healthy net profit: 5-15%Quick-service averages 6-9%, fine dining 10-15%
Weekly P&Ls beat monthly closesYou catch margin leaks in 7 days, not 30
Inventory variance over 1% = red flagIndicates theft, waste, or portion drift

Why Most Restaurants Fail (And It’s Not the Food)

Industry data consistently shows that roughly 60% of independent restaurants close within their first year, and 80% within five. The popular narrative blames bad food or bad location, but operators who have closed multiple concepts will tell you the truth: most restaurants fail because of poor restaurant financial management. The kitchen can be brilliant and the dining room packed, yet the business still bleeds cash because nobody is tracking the right numbers at the right frequency.

Three patterns explain the majority of restaurant failures:

1. Monthly accounting in a daily-cost industry

Restaurants run on perishable inventory, shift-based labor, and same-day pricing pressure. Closing the books once a month is far too slow. By the time you spot a 3-point margin drop in your March P&L, you have already lost 30 days of profit you cannot recover.

2. Confusing cash in the bank with profit

A busy Friday deposit feels like winning. But that cash includes tomorrow’s payroll, next week’s food order, and the sales tax you owe the state. Profitable-looking restaurants regularly go bankrupt because their owners spent operating cash that was never theirs to keep.

3. No prime cost discipline

Owners obsess over occupancy, marketing, and decor, while their two biggest expenses — food and labor — drift up 2-3 points per quarter unnoticed. On a $1.2M restaurant, every single point of prime cost is $12,000 of pre-tax profit walking out the back door.

The 7 Core Metrics in Restaurant Financial Management

If you only track seven numbers in your restaurant, make them these. Every successful operator we work with reviews this scorecard weekly.

MetricFormulaHealthy Range
Food Cost %COGS ÷ Food Sales28-32%
Beverage Cost %Beverage COGS ÷ Beverage Sales18-24%
Labor Cost %Total Labor ÷ Total Sales25-30%
Prime Cost %(COGS + Labor) ÷ Sales55-65%
Sales per Labor HourSales ÷ Labor Hours$60-$90
Average CheckSales ÷ CoversTrend up YoY
Net Profit MarginNet Income ÷ Sales5-15%

These are not academic. They are the same numbers a competent CFO would build into your weekly flash report. If you want a deeper view of how dashboards bring this together, our guide to a financial dashboard for business owners shows the structure operators rely on.

Food Cost: The 28-32% Rule and How to Hit It

Food cost percentage is the foundation of restaurant financial management. The standard formula is simple:

Food Cost % = (Beginning Inventory + Purchases − Ending Inventory) ÷ Food Sales

Most concepts target 28-32%. Pizza and high-volume QSR can run 25-28%. Steakhouses and premium seafood often sit at 34-38% because their menu mix demands expensive proteins. The number itself matters less than your consistency against your own benchmark.

Why food cost drifts (and how to stop it)

Food cost rarely jumps in one move. It creeps up half a point at a time until a quarter goes by and you are suddenly at 36%. The usual culprits:

  • Recipe drift — line cooks over-portion proteins, dressings, and cheese during rushes
  • Spec changes from suppliers — your distributor swaps in a higher-priced chicken and never says a word
  • Waste — improperly stored produce, over-prep, and trim that should be reused
  • Theft — voids, comps, and back-door losses
  • Menu mix shifts — guests order more of your high-cost items than you forecasted

The weekly inventory habit

Monthly inventory hides problems. Weekly inventory exposes them while you can still fix them. A 30-minute Sunday-night count, plugged into a simple spreadsheet or POS module, gives you a real-time food cost trendline. When you see beef rise from 32% to 34% in week two, you can investigate before week four turns it into a $7,000 hole.

Labor Cost: Scheduling, Productivity, and the 30% Ceiling

Labor is the second leg of prime cost and the metric most owners feel guilty optimizing. The honest truth is that labor cost above 30% of sales is almost always a scheduling problem, not a wage problem. Operators who staff to forecasted sales — not to “what we always do on Saturdays” — protect their margins without underpaying their team.

From dollars to sales-per-labor-hour

Tracking labor in dollars alone is misleading because a wage increase will mathematically inflate your labor cost percentage even if productivity holds steady. The better metric is Sales per Labor Hour (SPLH):

SPLH = Total Sales ÷ Total Labor Hours

A casual dining concept doing $65/hour SPLH is healthy. Below $50, you are overstaffed or under-selling. Above $90, you are at risk of service breakdowns and turnover. Build a weekly SPLH report by daypart — Monday lunch and Saturday dinner are completely different businesses.

The schedule-to-forecast loop

The discipline that separates healthy restaurants:

  1. Forecast daily sales for the upcoming week based on last 4-week and prior-year trends
  2. Build labor schedules to a target SPLH for each daypart
  3. Compare actual vs. forecast every morning — adjust same-day if a shift is off pace
  4. Review week-end actual hours vs. scheduled hours by manager

If you are operating multiple locations, this is exactly the kind of weekly cadence a fractional CFO installs. Our payroll cost management guide covers the broader picture beyond hourly scheduling.

Prime Cost: The #1 KPI Restaurant Owners Ignore

If you only track one number in your restaurant, make it prime cost.

Prime Cost = COGS + Total Labor (including taxes and benefits)

Prime Cost % = Prime Cost ÷ Total Sales

Prime cost captures the two expense categories the operator actually controls. Rent, utilities, and insurance are largely fixed in the short term — you cannot cut your way out of them this week. But food and labor combined are typically 55-65% of sales and move every single day.

The 60-65% rule

Prime Cost %What It Means
Under 60%Excellent — strong profit and pricing power
60-65%Healthy — most successful full-service restaurants
65-70%Warning zone — net profit likely under 5%
Over 70%Crisis — operator likely losing money every week

The 1% rule for action

If prime cost moves more than 1 point against you week-over-week, treat it as an event. Pull invoices, review the schedule, count inventory again. Restaurants that consistently outperform are not the ones with no problems — they are the ones who catch problems in seven days instead of thirty.

Profit Margins: What Healthy Looks Like by Concept

“What net margin should I be hitting?” is one of the most common questions we get from restaurant owners. The honest answer depends entirely on your concept, location, and ownership structure.

Concept TypeTypical Food CostTypical Labor CostHealthy Net Margin
Quick-Service / Fast Casual28-32%25-28%6-9%
Casual Dining30-34%28-32%5-8%
Pizza20-28%22-28%8-12%
Bar / Pub30-35% food, 20-24% beverage22-28%10-15%
Fine Dining32-38%30-35%10-15%
Coffee Shop / Cafe25-32%28-32%8-12%

Notice that fine dining has higher food and labor costs, yet still earns a healthier margin. Why? Higher check averages, premium positioning, and lower rent-per-cover. Margin is a function of your entire P&L, not just prime cost.

Cash Flow and Weekly P&L Discipline

Profitable restaurants close every week, not every month. The discipline is simple but rare:

  • Friday cash count — reconcile every drawer, deposit, and tip pool
  • Saturday inventory snapshot — by category at minimum, ideally key items
  • Sunday P&L — sales, food cost, labor cost, prime cost, vs. budget and prior week
  • Monday review — manager meeting, action items, schedule tweaks

This weekly rhythm catches problems while they are still cheap to fix. Owners who insist they “don’t have time” usually find they have plenty of time for the crisis that arrives three months later. For a deeper look at this discipline, see our piece on 13-week cash flow forecasting, which is the model most restaurant CFOs run alongside the weekly P&L.

Watch your sales tax and tip liability

One brutal cash trap: sales tax collected from guests is not your money. Tip pools and credit card tip distributions belong to staff. Restaurants regularly fail because operators treated these balances as available working capital. Sweep them into a separate account every Monday and pay them on schedule.

Building a Restaurant Financial Dashboard

An effective restaurant dashboard fits on one screen. It should answer five questions in under 30 seconds:

  1. How did sales compare to forecast this week?
  2. Where is food cost trending vs. target?
  3. Where is labor trending vs. target?
  4. What is prime cost vs. last 4 weeks?
  5. What is my cash position and 4-week forecast?

You do not need expensive software to start. A weekly spreadsheet pulling POS sales, payroll hours, and invoice totals is enough for a single location. Once you scale past two locations, a proper restaurant analytics platform like R365, MarginEdge, or Restaurant365 starts to pay for itself.

Monthly Financial Health Checklist

Run this checklist on the first Monday of every month:

  • ✅ Weekly P&Ls reconciled and reviewed
  • ✅ Inventory variance under 1% of food cost
  • ✅ Prime cost within 1 point of target
  • ✅ Sales-per-labor-hour reviewed by daypart
  • ✅ Average check trending up or flat (not down)
  • ✅ Sales tax and tips reconciled and paid
  • ✅ Supplier invoices matched to purchase orders
  • ✅ Comps, voids, and discounts under 3% of sales
  • ✅ Cash bank balance covers 6-8 weeks of operating expenses
  • ✅ Manager bonus targets tied to prime cost, not just sales

If you cannot tick at least eight of these every month, your restaurant is operating on hope rather than discipline. Book a free consultation if you want help building this rhythm into your operation.

FAQ

What is a good food cost percentage for a restaurant?

For most full-service concepts, 28-32% is healthy. Pizza and high-volume QSR can run 25-28%. Steakhouses and seafood concepts often sit at 34-38%. The key is consistency against your own benchmark, tracked weekly rather than monthly.

What is the most important financial metric for a restaurant?

Prime cost — the sum of cost of goods sold and total labor cost as a percentage of sales. It captures the two largest variable expenses you actually control. Healthy operators keep prime cost between 55% and 65% of sales.

How often should I review my restaurant’s financials?

Sales, labor, and food cost should be reviewed daily and reconciled weekly. A full P&L should be produced weekly, not monthly. Monthly closes are too slow for a business where ingredients spoil and shifts are scheduled in real time.

What’s a healthy profit margin for an independent restaurant?

Net profit margins of 5-10% are typical for casual and quick-service concepts. Fine dining, bars, and well-run pizza concepts can reach 10-15%. Anything consistently under 5% signals a structural problem in prime cost, pricing, or rent.

Do I need a CFO for my restaurant?

Most independent operators do not need a full-time CFO, but they do need CFO-level financial discipline. A fractional CFO can install weekly P&Ls, prime cost tracking, and cash forecasting for a fraction of the cost of a senior hire — typically with a 3-6 month payback from margin improvement alone.

Share this:

Financial analysis for SMBs: unlock real growth

Financial Analysis Benchmarks for SMBs

MetricBenchmark
Gross margin (B2B services SMB)40-60%
Gross margin (SaaS)70-85% (Bessemer)
EBITDA margin (mature SMB)10-20%
Current ratio (healthy)1.5-3.0
Quick ratio (healthy)>1.0
Debt-to-equity ratio (healthy SMB)<2.0
Return on equity (top quartile SMB)>15%
Revenue per FTE (services SMB)$150,000-$300,000

Your income statement and balance sheet tell you what happened. They don’t tell you why it happened, what’s coming next, or what you should do about it. Too many small and medium-sized business (SMB) owners mistake financial reporting for financial analysis, and that gap costs them real money. Financial analysis in SMBs involves systematic examination of financial statements to enable data-driven decisions for growth and stability. This guide breaks down the key techniques, benchmarks, and real-world results that separate businesses that react from businesses that grow.

Table of Contents

Key Takeaways

PointDetails
Beyond basic reportsTrue financial health requires analysis, not just tracking revenue or expenses.
Context is criticalInterpreting ratios properly means comparing trends and benchmarks for your industry.
Expert help drives resultsOutsourced CFOs and financial pros can close knowledge gaps and enable smarter decisions.
Benchmarks are guidelinesFinancial benchmarks vary by sector and should not be applied without context.
Analysis powers growthApplying robust financial analysis strategies directly supports SMB growth and resilience.

Why financial analysis matters for SMBs

Most SMB owners look at their financials once a month, scan the bottom line, and move on. That’s reporting. Analysis is something entirely different.

Financial reporting organizes your numbers. Financial analysis interrogates them. It asks: Is your gross margin shrinking quarter over quarter? Are customers paying slower than last year? Is your cash position healthy enough to survive a 90-day revenue dip? SMBs that systematically examine income statements, balance sheets, and cash flow statements to evaluate profitability, liquidity, financial health, and operational efficiency are the ones that catch problems early and capitalize on opportunities faster.

The business outcomes are concrete:

  • Better decisions: You stop guessing and start acting on evidence
  • Faster growth: You identify which products, customers, or channels drive real margin
  • Greater resilience: You build cash buffers before you need them, not after
  • Stronger investor confidence: Lenders and investors trust businesses that understand their own numbers

“Gut instinct built your business. Data will scale it. The owners who combine both are the ones who survive economic downturns and come out stronger.”

The risk of skipping analysis is real. A business running on gut instinct might feel profitable while quietly bleeding cash. Inventory builds up. Receivables age. Margins erode by two points per quarter. None of that shows up as an alarm on a basic P&L. That’s exactly why understanding the need for CFO services is growing among SMBs that want to compete seriously.

Core financial analysis methodologies every SMB should use

Business owner checking printed financial statements

There are four core methodologies every SMB owner should know and apply regularly. Each one answers a different question about your business.

Ratio analysis measures relationships between line items. Your current ratio (current assets divided by current liabilities) tells you whether you can pay short-term bills. Your gross margin ratio tells you how efficiently you convert revenue into profit before overhead. Key methodologies include ratio analysis covering current ratio, quick ratio, debt-to-equity, gross margin, return on equity (ROE), and return on assets (ROA), alongside trend analysis, variance analysis, flux analysis, and benchmarking against industry standards.

Trend analysis tracks the same metric over multiple periods. A gross margin of 38% looks fine in isolation. A gross margin that has dropped from 44% to 38% over six quarters tells a completely different story about pricing pressure or rising input costs.

Infographic showing key SMB financial analysis methods

Variance analysis compares actual results to your budget or forecast. If you budgeted $180,000 in revenue for Q2 but only hit $152,000, variance analysis forces you to explain the gap. Was it one lost client? A delayed project? A pricing issue? Without this discipline, the same miss happens again next quarter.

Benchmarking compares your metrics against industry standards or competitors. It answers the question: Is our performance normal, or are we leaving money on the table?

MethodologyWhat it answersHow often to run
Ratio analysisAre we financially healthy right now?Monthly
Trend analysisAre we improving or declining over time?Quarterly
Variance analysisAre we hitting our plan?Monthly
BenchmarkingHow do we compare to our industry?Annually or semi-annually

A common SMB pitfall is relying on a single ratio from a single year and drawing big conclusions. One good current ratio doesn’t mean you’re liquid. One strong revenue quarter doesn’t mean your business model is working. Context is everything. Always layer your SMB financial metrics across time periods and industry comparisons before making strategic moves.

Pro Tip: Run a simple actual vs. budget variance report every month. Even a basic spreadsheet that flags line items more than 10% off budget will surface issues before they become crises.

Benchmarks and what “good” looks like: decoding industry standards

Benchmarks are useful reference points, not gospel. Understanding what typical SMB numbers look like gives you a starting point for interpretation, but your industry, business model, and growth stage all change what “healthy” actually means for your company.

Here’s a snapshot of common SMB financial benchmarks to use as a baseline:

MetricSMB benchmarkWhat it signals
Finance function cost1.2% to 3.5% of revenueOverhead efficiency
Current ratio (EU SME avg)1.28Short-term liquidity
Quick ratio0.84Immediate liquidity without inventory
Gross margin32%Core profitability before overhead
Net profit margin2.8%Bottom-line efficiency
Days Sales Outstanding (DSO)48 daysReceivables collection speed

These benchmark figures for SMBs cover finance function costs, current ratio, quick ratio, gross margin, net profit margin, and DSO, giving owners a concrete starting point for comparison.

But here’s where most business owners go wrong: they see a quick ratio of 0.84 and assume they’re fine because it’s “average.” Average in a sector with predictable monthly contracts looks very different from average in a project-based business where revenue arrives in lumps. A software-as-a-service company with 0.84 might be perfectly healthy. A construction firm with the same number might be one delayed payment away from a payroll crisis.

Key things to watch when interpreting benchmarks:

  • Your cash conversion cycle: How long does it take to turn inventory or services into cash? A longer cycle demands a higher current ratio buffer.
  • Seasonality: A retailer’s quick ratio in January looks terrible compared to December. That’s normal.
  • Growth stage: Fast-growing businesses often have thinner margins and tighter ratios because they’re reinvesting aggressively.
  • Customer concentration: If 40% of your revenue comes from one client, your financial risk profile is very different from a business with 200 small customers.

Single metrics lack context, so always use trend analysis and industry-specific benchmarks together to avoid misinterpretation. Tracking your own trends over 12 to 24 months is often more revealing than any external benchmark. Understanding how to interpret these numbers is core to mastering financial KPIs that actually drive business decisions.

How financial analysis drives real SMB results

Theory is useful. Numbers that change real businesses are better. Here’s what happens when SMBs move from basic reporting to genuine financial analysis.

  1. A $12M manufacturer improved cash runway by 73%. By analyzing their working capital cycle and identifying where cash was trapped in inventory and slow receivables, they restructured payment terms with both suppliers and customers. The result: 73% improvement in cash runway, 18% reduction in customer acquisition cost, and a 7-point improvement in payroll efficiency. None of that was visible on a standard monthly P&L.
  2. A fractional CFO saved $2M in cash and grew margins by 15%. An SMB brought in outsourced CFO support after struggling to understand why revenue was growing but cash wasn’t. The analysis revealed a mismatch between billing cycles and expense timing, plus a product line with negative contribution margin that was masked by overall revenue growth. Fixing both saved $2M in cash and drove a 15-point margin improvement.
  3. A loss-making business turned a 9% profit margin. Through detailed variance and segment analysis, a services business discovered that two client types were profitable and three were actively destroying margin. Refocusing on the right clients and repricing the rest turned losses into a 9% profit margin.

These aren’t outliers. They’re what happens when analysis replaces assumption.

The trigger for bringing in outside expertise is usually one of these situations:

  • Revenue is growing but cash is always tight
  • Margins feel inconsistent and you can’t explain why
  • You’re preparing for a funding round or acquisition
  • Your bookkeeper gives you reports but no interpretation
  • You’ve had one or two financial surprises that cost you badly

SMBs are often overconfident in their financial preparedness despite thin reserves, and outsourcing bridges the expertise gap for growth-stage firms that can’t justify a full-time CFO salary. A fractional CFO guide can help you understand exactly what that support looks like in practice, and how businesses use it to solve cash flow management struggles before they become emergencies.

Pro Tip: If you’ve had even one financial surprise in the past 12 months that you didn’t see coming, that’s your signal. A single blind spot in your analysis can cost more than a year of outsourced CFO fees.

Why most SMB financial analysis falls short—and how to do better

Here’s the uncomfortable truth we see repeatedly: most SMB financial analysis is backward-looking, infrequent, and siloed. Business owners review last quarter’s numbers, feel relieved or worried, and then go back to running the business. Nothing changes. The same surprises repeat.

The core problem is that looking at last quarter’s numbers alone guarantees surprises in tough times. Markets shift. Customer behavior changes. Input costs move. A quarterly review that only looks backward gives you a 90-day lag before you can react. By then, the damage is already done.

What actually works is building a monthly rhythm of three specific habits. First, run a variance review every single month. Compare actuals to budget line by line and force yourself to explain every variance over 10%. This builds pattern recognition faster than any financial course. Second, track five to seven core ratios on a rolling 12-month basis. Seeing a trend develop over eight months is far more valuable than a snapshot. Third, benchmark against your own prior periods before you benchmark against industry averages. Your business is your best baseline.

Expert nuance confirms that single metrics lack context and that trend analysis combined with industry-specific benchmarks is the only reliable way to avoid misinterpretation. We’ve seen businesses with excellent current ratios run out of cash because they ignored DSO trends. We’ve seen businesses with thin margins outperform peers because their cash conversion cycle was optimized. The number alone is never the story.

The other shift that changes outcomes is the nature of the conversation around the numbers. Most SMB owners talk to their accountant once a year at tax time. That’s compliance, not strategy. A CFO support workflow built around monthly reviews, forward-looking forecasts, and scenario planning changes what questions you even think to ask. It moves you from “what happened?” to “what should we do next?” That shift is where real growth comes from.

Outsourced and fractional CFOs change the nature of analysis because they bring pattern recognition from dozens of businesses across multiple industries. They know what a 48-day DSO means for a services firm versus a product company. They know when a gross margin drop is a pricing problem versus a cost problem. That context is worth more than any spreadsheet.

Take your SMB financial analysis to the next level

If reading this made you realize your financial analysis has gaps, you’re not alone. Most SMBs are working with good data and limited interpretation. The good news is that you don’t need to hire a full-time CFO to fix it.

https://johngalt-finance.com

John Galt Finance provides outsourced CFO-level expertise built specifically for businesses like yours, with 5 to 50 employees and revenues between $500K and $20M. Our team delivers the kind of financial analysis that turns your existing reports into genuine strategic insight. From profitability diagnostics to cash flow forecasting to variance review frameworks, we build the financial infrastructure that growing businesses need. Explore the outsourced CFO benefits that our clients use to grow faster, or learn how remote CFO services can give you senior financial expertise without the overhead. If you’re ready to think bigger about your finance function, start by exploring what outsourcing your finance team actually looks like in practice.

Frequently asked questions

What is the difference between financial reporting and financial analysis?

Financial reporting organizes and presents past data, while analysis interprets that data to identify trends, risks, and action opportunities. Financial analysis enables data-driven decisions for growth and stability, going well beyond what a standard report shows.

Which financial ratios are most important for SMBs to track?

Current ratio, quick ratio, gross margin, and net profit margin are the most critical for monitoring liquidity and profitability. Key ratio methodologies also include ROE, ROA, and debt-to-equity for a complete picture of financial health.

How often should SMBs conduct financial analysis?

SMBs should perform in-depth financial analysis at least quarterly, with monthly reviews strongly recommended for fast-moving or growth-stage companies. Monthly variance reviews in particular catch problems before they compound.

What are the signs that an SMB could benefit from outsourced CFO services?

If your business faces cash flow surprises, inconsistent margins, or lacks clear financial forecasting, outsourced CFO support can help unlock growth and stability. Preparing for a funding round or acquisition is another strong signal that senior financial expertise is needed.

Does benchmarking always reflect a healthy SMB?

No. Industry benchmarks vary significantly by sector, business model, and growth stage, so a number that looks healthy in one context can signal risk in another. Single metrics lack context, so always compare your own trends over time alongside any external benchmark.

FAQ

What’s the single most important financial ratio for an SMB?

Cash conversion cycle (DSO + DIO – DPO). It tells you how many days your cash is locked up in operations. A 10-day improvement at $5M revenue frees ~$137k in working capital. Profitability ratios matter, but liquidity kills businesses faster.

How do I benchmark my SMB against the industry?

Sources by reliability: RMA Annual Statement Studies (gold standard, paid), BizMiner, IBISWorld, and your industry trade association. Apply benchmarks to revenue tiers similar to yours; comparing a $2M business to industry medians (often skewed by $50M+ firms) is misleading.

What’s a healthy gross margin for my business?

Depends on model: SaaS 70-85%, professional services 40-60%, distribution 15-30%, retail 30-50%, manufacturing 25-45%. See our profit margin analysis guide for diagnostic frameworks.

How often should I analyze my financials in depth?

Monthly variance review (1 hour), quarterly deep-dive (half day), annual strategic review (2 days). Quarterly is where most SMBs find the most insight; it’s enough time for trends to emerge but not so much that issues fester.

What financial analysis matters most before raising capital?

Unit economics (CAC, LTV, payback period), cohort retention, gross margin trend, and a clean cash flow bridge from net income to free cash flow. Investors will discount your valuation by 20-40% if these aren’t ready. See our investor-readiness guide.

Share this:

Agency Financial Management: CFO Playbook for Creative Firms

Agency financial management is the discipline that separates creative and consulting firms that scale profitably from those that drown in chaotic billing, leaking margins, and unpredictable cash flow. Whether you run a 10-person design studio, a 50-person digital marketing agency, or a 200-person consulting firm, the financial mechanics are deceptively similar — and most agency owners are leaving 5 to 15 points of margin on the table because nobody is watching the right numbers. This guide is the CFO playbook for running an agency like a real business: utilization, gross margin by client, revenue per FTE, working capital, and the dashboard that ties it all together.

Table of Contents

Key Takeaways

ThemeWhat matters
Healthy gross margin50-60% for agencies; below 45% means pricing or staffing is broken
Target utilization60-70% billable for senior staff, 75-85% for delivery staff
Revenue per FTE$150K-$250K is healthy for SMB agencies; $300K+ for premium firms
Cash cycleBill 50% upfront on projects; net-15 on retainers; chase AR weekly
Profitability per clientTrack gross margin per client every month — fire the bottom 10%
Forecast horizon13 weeks of cash; 90 days of pipeline; 12 months of capacity

The Economics of an Agency Business

An agency is a labor arbitrage business dressed up as a creative one. You buy time from your team at one rate and sell it to clients at a higher rate. Every margin dollar you keep depends on three levers: how much your people charge per hour (rate), how many of their hours are billable (utilization), and how much of those billed hours actually get paid (realization). When agency financial management is weak, all three leak simultaneously and the owner cannot see it until the bank account drops.

Creative and consulting firms also have a brutal feature most product businesses lack: revenue stops the moment delivery stops. There is no inventory, no recurring license, no marketplace flywheel — just talent on calendars. That means cash flow forecasting, capacity planning, and pricing discipline are not optional. They are the business.

The agency P&L structure that actually works

Most agencies use a generic chart of accounts and then wonder why they cannot explain their margin. A clean agency P&L looks like this:

LineWhat goes hereTarget % of revenue
Revenue (Net Service Revenue)Fees billed; subtract pass-through media/contractor costs to get true NSR100%
Direct labor (delivery team)Salaries, benefits, freelancers on client work40-50%
Gross marginNSR minus direct labor50-60%
Overhead (admin, sales, ops)Non-billable staff, rent, software, sales30-40%
EBITDAWhat you keep before tax and owner draws15-25%

If your gross margin sits below 45%, you have a pricing or staffing problem. If your EBITDA sits below 10%, you have an overhead problem. Knowing which of the two is broken is the first job of fractional CFO support.

The 8 Metrics That Define Agency Health

Agency financial management collapses to eight numbers. Track these monthly and you will diagnose 90% of problems before they bleed cash.

MetricFormulaHealthy range
Net Service Revenue (NSR)Gross billings − pass-through costsTrends up 15-25% YoY
Gross margin %(NSR − direct labor) / NSR50-60%
Utilization rateBillable hours / available hours60-85% by role
Realization rateBilled amount / standard rate × hours worked85-95%
Effective hourly rate (EHR)Project revenue / hours worked$125-$300 SMB; $300-$600 premium
Revenue per FTEAnnualized NSR / total FTEs$150K-$300K
DSO (days sales outstanding)AR / (revenue / 365)30-45 days
Client concentration% of revenue from top 1 / top 3 clientsTop 1 ≤25%, top 3 ≤50%

Utilization, Realization, and Effective Hourly Rate

Three metrics drive almost every dollar of gross margin in an agency: utilization, realization, and effective hourly rate. They are easy to confuse and even easier to fudge. Get them right and pricing decisions become obvious.

Utilization rate

Utilization measures what share of your team’s available hours are billable to clients. A senior designer with 40 hours a week and 4 weeks of PTO has roughly 1,920 available hours per year. If 1,344 of those hours appeared on client timesheets, utilization is 70%. Critically, utilization is not “are people busy” — it is “are people billable.” Internal pitches, training, and admin do not count.

Realization rate

Realization is what share of billable hours actually convert to revenue at standard rates. A team that logs 100 hours at $200/hr standard rate “should” generate $20,000 — but if scope creep, write-downs, and discounts brought it to $17,000, realization is 85%. This is where most agencies hemorrhage margin invisibly: the timesheets look full, but invoices never match.

Effective hourly rate

EHR is the truth metric. Divide project revenue by total hours actually worked (billable plus non-billable on that engagement). If a project billed $50,000 and consumed 350 hours of team time, EHR is $143. Compare EHR to your blended cost per hour (loaded salary). A team with $90 blended cost needs EHR above $180 to hit a 50% gross margin.

Pricing Models: Hourly, Fixed, Retainer, Value

The pricing model you choose determines your cash flow shape, your margin upside, and how much your team will fight scope creep. Agency financial management requires picking the right model for each engagement, not defaulting to whatever the prospect asks for.

ModelBest forMargin upsideCash flow shape
Hourly / time and materialsOpen-ended scope, advisory workCapped — you only earn what you logLumpy; pay-as-you-bill
Fixed-fee projectDefined deliverables, mature playbooksHigh when efficient; brutal if scope creepsFront-loaded (50% deposit recommended)
Monthly retainerOngoing services, predictable workloadStable; depends on scope disciplineSmooth, recurring — the gold standard
Value-based / outcomeStrategic work with measurable ROI for clientHighest — 70%+ margins possibleOften performance milestones

Healthy agencies aim for 50-70% of revenue from retainers, 20-40% from fixed-fee, and the rest from time-and-materials or value-based work. Retainers stabilize cash flow and free your team from constant repricing. If your revenue mix is 80% project-based, your 13-week cash flow will whipsaw every quarter — and that is not a finance problem, it is a business model problem.

Mini case study: pricing fix at a 22-person design agency

A boutique brand-design firm came in at 38% gross margin despite charging “premium” rates. The audit showed three issues: (1) every project was fixed-fee with no contingency, (2) scope changes were rarely re-priced because account managers feared losing the client, (3) junior staff were doing 45% of revisions at senior-level pricing assumptions. Fix: shifted top 12 clients to monthly retainers with a defined hour bank, added a 15% contingency to fixed-fee bids, and built a scope-change SOP that auto-triggered a change order at hour 10 of overage. Result: gross margin climbed to 56% in five months without losing a single client.

Cash Flow Management for Project-Based Revenue

An agency that grows revenue 30% in a year can run out of cash in the same year. New projects often require hiring before revenue lands, deposits arrive late, and clients delay payment by 30-60 days. Cash flow management is the single most under-invested area of agency financial management.

The three cash rules every agency needs

  • Bill upfront when you can. 30-50% deposit on fixed-fee work, billed on signing. Net-15 terms on retainers, invoiced on the 1st of each month. Pass-through media costs billed in advance, not after spend.
  • Chase AR weekly, not monthly. Set a hard cadence: day 7 friendly reminder, day 21 escalation to the account lead, day 35 to the agency owner, day 45 stop work clause activated. A disciplined process drops DSO from 60 days to under 40.
  • Hold a runway buffer. Agencies should hold 2-3 months of operating expenses in cash. If you are below 1 month, every late invoice becomes a payroll panic.

The hiring-revenue gap

The most common cash trap: an agency wins a big retainer, hires three people to deliver it, and then the client pays 60 days later than expected. For 60-90 days the agency is paying full burdened salary with no offsetting revenue. The fix is mathematical, not emotional — model the hire in your revenue forecast, line up a hiring trigger (deposit cleared, retainer signed, two months pipeline visible), and never hire on faith.

Building a Weekly Agency Financial Dashboard

An agency financial dashboard should fit on one page and take under 15 minutes to review each Monday. The leadership team scans it, identifies anomalies, and ends the meeting with two or three decisions. That is the operating discipline that compounds.

SectionMetricsDecision it drives
CashBank balance, AR aging, AP aging, runway in weeksDo we have a cash issue this month?
PipelineWeighted pipeline next 90 days, win rate, average deal sizeDo we need to push sales harder?
UtilizationBillable % by role, top 5 over/under-utilized peopleReassign work, hire, or sell more
Client marginGross margin % per top 10 clientsRe-price or fire underperformers
Project healthProjects over budget by hours, scope changes pendingIssue change orders
P&LMTD revenue, gross margin, EBITDA vs. planCourse-correct spending

This is also where most agencies discover that their profit margin leaks are concentrated in 2-3 clients. The bottom 10% of clients often consume 25% of capacity at 15% gross margin. Once visible, the fix is almost always to re-price or off-board them.

Common Mistakes That Kill Agency Profitability

1. Counting pass-through revenue as “real” revenue

An ad agency that books $1M in client media spend at cost and calls it “revenue” is fooling itself. NSR strips out pass-throughs and reflects what your firm actually earns. Track NSR, not gross billings.

2. No client-level P&L

If you cannot tell me which clients are profitable and which are not, you do not have agency financial management — you have bookkeeping. Allocate direct labor (timesheet-based) to every client and review the table monthly.

3. Pricing based on cost, not value

Cost-plus pricing caps your margin upside forever. The same Shopify build for a $5M DTC brand and a $50M DTC brand should not cost the same — value to the buyer is 10x different. Move strategic work to value-based pricing where possible.

4. Ignoring overhead drift

Software subscriptions, freelance contractors, and “we should have” hires creep into overhead without anyone noticing. Run a quarterly overhead audit — every recurring cost over $200/month needs an explicit owner and renewal date.

5. Treating utilization as a target instead of a diagnostic

Pushing utilization above 85% sustainably burns out senior people and crushes working capital through turnover costs. Use utilization to spot under-loaded or over-loaded teams, not as a stick.

Actionable Checklist: Agency Financial Management in 30 Days

  • Rebuild the P&L with NSR, direct labor, gross margin, overhead, EBITDA
  • Calculate utilization, realization, and effective hourly rate by role for last 90 days
  • Pull gross margin by client for last 12 months — identify bottom 10%
  • Audit AR aging — set up weekly chase cadence
  • Build a 13-week cash flow forecast with deposits, retainer cycles, and payroll dates
  • Document pricing tiers and minimum acceptable EHR by service line
  • Create a one-page weekly dashboard the leadership team will actually use
  • Set a retainer mix target (% of revenue) and a 12-month plan to get there
  • Pick three clients to re-price or off-board this quarter
  • Establish a hiring trigger tied to pipeline, not optimism

If you would rather not build this alone, John Galt Finance specializes in agency financial management for creative and consulting firms in the $500K-$20M range. Book a free consultation and we will walk through your numbers in 30 minutes.

FAQ

What is a healthy gross margin for an agency?

For most creative and consulting firms, 50-60% gross margin (NSR minus direct labor as a % of NSR) is healthy. Below 45% signals a pricing or staffing problem. Specialized firms doing premium strategy or technology work can reach 65-70%.

How is agency financial management different from general SMB finance?

Agencies have no inventory and no recurring license revenue — every dollar comes from billable time. That makes utilization, realization, and pricing the dominant levers, and it makes cash flow far more sensitive to project timing. Agency financial management therefore puts more weight on operational metrics than a traditional P&L review would.

What utilization rate should I target for my team?

Target 60-70% billable utilization for senior staff (who also sell, mentor, and run delivery), 75-85% for mid-level delivery staff, and 80-90% for freelancers. Sustained utilization above 85% for any full-time employee leads to burnout, mistakes, and turnover that quietly destroys margin.

When should an agency hire a fractional CFO?

Once you cross roughly $1M in NSR and have at least 8-10 FTEs, the financial complexity outgrows the founder. A fractional CFO typically pays for themselves through margin improvement, pricing discipline, and cash flow visibility within 90 days. Below $750K NSR a strong bookkeeper plus quarterly advisory is often sufficient.

How do I price a new agency service line?

Start with target gross margin (say 55%), back into the minimum EHR your team needs, then sanity check against market rates and the value the client receives. Pilot with three clients on a fixed-fee basis to validate scope and hour assumptions, then convert to retainer where possible. Re-price every 12 months — agency rates lag inflation by default.

Share this:

How to analyze cash flow: smart steps for SMB owners

Cash Flow Analysis Benchmarks

MetricBenchmark
Recommended cash flow forecast horizon (short-term)13 weeks
Recommended cash flow forecast horizon (strategic)12-36 months
Forecast accuracy target (13-week)+/- 10% by week 4
SMBs that fail due to cash flow problems82% (US Bank study)
Median DSO (B2B SMB, US)40-50 days
Best-in-class DSO25-35 days
Cash conversion cycle target (manufacturer)<60 days
Cash conversion cycle target (SaaS, prepaid)Negative (cash in before delivery)

Running a business where you can barely cover two weeks of expenses is more common than most owners admit. Small business cash buffer data shows the median SMB has just 27 days of cash on hand, and half operate with fewer than 15. That’s not a margin for error — that’s a countdown. The good news is that CFO-level cash flow analysis isn’t reserved for companies with finance departments. With the right process, any SMB owner can turn a confusing pile of bank statements into a clear, actionable picture of where their money is going and when it will run out.

Table of Contents

Key Takeaways

PointDetails
Timing beats revenueTracking when cash actually enters and leaves matters more for SMB survival than revenue recognition.
Use rolling forecastsRegularly updated rolling forecasts offer the clearest view of liquidity, preventing surprises.
Direct vs indirect methodsChoose direct for short-term liquidity insights, indirect for big-picture planning—don’t rely on only one.
Reconcile profit and cashVerify your cash flow by thoroughly reconciling profit-to-cash, catching errors before they impact business decisions.
Small buffers are riskyHalf of SMBs operate with less than 15 days of cash buffer—raising risk if forecasts are inaccurate.

Understanding the basics of cash flow analysis

Cash flow and profit are not the same thing. This distinction trips up more business owners than almost any other financial concept. You can show a healthy net income on paper while your checking account is empty because a big client hasn’t paid yet, or because you prepaid six months of rent. Cash flow measures the actual movement of money in and out of your business during a specific period, regardless of when revenue was earned or expenses were incurred.

There are two standard methods for preparing a cash flow analysis, and understanding both gives you a real edge:

  • Direct method: You add up every actual cash receipt (customer payments, loan proceeds, asset sales) and subtract every actual cash payment (supplier invoices paid, payroll, rent, taxes). This method gives you transaction-level clarity and is especially useful for short-term liquidity decisions.
  • Indirect method: You start with net income from your income statement and then make adjustments for non-cash items (like depreciation) and changes in working capital (like increases in accounts receivable or inventory). This method ties directly to your financial statements and is more common for longer-term planning.

Cash flow analysis is commonly prepared using either the indirect method or the direct method, and each has a distinct purpose depending on your planning horizon.

FeatureDirect methodIndirect method
Starting pointActual receipts and paymentsNet income
Best forShort-term liquidityLong-term planning
Ties to financial statementsLess directlyYes
Transaction-level detailYesNo
Ease of preparationMore labor-intensiveEasier with accounting software

One of the most important things to internalize: timing of cash receipts and disbursements matters far more than revenue recognition for real-life liquidity decisions. A sale recorded in March doesn’t help you pay your team in February. This is why improving cash flow starts with understanding the gap between when you earn money and when you actually receive it. For a practical framework on improving cash flow, focusing on timing is the first and most critical step.

Statistic callout: The median SMB cash buffer is just 27 days. Half of all small businesses operate with fewer than 15 days of cash available. A single delayed payment from a major client can push you into crisis territory almost immediately.

Pro Tip: Don’t just track cash flow monthly. The month-end view hides intra-month cash crunches that can blindside you mid-payroll cycle.

Preparation: Essential data and tools for cash flow analysis

With the basics in place, let’s gather the materials and data you’ll need to analyze cash flow effectively.

Before you build any analysis, you need the right raw materials. Skipping this step is like trying to bake without checking if you have flour. The inputs you gather determine the accuracy of everything that follows.

Here are the core data sources you’ll need:

  • Bank statements: Every account your business uses, ideally for the last 12 months. These are your ground truth.
  • Accounts receivable aging report: Shows who owes you money and how long each invoice has been outstanding.
  • Accounts payable aging report: Shows what you owe suppliers and when those payments are due.
  • Payroll records: Frequency, amounts, and any irregular bonuses or commissions.
  • Loan and debt schedules: Principal and interest payment dates and amounts.
  • Income statement and balance sheet: Needed for the indirect method and for reconciling your analysis.
Data inputFormatWhy it matters
Bank statementsPDF or CSV exportConfirms actual cash movement
Accounts receivable agingAccounting software reportReveals collection timing risk
Accounts payable agingAccounting software reportIdentifies upcoming cash needs
Payroll recordsPayroll system exportLargest recurring outflow for most SMBs
Loan schedulesLender statementsFixed obligations that can’t be missed
Income statementMonthly P&LBaseline for indirect method reconciliation

For tools, a spreadsheet works for businesses just getting started, but accounting software with built-in cash flow reporting (such as QuickBooks, Xero, or FreshBooks) dramatically reduces manual work. A rolling cash flow forecast template, updated regularly, is the single most valuable tool you can add to your financial toolkit. Tracking SMB financial metrics alongside your cash flow data gives you a more complete picture of business health.

One important limitation to flag: the indirect method doesn’t show daily liquidity timing or transaction-level clarity. If you need to know whether you can cover payroll on Thursday, the indirect method alone won’t tell you. That’s when you need to layer in bank-level transaction data.

Pro Tip: Always reconcile your cash flow statement against your bank statements before drawing any conclusions. If the numbers don’t match, you have a data problem, not a cash flow problem. Fix the data first.

Execution: Step-by-step process to analyze cash flow like a remote CFO

Once you’ve assembled your tools and data, it’s time to execute a systematic CFO-level cash flow analysis.

This is where most business owners either skip steps or get overwhelmed. The key is following a repeatable process so your analysis improves every time you do it.

Step 1: Choose your method. For short-term decisions (the next 4 to 13 weeks), use the direct method. For longer-term planning and investor reporting, use the indirect method. Many experienced CFOs use both simultaneously.

Business owner sorts receipts choosing method

Step 2: Gather and organize your data. Pull all inputs identified in the preparation phase. Organize bank transactions by category: operating receipts, operating payments, investing activities, and financing activities.

Step 3: Build your cash flow statement. Map every transaction to its correct category. For the direct method, total up receipts and payments. For the indirect method, start with net income and work through your adjustments line by line.

Step 4: Create a rolling forecast. Don’t stop at historical analysis. Project forward 13 weeks using known commitments (payroll, rent, loan payments) and realistic revenue expectations. A cash flow forecasting guide can walk you through building this model from scratch.

Step 5: Run scenario analysis. What happens if your biggest client pays 30 days late? What if revenue drops 20%? Scenario testing is what separates reactive business owners from proactive ones. Financial scenario planning gives you the tools to stress-test your assumptions before reality does it for you.

Step 6: Track variance and refine. Compare your forecast to actual results every week. Where were you wrong? Why? Refining your assumptions over time makes your forecasts dramatically more accurate. A 13-week cash flow model is the gold standard for this kind of rolling visibility.

Infographic shows 5 step cash flow analysis process

A remote-CFO methodology centers on rolling forecasts, updating based on real results, running scenarios, and tracking variances — not just producing a static report once a quarter.

MethodProsCons
DirectTransaction-level detail, great for short-termLabor-intensive, harder to automate
IndirectTies to financials, easier to prepareMisses intra-period timing gaps

Direct vs. indirect cash forecasting shows that neither method is universally better. Direct works best for short-term liquidity decisions; indirect ties to your financial statements for longer-term planning. Smart CFOs use both.

“Confusing revenue recognition with cash timing is a core driver of forecasting failure.”

Pro Tip: Update your cash flow forecast weekly, not monthly. A monthly update means you’re always looking at stale data. Weekly updates catch problems before they become crises.

Verification: Common mistakes and review techniques

After completing your cash flow analysis, verifying accuracy and catching avoidable mistakes can be the difference between thriving and struggling.

Even experienced finance professionals make errors in cash flow analysis. The most damaging mistakes are the ones that look correct on the surface but silently distort your picture of liquidity.

Common errors to watch for:

  • Missed transactions: Small recurring charges (subscriptions, bank fees, insurance auto-debits) are easy to overlook but add up quickly over a quarter.
  • Reversed signs in working capital: An increase in accounts receivable is a use of cash, not a source. Getting this backward is one of the most frequent indirect-method errors.
  • Misclassified payment timing: Recording a payment in the month it was invoiced rather than the month it was actually paid distorts both historical analysis and forward forecasts.
  • Mixing operating and financing cash flows: Loan repayments belong in financing activities, not operating expenses. Misclassifying them inflates your apparent operating cash flow.
  • Ignoring seasonal patterns: Comparing a slow January to a strong December without context leads to false alarms or false confidence.

When you finish your analysis, always sense-check the profit-to-cash reconciliation to reduce classification and arithmetic errors. Ask yourself: does the difference between my net income and my operating cash flow make logical sense given my business model?

For example, if your net income was $50,000 but operating cash flow was only $10,000, you need to understand exactly why. Was it a big increase in receivables? Did you build up inventory? Each gap should have a clear, explainable cause.

Exploring cash flow management strategies and building a CFO support workflow into your regular routine makes verification a habit rather than a one-time scramble.

Statistic callout: Half of SMBs operate with under 15 days of cash buffer. A single misclassified transaction or missed payment can cascade into a liquidity crisis faster than most owners expect.

Pro Tip: After completing your analysis, ask one simple question: “Does the profit-to-cash flow difference make sense for my business right now?” If you can’t explain the gap clearly, dig deeper before making any decisions based on the numbers.

What most SMBs miss about cash flow analysis

Here’s the uncomfortable truth: most business owners treat cash flow analysis as a compliance task. They run the report, glance at the bottom line, and file it away. That approach leaves enormous strategic value on the table.

The textbook methods — direct, indirect, rolling forecasts — are only the starting point. What actually separates businesses that thrive from those that constantly scramble for cash is how often they engage with their numbers and what they do with the information.

We’ve worked with SMB owners who had technically correct cash flow statements that they reviewed quarterly. They were always surprised by cash crunches. The owners who avoided those surprises weren’t smarter — they were just more frequent. Weekly review cycles catch problems when they’re still small and fixable.

There’s also a mindset issue. Too many business owners are obsessed with profit metrics: gross margin, EBITDA, net income. These matter, but they don’t tell you whether you can make payroll on Friday. Cash timing is the operational reality. Profit is an accounting construct. When the two diverge, cash always wins.

“Cash flow isn’t just a periodic report — it’s the heartbeat of your business.”

The businesses we see make the biggest improvements are the ones that connect their custom financial modeling process to their weekly operational decisions. They use their cash flow forecast to decide when to hire, when to invest in equipment, and when to push harder on collections. That’s what turns analysis into a strategic asset.

Pro Tip: Treat your cash flow statement as a living document. Update it weekly, use it to drive operational decisions, and never let it become just a compliance checkbox.

CFO-level tools and support for robust cash flow analysis

For SMBs ready to move from theory to practice, robust CFO-style support is at hand.

Building a reliable cash flow analysis process takes time, and the stakes are too high to rely on guesswork. John Galt Finance specializes in giving SMB owners the same quality of financial insight that Fortune 500 companies get from their finance teams — without the cost of a full-time CFO.

https://johngalt-finance.com

Whether you need a cash flow forecasting guide to build your first rolling model, a custom financial modeling engagement to stress-test your business assumptions, or ongoing support to implement SMB cash flow strategies that actually stick, the platform offers tailored solutions for businesses generating between $500K and $20M in revenue. Stop managing cash flow reactively. Start using it as the strategic tool it was always meant to be.

Frequently asked questions

What is the difference between the direct and indirect cash flow analysis methods?

The direct method sums actual cash receipts and payments by category, while the indirect method starts with net income and adjusts for non-cash items and working capital changes. Direct is better for short-term liquidity visibility; indirect ties more naturally to your financial statements.

How often should my business update its cash flow forecast?

Best practice for SMBs is to update cash flow forecasts weekly. Rolling forecasts updated weekly and tracked against actual results allow you to refine assumptions and catch problems before they become crises.

What is a cash buffer and how much is enough?

A cash buffer is the number of days your business can cover typical outflows if inflows stop. The median SMB cash buffer is 27 days, but half of small businesses operate with fewer than 15 days, which leaves very little room for unexpected delays or disruptions.

How can I avoid common errors in cash flow analysis?

Always sense-check the profit-to-cash reconciliation after completing your analysis, and review working capital sign conventions carefully to reduce misclassification and arithmetic errors that can distort your liquidity picture.

FAQ

How often should I update my cash flow forecast?

Weekly for the 13-week rolling forecast, monthly for the 12-month strategic view. The 13-week is the operational cockpit; the 12-month informs financing and capex decisions. See our 13-week cash forecasting guide for the mechanics.

What’s the most common cash flow mistake SMB owners make?

Confusing profit with cash. A profitable business can run out of cash through receivables growth, inventory build, or capex timing. Always reconcile net income to operating cash flow monthly; if the gap widens, investigate immediately.

How do I improve cash flow without raising prices?

Five levers ranked by speed: (1) collect AR faster (deposits, milestone billing), (2) extend AP terms with negotiation, (3) reduce inventory turns, (4) cut discretionary opex 5-10%, (5) sell non-core assets. Most SMBs find 30-60 days of cash by tightening AR alone.

What metrics matter most in cash flow analysis?

DSO (days sales outstanding), DPO (days payable outstanding), DIO (days inventory outstanding), and the cash conversion cycle (DSO + DIO – DPO). Track all four monthly. A 10-day improvement in CCC at $5M revenue frees roughly $137k in working capital.

Should I use direct or indirect cash flow forecasting?

Use direct (line-by-line receipts and disbursements) for the 13-week. Use indirect (starting from net income) for 12-36 months and integration with the strategic model. Direct forecasts are far more accurate for the short term but tedious past 6 months.

Share this:

CFO-level financial reporting examples and KPI insights

CFO Reporting & KPI Benchmarks

MetricBenchmark
Monthly close time (best-in-class SMB)5-7 business days
Monthly close time (typical SMB)15-25 business days
Reports in a standard CFO board packageP&L, BS, CF, 13-week forecast, KPI dashboard, variance commentary
KPIs on a CEO dashboard (sweet spot)7-12
Material variance threshold (revenue)+/- 5% vs budget
Material variance threshold (margin)+/- 3 percentage points
Gross margin (SaaS)70-85% (Bessemer benchmark)
EBITDA margin (mature SMB services)10-20%

Most business owners running companies between $1M and $10M in revenue have the same frustrating experience: they get monthly financial reports that show revenue, expenses, and a bottom line, but those numbers don’t actually tell them what to do next. The spreadsheet looks clean. The accountant says everything is fine. And yet, you still can’t answer basic questions like “Can we afford to hire?” or “Why did margins drop last quarter?” That gap between raw numbers and real decision-making is exactly where CFO-level financial reporting earns its value, and understanding what those reports look like is the first step to building them.

Table of Contents

Key Takeaways

PointDetails
CFO-level reporting criteriaGood financial reporting tells the story behind numbers and links them to business decisions.
Essential statement templatesUse income, balance, cash flow statements with organized notes for comprehensive packs.
Actionable KPIsTrack liquidity, profitability, and efficiency metrics to drive smarter decisions.
Reporting with contextSupplement statements with narrative commentary and carefully structured disclosures.
Beyond templatesTemplates are useful, but actionable insights require tailored CFO-level analysis.

What makes CFO-level financial reporting different?

Having set the stage for why basic reporting isn’t enough, let’s break down the criteria for genuine CFO-level financial reporting.

The most important shift is this: CFO-quality reporting treats financial data as a narrative, not a ledger. A profit and loss statement tells you what happened. A CFO-level report tells you why it happened, what it means for your cash position, and what you should do about it. That distinction sounds simple, but it changes everything about how reports are structured and read.

According to Board Intelligence, good finance reporting should be more than spreadsheets: it should explain the story behind performance and the implications for stability, cash generation, and future financing needs. That framing is the foundation of every great CFO report. Numbers without context are just noise.

Here’s what separates CFO-level reporting from standard bookkeeping output:

  • Forward-looking commentary: Not just “revenue was $480K this month” but “revenue came in 6% below forecast due to delayed project starts, which will compress Q3 cash flow unless we accelerate collections.”
  • Variance analysis: Every significant deviation from budget or prior period gets explained, not just flagged.
  • Cash flow linkage: Every P&L result is connected back to its cash impact. Profit and cash are not the same thing, and CFO reports make that distinction explicit.
  • Risk and opportunity flags: A good report surfaces emerging risks (rising days sales outstanding, thinning margins on a key product line) before they become crises.
  • Actionable recommendations: The report doesn’t just describe the situation. It tells leadership what decisions need to be made.

“The best finance reports don’t just answer ‘what happened?’ They answer ‘so what?’ and ‘now what?’ That’s where CFO-level judgment earns its place.”

The strategic CFO role is fundamentally about translating financial data into business strategy. And CFO-led financial analysis gives SME owners the same interpretive lens that large corporations rely on every quarter.

Pro Tip: Before building any new report template, write down the three decisions your leadership team needs to make this quarter. Every section of your financial report should help answer at least one of those questions directly.

Core templates: Financial statement examples and structure

With the criteria established, the next step is to explore concrete examples of report formats and structures.

A complete financial reporting pack isn’t just a P&L. It’s a structured set of documents that together paint a full picture of your business’s financial health. The KPMG general-purpose financial reporting framework confirms that a full set of financial statements includes the income statement (profit or loss), balance sheet (statement of financial position), cash flow statement, plus related disclosures and notes, and often the statement of changes in equity or retained earnings.

For SMEs, the practical reporting pack typically includes these core components:

  • Income statement (P&L): Revenue, cost of goods sold, gross profit, operating expenses, EBITDA, and net income. Shown month-to-date, year-to-date, and versus budget.
  • Balance sheet: Assets, liabilities, and equity as of the reporting date. Highlights working capital and leverage.
  • Cash flow statement: Operating, investing, and financing cash flows. This is often the most underused statement in SME reporting, yet it’s the most critical for day-to-day decisions.
  • Statement of changes in equity: Tracks retained earnings, owner distributions, and capital contributions over time.
  • Notes and disclosures: Explains accounting policies, unusual items, related-party transactions, and anything that affects how numbers should be interpreted.
Report componentMonthly packAnnual packPrimary decision use
Income statementYesYesProfitability tracking
Balance sheetYesYesSolvency and leverage
Cash flow statementYesYesLiquidity management
Changes in equityQuarterlyYesOwner value tracking
Notes and disclosuresSummaryFullAudit and transparency
KPI dashboardYesYesPerformance benchmarking
CFO commentaryYesYesStrategic narrative

For SMEs looking to learn from best-in-class examples, PwC’s IFRS 18 illustrative consolidated financial statements provide practitioner-grade templates that show exactly how notes and structured disclosures should be organized. These aren’t just for public companies. The mechanics of clear note ordering and disclosure structure apply directly to any business that wants its financials to be readable and credible.

Monthly packs should be concise, focused on current performance and near-term cash. Annual packs go deeper, with full disclosures, year-over-year comparisons, and strategic context. The SMB board reporting guide walks through how to structure these packs for different audiences, whether that’s an internal leadership team, a bank, or an investor.

SME finance team reviewing monthly reports

KPIs and benchmarks: The actionable metrics included

After outlining which key statements to use, let’s turn to actionable metrics, the KPIs that bring financial reports to life.

Raw financial statements show you the scoreboard. KPIs tell you how the game is actually being played. For SME owners building CFO-style reporting, commonly used financial KPIs typically span four categories: liquidity, profitability, efficiency, and cash conversion.

Here’s a practical numbered framework for selecting and organizing KPIs in your management pack:

  1. Start with liquidity. Current ratio (current assets divided by current liabilities) and quick ratio (excluding inventory) tell you whether you can meet short-term obligations. A current ratio below 1.2 is a warning sign for most service businesses.
  2. Layer in profitability. Gross margin percentage, EBITDA margin, and net profit margin show where value is created and where it leaks. Gross margin below 40% in a professional services firm, for example, usually signals pricing or staffing problems.
  3. Add efficiency metrics. Days Sales Outstanding (DSO) measures how long it takes to collect receivables. Days Payable Outstanding (DPO) tracks how long you take to pay suppliers. The gap between these two numbers directly affects your cash position.
  4. Close with cash conversion. The cash conversion cycle (DSO plus days inventory outstanding minus DPO) shows how efficiently your business turns operations into cash. Shortening this cycle by even 5 days can free up significant working capital.
KPIFormulaSME benchmarkWarning level
Current ratioCurrent assets / current liabilities1.5 to 2.0Below 1.2
Gross margin(Revenue minus COGS) / revenueVaries by industryDeclining trend
EBITDA marginEBITDA / revenue10% to 20% for SMEsBelow 8%
DSO(Receivables / revenue) x days30 to 45 daysAbove 60 days
Cash conversion cycleDSO + DIO minus DPOIndustry-specificLengthening trend

The real power of KPIs isn’t in any single number. It’s in tracking trends over time and comparing against industry benchmarks. A gross margin of 38% might be fine for a manufacturing business but alarming for a software company. Context is everything.

Pro Tip: Pick no more than 8 to 10 KPIs for your monthly management pack. Too many metrics create noise and dilute focus. Choose the ones that directly connect to your three biggest business risks or growth levers.

Resources like mastering financial KPIs and essential SMB financial metrics provide deeper guidance on selecting the right metrics for your specific business model. For real-time tracking, a well-designed daily financial dashboard can surface KPI movements before they show up in your monthly report. And if you’re just getting started, financial KPIs to track offers a practical starting point for building your first metrics framework.

Real-world reporting: How public companies and illustrative packs handle disclosures

With metrics defined, it’s crucial to understand how reporting is enhanced by disclosures and management discussion, whether from public companies or illustrative templates.

Public company reporting gives SME owners a masterclass in how to structure and communicate financial information. The Boeing Q1 financial results announcement is a strong example of how management discusses GAAP results alongside non-GAAP metrics, with cautionary context that helps readers interpret the numbers accurately. Boeing’s reports don’t just present numbers. They explain what drove changes, what management is watching, and how results connect to forward guidance.

For SME owners, the key lessons from public company disclosure practices include:

  • Separate GAAP from adjusted metrics clearly. If you’re reporting EBITDA or adjusted profit, label it explicitly and explain what’s been excluded and why. Mixing the two without explanation erodes trust with lenders and investors.
  • Use systematic note ordering. EY’s IFRS 18 illustrative financial statements demonstrate how careful note structuring makes information easier to find and understand. The same principle applies to any management pack: organize notes logically so readers can navigate without hunting.
  • Write a management discussion section. Even a one-page narrative summarizing the period’s key results, what drove them, and what’s coming next transforms a data dump into a useful document.
  • Flag non-recurring items. One-time costs, insurance recoveries, or unusual gains should be identified separately so readers can assess underlying performance accurately.

“Disclosures aren’t bureaucratic box-ticking. They’re the difference between a report that builds confidence and one that raises more questions than it answers.”

Understanding why SMEs need CFO services often comes down to exactly this point. Most small business owners don’t have the background to write effective management commentary or structure disclosures clearly. That’s not a criticism. It’s just not what most entrepreneurs are trained to do. A CFO advisory guide can help you understand what level of support makes sense for your current stage.

Why templates alone aren’t enough: The narrative SME owners need

Once the structures and disclosures are understood, it’s critical to recognize where templates fall short, and how true CFO-level reporting moves beyond forms to actionable insight.

Here’s the uncomfortable truth about financial report templates: they’re a starting point, not a solution. A beautifully formatted income statement with clean variance columns is still useless if the person reading it doesn’t understand what the variances mean for the business’s next 90 days.

We’ve worked with business owners who had technically complete financial reporting packs, every statement present, every KPI calculated, and still made poor decisions because the reports didn’t connect numbers to context. The gross margin was declining for six months before anyone flagged it as a pricing problem rather than a volume problem. The distinction matters enormously for the fix.

Real CFO-level reporting requires judgment. It requires someone who knows your business well enough to say, “The DSO increase this month isn’t random. It’s concentrated in two clients who always pay late in Q4, and we’ve already addressed it.” That sentence is worth more than any template.

Story-driven commentary changes outcomes in three specific ways. First, it forces the person writing the report to actually understand the numbers, not just format them. Second, it gives leadership a shared interpretation of reality, reducing the time spent in meetings debating what the numbers mean. Third, it creates an audit trail of reasoning that helps you learn from past decisions.

The best advice for SME owners moving beyond template copying is to start with one question per section: “What does this number tell us about our ability to execute our strategy?” If the answer is “nothing,” either the metric is wrong or the commentary is missing. Industry-specific analysis adds another layer, because the benchmarks and warning signals in a retail business look completely different from those in a professional services firm or a manufacturing operation.

Templates give you the skeleton. Narrative commentary gives it a pulse.

Next steps: Build smarter reports with proven tools

You now have a clear picture of what separates a basic financial report from one that actually drives decisions. The structure matters. The KPIs matter. The disclosures matter. But the narrative layer is what makes it all actionable for your leadership team.

https://johngalt-finance.com

At John Galt Finance, we build customized financial reporting packs for SMEs that combine all of these elements: structured statements, benchmarked KPIs, management commentary, and forward-looking cash flow analysis. Whether you need a monthly management pack, a board-ready report, or a full CFO advisory engagement, our team delivers the same quality of financial insight that large companies pay full-time CFOs to produce. If you’re ready to move beyond spreadsheets and start making decisions from real financial intelligence, explore our outsourced CFO services and see how we tailor reporting to your specific industry and growth stage.

Frequently asked questions

What are the main components of a financial reporting pack?

A standard pack includes the income statement, balance sheet, cash flow statement, statement of changes in equity, and accompanying notes and disclosures. As KPMG confirms, a full set of financial statements also includes related disclosures and notes that provide essential context.

What KPIs should small business owners track in their reports?

Key KPIs include liquidity ratios, profitability margins, efficiency measures, and cash conversion metrics tailored to your business model. NetSuite’s guidance on CFO-style reporting confirms that gross and net profit margins alongside cash conversion measures are the most commonly used metrics for decision-making.

How do public company reports differ from SME reporting?

Public company reports must follow strict GAAP or IFRS standards, often supplement results with non-GAAP metrics, and include extensive management commentary. SMEs adapt these practices for practical insight without the full regulatory burden, using the same structural logic at a smaller scale, as illustrated by Boeing’s reporting approach.

Why is CFO commentary important in financial reports?

CFO commentary explains the context behind numbers and guides owners to understand cash flow, financing needs, and future decisions. Board Intelligence’s framework makes clear that good finance reporting must explain the story behind performance and its implications for stability and cash generation.

How can illustrative IFRS templates help SME owners?

They provide structured examples of financial statements, notes, and disclosures that help owners organize reports more clearly and professionally. PwC’s illustrative IFRS statements show exactly how mechanics and structured disclosure organization should work in practice.

FAQ

What KPIs should I see every month as an SMB owner?

At minimum: revenue vs budget, gross margin, EBITDA, cash balance, AR days, AP days, customer count, and gross retention. Anything beyond 12 KPIs becomes a dashboard nobody reads. See our financial dashboard guide for a build template.

How long should monthly close take?

Best-in-class SMBs close in 5-7 business days. If you’re past business day 15, the cause is almost always one of three things: waiting on credit card statements, slow AR reconciliation, or no documented close checklist. Fix the process, not the team.

What’s the difference between management reporting and financial reporting?

Financial reporting is GAAP-compliant statements for outside parties (banks, investors, IRS). Management reporting is internal, often non-GAAP, and built around decisions you actually make: segment profitability, cohort revenue, sales pipeline. SMBs need both, but spend 80% of CFO time on management reporting.

How do I know if my KPIs are the right ones?

Apply the “so what?” test: if a KPI moves 20% and your action plan doesn’t change, drop it. Good KPIs are leading (predictive), actionable (you can influence them), and tied to a strategic priority. Vanity metrics like total users or website visits usually fail all three.

Should I use a BI tool or stay in Excel?

Under $5M revenue, Excel + a clean accounting system is sufficient. Between $5M and $25M, a low-cost BI layer (Looker Studio, Fathom, Jirav) pays back quickly. Over $25M, full BI plus a data warehouse becomes necessary as data sources multiply.

Share this: